
Contents
General State of the Economy
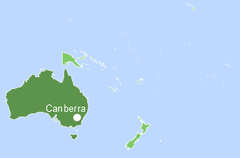
Australia, officially the Commonwealth of Australia, is the sixth largest country in the world, consisting of mainland Australia, the island of Tasmania and the islands of the Pacific and Indian Oceans.
As of 2022, the country is home to around 26 million people. Given its geographical size, Australia is one of the world’s least densely populated countries – 242nd in the world [1,2,3]. The total length of the country's coastline is 25,760 km [3].
The capital city is Canberra, and the most populated cities are Sydney, Melbourne and Brisbane. The administrative map of Australia is divided into 6 states and two territories and the political form of government is federal parliamentary constitutional monarchy. The official language is English [3].
| Australia/ Commonwealth of Australia | ||
|---|---|---|
| Capital: Canberra | Density: 3.5/km2 | Currency: Australian dollar ($) (AUD) |
| Official languages: English | Life expectancy at birth: 83.20 years | GDP (PPP): $1.719 trillion (2023 est.) |
| National Day: 26 January | Area: 7,692,024 km2 | GDP - per capita (PPP): $64,673 (2023 est.) |
| Population: 26,821,800 (2023 est.) | Coastline: 25,760 km | Internet country code: .au |
Source: [1,2,3,4,5]
Australia is an economically developed country, which is reflected in the comparative diagram of various economic indices – Fig.1.
| Sources: 1. GDP (purchasing power parity), 2020 est. / The World Factbook/Library/Central Intelligence Agency *228 2. GDP - per capita (PPP), 2020 / The World Factbook/Library/Central Intelligence Agency *229 3. Inflation rate (consumer prices), 2019 est. / The World Factbook/Library/Central Intelligence Agency *228 4. Charges for the use of intellectual property, receipts (BoP, current US$), 2020 / International Monetary Fund, Balance of Payments Statistics Yearbook, and data files. / License: CC BY-4.0 *88 5. The Global Competitiveness Index 2019 / Rankings / Reports / World Economic Forum *141 6. High-technology exports (current US$) 2019-2020 / United Nations, Comtrade database through the WITS platform / License: CCBY-4.0 / Data *134 7. 2021 Index of Economic Freedom / International Economies / The Heritage Foundation *178 8. Reserves of foreign exchange and gold, 2017 est. / The World Factbook / Library / Central Intelligence Agency *195 9. Annual average GDP growth in %, for the last 10 years (2011-2020) / World Bank national accounts data, and OECD National Accounts data files / License: CC BY-4.0 *206 10. Public debt (% of GDP), 2017 est. / The World Factbook / Library / Central Intelligence Agency (from smallest to largest) *210 * Total number of countries participating in ranking Figure 1. Economic Indices of Australia |
The basis of the economy is the services sector, which accounts for around 70% of GDP and 75% of the total employment [3]. By almost every indicator in the presented diagram, Australia places in the top 25% of the leading countries in the world included in the rating.
Since the early 1990s, the country has experienced a steady growth in GDP at purchasing power parity, both in general and per capita [4,5]. In 2017 GDP at purchasing power parity increased from $1.227 trillion in 2018 to $1.250 trillion in 2020 (18th place in the world) [3]. Australia’s GDP at purchasing power parity per capita is somewhat lower (30th place in the world in 2020), demonstrating negative negative dynamics: from $50,400 in 2017 to $48,700 in 2020 [3]. The inflation rate changed from 1.9% in 2017 to 1.6% in 2019, placing Australia 91st in the world [3].
According to the Global Competitiveness Report, presented by the World Economic Forum in 2020, Australia is 16th out of a total of 141 countries, behind the USA and Canada; the country gained four positions in the rating during last year. This rating measures the effectiveness of the use of the country’s own resources for sustainable development. In addition to a number of economic indicators this index also takes into account such variables as education, health, level of innovation, etc.
In the list of countries that export high-tech products in 2019-2020, the country was 35th out of 134 countries. According to the Index of Economic Freedom, which is based on freedom of business, freedom from government intervention, property protection, and freedom from corruption, Australia was 3rd in 2021 out of the 178 countries considered, behind New Zealand. In terms of gold reserves and foreign exchange reserves Australia is 33rd in the world.
According to average GDP growth in percentage over the last 10 years (2011-2020), in 2020 the country was 105th out of 206 countries. In terms of public debt, calculated as a percentage of the country's GDP, Australia was ranked 123rd out of 210 countries considered in 2017.
Energy Resources
Australia has significant reserves of fossil resources (Table 1); the country’s main resource is coal.
As of 2021, in terms of tons of oil equivalent, proved reserves of conventional hydrocarbons in Australia were: coal – 97%, gas – 2.7%, oil – 0.3% (Fig.5).
Table 1. Fossil energy resources of Australia
| Resource /Explanations | Crude oil* | Natural gas* | Coal* | Shale Gas** | Tight Oil** | Coal Mine Methane | Oil Shale*** |
|---|---|---|---|---|---|---|---|
| Value | 2.45(0.14%) | 113(1.6%) | 165 597(14.3%) | 429.3 | 15.6 | 732 - 1926 | 31 729 |
| Unit | billion barrels | Tcf | million short tons | Tcf | billion barrels | Bcm | million barrels |
| Year | 2021 | 2020 | 2021 | 2013 | 2013 | 2018 | 2008 |
| Source | [25] | [25] | [25] | [12] | [12] | [9,10] | [13] |
*share of the country’s reserves in world total is provided in brackets
**unproved technically recoverable
***in place resources
The unconventional natural resource matrix is as follows: shale gas – 56.2%, kerogen oil – 24.3%, tight oil – 10.6%, coal seam gas – 8.9% (Fig. 6).
Australia has the world's third largest proven coal reserves, accounting for about 14% of the world's total behind the USA and Russia, according to 2019 data [6]. In 2019, according to the Australian Government Department of Industry Innovation and Science, the Economic Demonstrated Resources (EDR) (including Proved Reserves, Probable Reserves, Measured Resources and Indicated Resources) of brown coal reserves were 73,865 million tonnes, and black coal reserves were 75,428 million tonnes. At current production levels, brown coal reserves will last for 728 years, and black coal reserves for 111 years [7]. According to Geoscience Australia, the Economic Demonstrated Resources of EGR (including Proved Reserves, Probable Reserves, Measured Resources and Indicated Resources) in 2019 amounted to 85,634 million tons of brown coal and 89,707 million tons of black coal, while the recoverable reserves of Economic Demonstrated Resources were estimated at 73,865 million tons of brown coal and 75,428 million tons of black coal [6]. The forecast in this paper is consequently more optimistic – brown coal reserves can last 1095 years, and black coal reserves for 140 years [8]. In BP's report, Australia’s total proven coal reserves in 2020 were estimated at 147 435 million tons [9]. According to calculations, made by Advanced Energy Technologies, the methane utilization potential (according to methodology based on methane emissions from [10] and coal reserves from [9]), amounted to around 732 - 1926 Bcm.
As with coal reserves, assessments of Australia's oil and gas resources has a wide discrepancy, depending on the information source. Proven oil reserves in Australia at the beginning of 2021 were estimated at 2.446 billion barrels [3]. BP’s report [9] states that oil reserves were 2.4 billion barrels, as of 2020.
In Energy in Australia 2015 [7] Economic Demonstrated Resources EDR (including Proved Reserves, Probable Reserves, Measured Resources and Indicated Resources), the reserves of conventional oil in 2014 were estimated at 856 million barrels, natural-occurring LPG at 959 million barrels, and condensate reserves at 1 938 million barrels. The level of prospective recoverable oil shale was 9 261 million barrels as of 2014, and the resource potential of tight oil was 57 022 million barrels [11]. However, according to U.S. Energy Information Administration, the unproven technically recoverable resources of tight oil in 2013 were estimated at 15.6 billion barrels [12]. The country also has the largest reserves of kerogen oil in the region, which at the end of 2008 were estimated at 31 729 million barrels [13]. According to [3] natural gas resources in the country were estimated at 3.228 Tcm in 2021.
According to the Australian Government, Australia’s identified resources of natural gas at the end of 2019 were 196,133 PJ (174 Tcf) and, at the current production level, they could last 42 years; in 2019, coal seam gas reserves are estimated at 29.79 Tcf and should be sufficient for another 133 years [6]. According to [14] the total reserves are 114 Tcf, of which 70 Tcf are natural gas and 43 Tcf are coal seam gas. As stated in [12], the unproved technically recoverable shale gas reserves in Australia were 429.3 Tcf in 2013; estimates for the probable resources of tight gas are approximately 10 times smaller - 44 Tcf [14].
Australia also has the world’s largest uranium reserves, which in 2020 were estimated at 1,239 thousand tons [7].
Australia, given its vast territory with diverse climatic zones and natural landscapes, has a rich variety of renewable energy sources. A selection of basic indicators of this type of resource is presented in Table 2.
Table 2. Renewable energy resources of Australia
| Resource/ Explanations | Solar Potential (GHI)* | Wind Potential (50 м)* | Hydro energy Potential** | Bio Potential (agricultural area) | Bio Potential (forest area) | Geothermal Potential | Municipal Solid Waste |
|---|---|---|---|---|---|---|---|
| Value | 5.5-7.1 | <6 | 150 000 | 46.6 | 17.4 | 190 | 1.54 |
| Unit | kWh/m2/day | m/s | GWh/year | % of land area | % of land area | million PJ | kg/per capita/day |
| Year | 2018 | 2018 | 2013 | 2018 | 2018 | 2010 | 2016 |
| Source | [17] | [18] | [15] | [19] | [20] | [21] | [22] |
*for most of the territory of the country
**gross theoretical capability
The gross theoretical hydro potential of the country is 150 000 GWh/year [15]. In the south and south-west of the country there is a certain potential for tidal energy, which can reach 60 kW/m or more [16].
The level of direct solar radiation for most of the country is quite high – 5.5-7.1 kWh/m2/day [17]. The maximum level of solar radiation can be observed in the west of the country – over 7.8 kWh/m2/day. The distribution of wind resources is as follows: in most of the country the wind speed does not exceed 6.0 m/s [18]. The peak of wind activity is noted in the coastal regions: in the south, south-west and south-east, where the wind speed can exceed 8.5 m/s at a height of 90 m [18].
More than 46.6% of Australia is covered by agricultural land and around 17.4% is forested [19,20]. This resource has the potential to play a significant role in energy production.
Australia has a significant geothermal potential, according to Geoscience Australia, only 1% of the country's geothermal resources, at a temperature of 150°C at a maximum depth of 5 km can provide about 190 million PJ, which is almost 25,000 times higher than the annual level of energy consumption in the country [21].
This energy review of Australia would not be complete without mentioning municipal waste (1.54 kg per capita per day), which on the one hand are valuable raw ma-terials for secondary use or energy production, and on the other hand, long-term decomposing substances that substantially pollute the natural environment [22].
Energy Balance
According to BP's report, total primary energy consumption in Australia in 2021 amounted to 5.72 exajoules, about 33.7% of which was oil, 28.5% coal, 24.8% natural gas, 2.6% hydropower, and 10.3% from renewable energy sources [8].
Slightly different figures are given by the Australian Government Department of Industry Innovation and Science: in the total volume of primary energy consumption (6,145.8 PJ in 2016-2017), the share of oil was 37.7%, coal – 31.5%, gas – 24.7%, renewable sources energy, including hydropower – 6.2% [23]. The total volume of primary energy production was 17,957.1 PJ, where coal was the leader – 71%, followed by natural gas – 23.1%, oil and NGL – 3.3%, renewable energy – 2.1%, and LPG – 0.5% [23].
In 2020 Australia was the second-largest exporter of coal and the second largest exporter of liquefied natural gas (LNG) in the world [24].
The volume of coal production in Australia in the last ten years has demonstrated steady growth (Fig. 2). Coal production in Australia has been growing since 2001 and in 2021 reached 514.93 million short tons [25]. According to [8], in 2018 the country produced 275 million tons of coal in oil equivalent. Consumption of this resource remained fairly stable, not exceeding 157 million short tons, in 2021 it totalled 109.92 million short tons [25].
Source: U.S. Energy Information Administration (Sep 2023) / www.eia.gov
Figure 2. The production and consumption of fossil fuels in Australia (coal — left, gas — in the center, oil — right)
The production of oil in Australia has been decreasing, reaching about 450 thousand barrels/day in 2021 [25], 356 thousand barrels/day in 2018 [8] and 340 thousand barrels/day in 2018-2019 [23].
As predicted, new projects coming on stream in the North Carnarvon Basin and the Browse Basin have boosted crude oil and condensate production. The next major Barossa project is expected to come on stream in 2025 [25].
Oil consumption, unlike production, has gradually grown and by 2021 reached 1020 thousand barrels/day [25]; slightly lower figures were given in BP report – 947 thousand barrels/day in 2021 [9].
Oil imports to Australia in 2018 amounted to around 356,900 barrels / day [3]. The main suppliers of oil are Malaysia, Brunei, the USA and Gabon; the country predominately exports oil products to Singapore, South Korea, Indonesia, and Thailand [24].
The production of natural gas between 2001 and 2019 showed a stable growth (Fig. 2) and in 2020 reached 5018 Bcf [25]. In 2021, according to [9], production totalled to 147.2 billion m3.
Gas consumption in 2020 was 1 480 Bcf [25]. In 2021, gas consumption was 39.4 billion m3 [9]. Australia is the second largest LNG exporter in the world, after Qatar, and the largest exporter in the Asia-Pacific region. In 2019, LNG exports totaled 4,094 PJ (75 Mt), against 3,376 PJ (62 Mt) in 2017 [6]. The main importers of Australian LNG are Japan, China and South Korea [6].
As noted above, Australia has significant reserves of coalbed methane (29.8 Tcf, or 30% of total gas reserves, in 2019), the commercial production of which began in 1996 and reached 424 Bcf at the beginning of 2015 [24]. The main reserves of coalbed methane are to be found in the state of Queensland. According to the Queensland Government Data [10] in 2018, the production of coal bed methane reached 1364 Bcf, compared with 430 Bcf in 2015. This growth led to the opening of the country's first export CBM-to-LNG terminals [26].
Historically, Australia has a high share of fossil fuels in electricity production (Fig. 3).
Source: U.S. Energy Information Administration (Sep 2023) / www.eia.gov | ||
| Figure 3. Electricity production in Australia |
In 2020 Australia produced around 243 TWh of electricity, of which 75.4%, was from fossil fuels, 6.2% from hydroelectricity, and 18.4%, by other renewable resources (Fig. 7).
Australia’s position in the comparative diagram of energy index is shown in Fig. 4.
The indices, which are based on reserves of fossil fuels and export opportunities, show Australia’s competitive position in the world market.
In terms of the production-consumption ratio of coal and natural gas, the country also demonstrates very high indices. However, the deficit of oil, production of which is noticeably lower when compared to consumption (index 4), is noticeable in Australia. In a rating from 2017 listing countries by their production of electricity from renewable sources (excluding hydropower), Australia placed 48th out of 170 countries selected for consideration.
| Sources: 1. Crude oil proved reserves, 2021 / International Energy Statistic/Geography / U.S. Energy Information Administration (Nov 2021)*98 2. Natural gas proved reserves 2021 / International Energy Statistic / Geography / U.S. Energy Information Administration (Nov 2021) *99 3. Total recoverable coal reserves 2019 / International Energy Statistic / Geography / U.S. Energy Information Administration (Nov 2021) *81 4. Combination production-consumption for Crude oil 2018 / International Energy Statistic / Geography / U.S. Energy Information Administration (Nov 2021) *219 5. Combination production-consumption for Natural gas 2019 / International Energy Statistic / Geography / U.S. Energy Information Administration (Nov 2021) *123 6. Combination production-consumption for Coal 2019 / International Energy Statistic / Geography / U.S. Energy Information Administration (Nov 2021) *128 7. Electricity – from other renewable sources (% of total installed capacity), 2017 est. / The World Factbook / Library / Central Intelligence Agency *170 8. GDP per unit of energy use (PPP per unit of oil equivalent), 2020 *66 Primary energy consumption - BP Statistical Review of World Energy 2021/BP;GDP (purchasing power parity) - The World Factbook/Library/Central Intelligence Agency 9. Energy use (primary energy use of oil equivalent per capita) 2020 *127 Primary energy consumption – BP Statistical Review of World Energy 2021; Population - United Nations, Department of Economic and Social Affairs, Population Division (2019). World Population Prospects 2019, custom data acquired via website. Retrieved 15 November 2021*66 10. The Global Energy Architecture Performance Index Report (EAPI) 2017 / Rankings / Reports / World Economic Forum 11. Electric power consumption (kWh per capita), 2016 *217 Electricity Consumption - The World Factbook / Library / Central Intelligence Agency; Population - United Nations, Department of Economic and Social Affairs, Population Division (2019). World Population Prospects 2019, custom data acquired via website. Retrieved 15 November 2021 12. Combination of electricity production-consumption (kWh)/The World Factbook/Library/Central Intelligence Agency *216 * Total number of countries participating in ranking Figure 4. Energy indices of Australia |
In the Energy Architecture Performance Index 2017, which is based primarily on the level of economic growth, environmental safety, and energy independence of the country, including access to energy, Australia is 53rd, behind Canada and USA. It should be noted that during the last 8 years the country gained 7 ranking positions.
Australia is in the bottom half of the ranked list of countries for such indicators as GDP per unit of energy use in 2020 – 41st out of 66 countries considered, while energy consumption per capita is much lower – 13th out of 66 countries. In terms of electricity consumption per capita, the country is 20th in the world, however, for the indicator of combination of electricity production-consumption, Australia is 29th in the ranked list of 216 countries. Thus, according to the information provided, Australia not only possesses significant reserves of traditional mineral resources, but also significant reserves of unconventional fossil resources and a powerful potential for renewable energy development.
Energy Infrastructure
A territorial map showing the distribution of the largest infrastructure projects of the fossil fuel sector in Australia is shown in Figure 5. As previously mentioned, coal reserves account for 97% of the energy potential of fossil resources. The main coal reserves are concentrated in Queensland, New South Wales, Bowen, Surat and Sydney (Fig. 5). The largest brown coal deposit in Australia is Morwell in Victoria, with an estimated production of 20 million tons per year [27]. The main coal export terminal is located in Newcastle, which according to 2009 data had a capacity of 92.8 million tons [28].
Australia's oil fields are both offshore and on land [24]. The leading oil fields are Gamarvon and Perth, the production of which in January 2016 amounted to 9,602,000 barrels [29]. Australia's refineries have a total installed capacity of 440.1 thousand barrels/day [29]. The largest refinery in Australia is Kwinana, owned by BP, with an installed capacity of 138 thousand barrels per day [30]. The main oil terminal and oil storage facility is located in Brisbane, and has a reservoir of 519 million litres [31].
Three types of oil pipelines connect the oil fields with the major refineries: pipelines for crude oil with a total length of 3609 km; oil pipelines for the transportation of petroleum products with a length of 72 km; and oil pipelines for liquefied petroleum gas 240 km long (Fig. 5).
Figure 5. Basic infrastructural facilities of the fossil fuel sector in Australia
The largest gas fields are concentrated in the basins of Carnarvon, Bonaparte and Gippsland [14]. The main gas storage facility is Mondarra, in Western Australia, with a capacity of 15 PJ [32]. Gas transportation is carried out through a pipeline 30,054 km in length, and a pipeline for condensate with a length of 637 km (Fig. 5). Terminals for receiving and distributing LNG are located along the country’s western coast, in the Brisbane area, and also in the north of the country in the Darwin area. The largest Gorgon LNG Terminal has a capacity of 15 million tons per year [33]. The main importers of Australian LNG are Japan, China and South Korea [23].
The largest deposit of uranium is the Olympic Dam, from which 4363 tons was extracted between 2015-2016 [34].
The map of the territorial distribution of the largest unconventional fossil fuel infrastructure facilities in Australia is shown in Fig. 6. sector in Australia")
Figure 6. Energy infrastructure in Australia: unconventional fossil fuels
The main unconventional fossil fuels resource in Australia is shale gas. The leading deposit is Moomba [35]. The largest coalbed methane field is Berwyndale South, QGS Coal Seam Gas Mine, with production levels of 64 619 Mmcf in 2014 [36]. In recent years, the state of Queensland has undergone a sharp increase in the production of coal methane, approaching 100 Bcf per year [37]. Gas hydrates reserves were found in the north of the country. (Fig. 6).
The infrastructure for processing unconventional fossil resources is represented by the Storet Oil Shale Project (40 barrels/day) [38], managed by Queensland Energy Resources Ltd; and coal gasification projects, the largest of which is Chinchilla, owned by Linc Energy UCG Project (67 MW) [39].
The share of fossil fuels in electricity generation in Australia in 2020 was about 75.4%, with around 6.2% coming from hydropower, and 18.4% from renewable energy sources (Figure 7).
Figure 7. Electricity production in Australia
In Australia there are 11 large coal-fired power plants with a capacity of more than 1000 MW; 8 gas power plants with a capacity of more than 500 MW; one oil station with a capacity of more than 100 MW (Fig. 7); and a large number of less powerful stations. The biggest coal-fired power plant is the Loy Yang A & B complex, with a total capacity of 3100 MW [40]. The largest gas station is Torrens Island with an installed capacity of 1280 MW. The largest oil power plant is Mount Stuart with a capacity of 288 MW [41,42].
In 2020 hydropower generated about 15 TWh (Fig.7). The largest hydroelectric power stations are Murray I, II with a total installed capacity of 1500 megawatts [43], and the Tumut Hydroelectric Power Station 3 pumped storage station with an installed capacity of 1500 MW [44].
In Figures 8 and 9 you can see the main Australian infrastructure facilities for the production of energy from renewable sources. in Australia")
Figure 8. Renewable energy in Australia: wind, solar, geothermal and marine
Renewable energy in Australia, excluding hydropower, has an increasing impact on electricity production each year. The total electricity production from renewable sources doubled over three years and was 44.78 TWh in 2020 (18.4% of total electricity generation) (Fig.8).
Along the coastline, in high wind activity zones, there are several large wind parks with a capacity of more than 150 MW each. In total, according to 2018 data, there were 94 wind farms with a total installed capacity of 5 679 MW in Australia, [45]. The largest is the Macarthur park, with an installed capacity of 420 MW [46].
As previously mentioned, the level of scattered solar radiation in the most densely populated areas of the country can reach 7.8 kWh/m2/day, which is a good resource for the production of energy through photovoltaics [17]. Nevertheless, the level of development of solar energy in Australia is not comparable with the resource potential. The largest photovoltaic station is Nyngan PV Solar Plant with an installed capacity of 102 MW; the largest CSP tower type station is Sundrop with a capacity of 1.5 MW; the largest CSP linear fresnel type is Kogan Creek Solar, with a capacity of 44 MW; and the largest CSP tower type is Lake Cargelligo Demo (3 MW) [47,48,49,50]. There is also Liddell CSP linear frensel type plant with an installed capacity of 3 MW, and Mildura Solar CPV power plant with an installed capacity of 1.5 [51, 52].
Wave power in the coastal zones can reach 60 kW/m (Fig. 8). As a consequence, Australia has a number of stations using wave power such as the Perth Wave Energy Project Power Plant and the Oceanlinx Port MacDonnell Wave Power Plant, with an installed capacity of 5MW and 1 MW, respectively [53, 54].
Figure 9. Renewable energy in Australia: bioenergy
Bioenergy does not have a significant share in energy production in Australia and, according to 2019 data, biomass generated about 3.5 TWh or 6.8% of total production from renewable sources (Fig. 8). The country has biomass processing plants, biogas production plants, biodiesel plants, bioethanol plants, pellets and landfill gas plants, etc. Wilmar Sugar owns the largest biomass processing plant Pioneer 2 Sugar Mill, with an installed capacity of more than 68 MW [55].
The Woodlawn Bioreactor plant for production of landfill gas generates about 22.5 MWh of electricity [56].
QLD produces about 76 million litres of bioethanol annually at the largest plant in the country – Dalby Biorefinery [57].
In Australia there are a large number of biodiesel plants, the largest of them – Barnawartha, produces around 60 million litres annually[58].
Australia’s modern energy policy provides for a number of projects to increase existing capacities and create new ones, both in the field of conventional energy resources and in the field of renewable energy. Thus, the installed capacity of Longford Gas Conditioning Plant will be increased to 400 Mcf/day. Many LNG energy projects are scheduled for completion in the coming years, including Crux LNG (3 Mt), and Ichthys LNG (8.4 Mt) [59]. As of December 2021, there were 37 coal projects, at the feasibility stage. By 2028 it is planned to finish the construction of Arrow Bowen Pipeline (from Moranbah to Gladstone) [59].
In January 2021 the Renewable Energy Target of 33,000 gigawatt hours of additional renewable energy was met, according to the Renewable Energy (Electricity) Amendment Bill 2015 [60]. Some of Australia's largest wind and solar projects were commissioned in 2021, including the three largest solar farms and two of the country's three largest wind farms. It was a particularly strong year for the wind industry, where 1,746 MW of new capacity was commissioned, marking the third consecutive record year [61]. In September 2016 Australia began construction on the country's largest bio-ethanol plant Pentland Bio-Energy Project with a capacity of 194 million litres/y, which is was planned to be operational in 2019, but remained on ice [62].
Education and Innovation
The set of indices reflecting the position of Australia among other countries in the field of education and innovation can be seen in Figure below. As follows from the presented diagrams, Australia is one of the world leaders in this segment of indicators, which strongly correlates with technological development in the field of energy.
In the Global Innovation Index 2021 Australia placed 25th out of 132 countries considered, ahead of New Zealand (see diagram).
According to the number of patents granted to Australian nationals, both domestically and abroad, the country ranks 19th in the world. Similarly, by the number of patents in force, the country was 18th in the world, indicating the country's favourable conditions for innovation..
The country is among the leaders in the number of Internet users. Australia also has very high indices of scientific publications in technological journals; it ranks high in the Scimago Journal and Country Ranking, placing 10th out of 240 countries, and in the Scientific and Technical journal articles – 14th out of 197 countries.
| Sources: 1. The Global Innovation Index 2021, Rankings / Knowledge / World Intellectual Property Organization / Cornell University, INSEAD, and WIPO (2021): Energizing the World with Innovation. Ithaca, Fontainebleau, and Geneva *132 2. Patent Grants 2011-2020, resident & abroad / Statistical country profiles / World Intellectual Property Organization *185 3.Patents in Force 2020 / Statistical country profiles / World Intellectual Property Organization *109 4. QS World University Rankings 2022 *97 5. SCImago Country Rankings (1996-2020) / Country rankings / SCImago, (n.d.). SIR-SCImago Journal & Country Rank [Portal]. Retrieved 17 Nov 2021 *240 6. Internet users in 2018 / The World Factbook / Central Intelligence Agency *229 7. Internet users in 2018 (% Population) / The World Factbook / Central Intelligence Agency *229 8. Government expenditure on education, total (% of GDP), 2019 / United Nations Educational, Scientific, and Cultural Organization (UNESCO) Institute for Statistics. License: CCBY-4.0 / Data as of September 2021*177 9. Research and development expenditure (% of GDP), 2018 / UNESCO Institute for Statistics. License: CCBY-4.0 / Data *119 10. Scientific and technical journal articles, 2018 / National Science Foundation, Science and Engineering Indicators. License: CCBY-4.0 / Data *197 * Total number of countries participating in ranking Figure 10. The indices of education and innovation in Australia |
At the same time the level of government expenditure on education is relatively low — 53rd out of 177 countries. Nevertheless, 38 Australian universities are included in QS University Rating. In addition, Australia's GDP is relatively high, so the expenditure on education in absolute terms is still considerable.
Around 25 Australian universities, including the University of Western Australia, University of New South Wales, Curtin University, and the University of Queensland train specialists in various fields of energy, such as Chemical Engineering, Environmental Engineering, Mining Engineering, Petroleum Engineering, Renewable Energy Engineering, Photovoltaics and Solar Energy Engineering, etc.
Linc Energy Ltd, GTL Energy Limited and Commonwealth Scientific and Industrial Research Organization are among the leaders in patenting among Australian companies in the field of synthetic fuel production. Leading scientific organizations in this field are Commonwealth Scientific and Industrial Research Organization, University of Adelaide and University of Queensland.
In the field of associated petroleum gas the following companies should be mentioned – Woodside Energy Ltd, Australia Rig Constriction Pty Ltd. Another area where Australian actively patent their technology is in coal seam methane. The main patent holders are LNG Technology Pty Ltd, Commonwealth Scientific and Industrial Research Organization (CSIRO); studies in this field have been conducted by CSIRO and the University of Queensland. In the field of extraction and processing of unconventional oil, patenting leaders among Australian companies are Forbes Oil and Gas Pty Ltd and GTL Energy Limited; and CSIRO and Cutrin University are engaged in the research in this field. In the field of the extraction of hydrocarbons from low-permeability reservoirs, Yuelba Minerals Pty Ltd, Commonwealth Scientific and Industrial Research Organization have the largest number of patents.
In the field of bioenergy the main patent holders are Commonwealth Scientific and Industrial Research Organization and Pioneer Waste Man Holdings Trust Pry Ltd. Studies in this field have been conducted by Curtin University, University of Queensland.
A large number of Australian companies patent technical solutions in the field of energy production from renewable sources. In the field of solar energy the following companies should be mentioned: Solar Systems, Pty Ltd., Solar Heat and Power Pty Ltd. Australian National University and the University of New South Wales have the highest number of publications in this area.
In the field of wind power Adelaide Research and Innovation Pty Ltd is the patent leader.
Ecology and Environment Protection
A diagram of environmental indices is shown in Figure 11.
Australia demonstrates a relatively high level of CO2 emissions, both in general and per capita.
Furthermore, the country is 55th in the Climate Change Performance Index (CCPI)-2022, which lists the 61 countries responsible for more than 90% of the world's energy-related CO2 emissions. According to the report, the environmental situation in the country has deteriorated, despite the fact that the authors of the rating note positive changes in the energy policy of the state; at the regional level there are no positive changes.
| Sources: 1. CO2 total emission by countries 2020 / European Commission / Joint Research Centre (JRC) / Emission Database for Global Atmospheric Research (EDGAR)*208 2. CO2 per capita emission 2020/European Commission/Joint Research Centre (JRC) / Emission Database for Global Atmospheric Research (EDGAR) *208 3. Forest area 2020 (% of land area) / The Global Forest Resources Assessment 2020 / Food and Agriculture Organization of the United Nations *234 4. Forest area change 2010-2020 (1000 ha/year) / The Global Forest Resources Assessment 2020 / Food and Agriculture Organization of the United Nations *234 5. The Environmental Performance Index (EPI) 2020 / Rankings / Yale Center for Environmental Law & Policy / Yale University *180 6. Annual freshwater withdrawals (m3 per capita), 2017 *179 Annual freshwater withdrawals, total (billion m3), 2017 – Food and Agriculture Organization, AQUASTAT data. /License: CC BY-4.0; Population – United Nations, Department of Economic and Social Affairs, Population Division (2019). World Population Prospects 2019, custom data acquired via website. Retrieved 15 November 2021 7. The National Footprint Accounts 2017 (Biocapacity Credit / Deficit) / Global Footprint Network *188 8. Methane emissions (kt of CO2 equivalent), 2018 / Data for up to 1990 are sourced from Carbon Dioxide Information Analysis Center, Environmental Sciences Division, Oak Ridge National Laboratory, Tennessee, United States. Data from 1990 are CAIT data: Climate Watch. 2020. GHG Emissions. Washington, DC: World Resources Institute. Available at: License : Attribution-NonCommercial 4.0 International (CC BY-NC 4.0) *191 9. The Climate Change Performance Index (CCPI) 2022 / Overall Results / Jan Burck, Thea Uhlich, Christoph Bals, Niklas Höhne, Leonardo Nascimento / Germanwatch, NewClimate Institute & Climate Action Network *60 * Total number of countries participating in ranking Figure 11. Environmental Indices of Australia |
In relation to the forest area as a percentage of land area, Australia is 149th in the world, however, there is a very negative trend in forest area change; in this rating the country is second only to China.
Australia has a relatively high rating in the Environmental Performance Index (EPI) 2020, which focuses primarily on assessing the environmental performance of national governments, placing 13th out of 180 member countries.
However, according to The Environmental Vulnerability Index, which is based on years of observations and 50 indicators and includes, for example, changing climatic characteristics or the quality of water resources, waste volumes, oil spills and other hazardous substances, etc. Australia is 28th out of 234 countries and is characterized as “at risk”.
At the end of the review, it is also worth noting that, according to Ecological Footprint Atlas, Australia is among environmental creditors.
References
[1] List of sovereign states and dependencies by area / Wikipedia / https://en.wikipedia.org/wiki/List_of_sovereign_states_and_dependencies_by_area
[2] List of countries and dependencies by population density / Wikipedia / https://en.wikipedia.org/wiki/List_of_countries_and_dependencies_by_population_density
[3] Australia / The world factbook / Library / Central Intelligence Agency / https://www.cia.gov/
[4] GDP, PPP (constant 2011 international $) / World Bank, International Comparison Program database. License: CC BY-4.0 / Data / The World Bank / http://www.worldbank.org/
[5] GDP per capita, PPP (current international $)/ World Bank, International Comparison Program database. License: CC BY-4.0 / Data / The World Bank / http://www.worldbank.org/
[6] Australia's Energy Commodity Resources 2021 / Australian Government Geoscience Australia / https://industry.gov.au/
[7] Energy in Australia 2015 (PDF) / Australian Government Department of Industry Innovation and Science/ https://industry.gov.au/
[8] Coal / Australian Government - Geoscience Australia / http://www.ga.gov.au/
[9] BP Statistical Review of World Energy 2022 (PDF) / BP / https://www.bp.com/
[10] 2006 IPCC Guidelines for National Greenhouse Gas Inventories, Volume 2, Energy, Fugitive Emissions (PDF) / The Intergovernmental Panel on Climate Change (IPCC) / www.ipcc-nggip.iges.or.jp
[11] Oil / Australian Government - Geoscience Australia / http://www.ga.gov.au/
[12] World Shale Resource Assessments / U.S. Energy Information Administration (September 24, 2015) / https://www.eia.gov/
[13] 2010 Survey of Energy Resources (PDF) / World Energy Council / www.worldenergy.org/
[14] Gas/ Australian Government - Geoscience Australia / http://www.ga.gov.au/
[15] 2013 Survey of Energy Resources (PDF) / World Energy Council / www.worldenergy.org/
[16] Wave power / Wikipedia / https://en.wikipedia.org/wiki/Wave_power
[17] Solar resource data obtained from the Global Solar Atlas, owned by the World Bank Group and provided by Solargis / Global Solar Athlas / http://globalsolaratlas.info/
[18] Wind Map / Global Wind Atlas 2.0, a free, web-based application developed, owned and operated by the Technical University of Denmark (DTU) in partnership with the World Bank Group, utilizing data provided by Vortex, with funding provided by the Energy Sector Management Assistance Program (ESMAP). For additional information: https://globalwindatlas.info
[19] Agricultural land (% of land area) / Food and Agriculture Organization, electronic files and web site. License: CC BY-4.0 / Data / The World Bank / http://www.worldbank.org
[20] Forest area (% of land area) /Food and Agriculture Organization, electronic files and web site. License: CC BY-4.0 / Data / The World Bank / http://www.worldbank.org/
[21] The potential of geothermal energy (PDF) / Garnaut Climate Change Review / http://www.garnautreview.org.au/
[22] World Bank What a Waste / Data / The World Bank / http://www.worldbank.org
[23] Australian Energy Statistics 2018 (PDF) / Australian Government Department of Industry Innovation and Science / https://www.energy.gov.au/
[24] Australia/ Geography / U.S. Energy Information Administration (March 18, 2022) /http://www.eia.gov/
[25] International Energy Statistic / Geography / U.S. Energy Information Administration (Jan 2020) /http://www.eia.gov/beta/international/
[26] Queensland to start operating CBM-to-LNG facilities / Petroleum Economist / https://www.petroleum-economist.com/
[27] Major mines / Coal in Australia / Wikipedia / http://en.wikipedia.org/
[28] Major coal export ports / Coal in Australia / Wikipedia / http://en.wikipedia.org/
[29] Australian Petroleum Statistics January 2016 (PDF) / Australian Government Department of Industry Innovation and Science / https://industry.gov.au/
[30] Kwinana Oil Refinery / Wikipedia / https://en.wikipedia.org/wiki/Kwinana_Oil_Refinery
[31] Petroleum Import Infrastructure in Australia Executive Summary (PDF) / AIP / http://www.aip.com.au/
[32] Mondarra / APA Group / https://www.apa.com.au/
[33] Gorgon LNG Terminal / A Barrel Full Oil & Gas Wiki / http://abarrelfull.wikidot.com
[34] Australia / World Nuclear / http://www.world-nuclear.org/
[35] Santos shale gas well head at the Moomba field, SA / 4 October 2013 / Australian Broadcasting Corporation (ABC) / http://www.abc.net.au/
[36] Gladstone New Fuels Development Project Stage 1 / Queensland Energy Resources / http://www.qer.com.au/
[37] APPEA Annual Production Statistics 2014 for web / The Australian Petroleum Production & Exploration Association (APPEA) / http://www.appea.com.au/
[38] Projects / Queensland Energy Resources / http://www.qer.com.au/
[39] An IGCC Project at Chinchilla, Australia. Based on Undeground Coal Gasification (UCG), 2001 Report (PDF) / Gasification Technologies Council / http://www.gasification.org/
[40] Kraftwerk Loy Yang / Wikipedia / https://de.wikipedia.org/wiki/Kraftwerk_Loy_Yang
[41] Torrens Island Power Station / Wikipedia / en.wikipedia.org/wiki/Torrens_Island_Power_Station
[42] Mt Stuart Power Station / Power technology / https://www.power-technology.com/
[43] Murray Hydroelectric Power Station / Wikipedia / https://en.wikipedia.org/wiki/Murray_Hydroelectric_Power_Station
[44] Tumut Hydroelectric Power Station 3 (1500 MW) / DOE Global Energy Storage Database / http://www.energystorageexchange.org/
[45] Wind power in Australia / Wikipedia / https://en.wikipedia.org/wiki/Wind_power_in_Australia
[46] Macarthur Wind Farm / Renewable Energy / AGL / https://www.agl.com.au/
[47] Nyngan Solar Plant / Renewable Energy / AGL / https://www.agl.com.au/
[48] Sundrop Farm Solar Thermal Plant / Solar Thermal / Aussie Renewables / http://www.aussierenewables.com.au/
[49] Australia plans massive coal-solar combo / April 13, 2011 / United Press International (UPI) / http://www.upi.com/
[50] Lake Cargelligo / Concentrating Solar Power Projects / NREL / https://solarpaces.nrel.gov/
[51] Liddell Power Station/ Concentrating Solar Power Projects / NREL / https://solarpaces.nrel.gov/
[52] Mildura Solar Concentrator Power Station / Wikipedia / https://en.wikipedia.org/wiki/Mildura_Solar_Concentrator_Power_Station
[53] World first commercial wave power station switched on in Australia / RT / https://www.rt.com/
[54] Oceanlinx launches world’s first 1MW wave energy machine in S.A. / Renew Economy / http://reneweconomy.com.au/
[55] About us / Cogeneration / Wilmar Sugar / https://www.wilmarsugarmills.com.au/
[56] Woodlawn Bioreactor / 19 December 2014 / Australian Broadcasting Corporation (ABC) / http://www.abc.net.au/
[57] Australia’s first grain-to-ethanol plant / Case Studies / Bioenergy industry in Australia | Biomass Producer / http://biomassproducer.com.au/
[58] AR Fuels’ biodiesel plant at Largs North in SA recommissioned after fire on Christmas eve last year / December 10, 2012 / Adelaide Now / http://www.adelaidenow.com.au/
[59] Resources and Energy Major Projects / Department of Industry Innovation and Science / https://industry.gov.au/
[60] About the Renewable Energy Target / Clean Energy Regulator / http://www.cleanenergyregulator.gov.au/
[61] Clean Energy Australia Report / Clean Energy Council / https://www.cleanenergycouncil.org.au/
[62] Construction set for Pentland Bio-Energy Project / North Queensland Register / http://www.northqueenslandregister.com.au/
The sources of charts and curves are specified under the images.
For more information about the energy industry in Australia see here