

Contents
General State of the Economy
Uzbekistan, officially the Republic of Uzbekistan, is a landlocked country in Central Asia. It shares borders with Afghanistan and Turkmenistan to the south, Kyrgyzstan and Tajikistan to the east, and Kazakhstan to the north and west.
| Uzbekistan / Republic of Uzbekistan | ||
|---|---|---|
| Capital: Tashkent | Density: 80.2/km2 | Currency: Uzbek soum and dollar (UZS) |
| Official languages: Uzbek | Life expectancy at birth: 75.55 years | GDP (PPP): $450.646 billion (2024 est.) |
| National Day: 01 September | Area (land): 448,978 km2 | GDP - per capita (PPP): $12,247 (2024 est.) |
| Population: 36,799,000 (2024 est.) | Coastline: 0 km | Internet country code: .uz |
Source: [1,2,3,4,5]

According to 2024 statistics, Uzbekistan, which in terms of size is 40th in the world, is home to around 37 million people. In terms of population density the country is 111th in the world out of 199 countries considered. The administrative map of the country is divided into 12 provinces with Tashkent as its capital and most-populous city. The political form of government is a presidential republic, and the official language is Uzbek. In the semi-autonomous Republic of Karakalpakstan, the official status is also given to the Karakalpak language [1,2,3].
The ranking positions of Uzbekistan relative to other countries have been determined for an extensive list of economic, energy, innovative and educational indices, as well as for metrics reflecting the state of the environment. The economic indices include, for example, GDP per capita, annual average GDP growth, high-technology exports, and others. The list of energy indices includes proven reserves of oil, gas and coal, production-consumption ratio combined, and energy use, etc. Each of the indices has a ranked list of included member countries. Since the number of countries in each rating is different for each index, the positioning of the country of interest is displayed on a special chart, where the vertical axis is a uniform relative scale from 0 to 1, whereas the horizontal axis denominates the various indices and respective numbers relating to the descriptions given underneath.
Thus, in such a relative “0-1” diagram, the country’s position is marked with a dot in proportion to its location in the original rating list. If the country is among the leaders regarding the selected indicator, it will be marked close to 1 in the upper green zone on the relevant chart “0-1”, if the country is an outsider in the rating list, then it will be marked in the lower red zone of the chart “0-1”, etc. A single list of indices is used for all countries. If a country is not in the ranking list for any index, then the corresponding position on the charts is not displayed.
Ranking position of Uzbekistan for list of economic indices:
| Sources: 1. GDP (purchasing power parity), 2020 est. / The World Factbook/Library/Central Intelligence Agency *228 2. GDP - per capita (PPP), 2020 / The World Factbook/Library/Central Intelligence Agency *229 3. Inflation rate (consumer prices), 2019 est. / The World Factbook/Library/Central Intelligence Agency *228 4. Charges for the use of intellectual property, receipts (BoP, current US$), 2020 / International Monetary Fund, Balance of Payments Statistics Yearbook, and data files. / License: CC BY-4.0 *88 5. The Global Competitiveness Index 2019 / Rankings / Reports / World Economic Forum *141 6. High-technology exports (current US$) 2019-2020 / United Nations, Comtrade database through the WITS platform / License: CCBY-4.0 / Data *134 7. 2021 Index of Economic Freedom / International Economies / The Heritage Foundation *178 8. Reserves of foreign exchange and gold, 2017 est. / The World Factbook / Library / Central Intelligence Agency *195 9. Annual average GDP growth in %, for the last 10 years (2011-2020) / World Bank national accounts data, and OECD National Accounts data files / License: CC BY-4.0 *206 10. Public debt (% of GDP), 2017 est. / The World Factbook / Library / Central Intelligence Agency (from smallest to largest) *210 * Total number of countries participating in ranking Figure 1. Economic Indices of Uzbekistan |
The highest indicators for Uzbekistan depicted in the chart above are the Annual average GDP growth (0.92) and Public debt as % of GDP (0.84). In addition, Reserves of foreign exchange and gold (0.67) and GDP (0.72) are above the world average. All other presented indicators are below the world average, with the weakest being the Inflation rate (0.07) and the Charges for the use of intellectual property (0.09). Uzbekistan is not included in the Global Competitiveness Index leaving this position in the chart blank.
Energy Resources
Uzbekistan has distinct proven reserves of fossil fuels in the form of natural gas and coal. The share of natural gas is 0.89% of the world’s total, the share of coal is 0.13%. The country's crude oil reserves are only 0.035% of the world total. The share of Uzbekistan population makes up about 0.44% of the world's population. At the same time, fossil fuels reserves in Uzbekistan are significantly lower than those of the world leaders. For instance, gas reserves are about 12 times less than in Qatar, while coal reserves are more than 18 times less than in Kazakhstan.
In terms of tons of oil equivalent, according to 2024 data, conventional proved reserves by fuel type were: 61.4% – natural gas, 35.6% – coal, and 3.0% – crude oil (Fig.5).
Table 1. Fossil energy resources of Uzbekistan
| Resource /Explanations | Crude oil* | Natural gas* | Coal* | Tight Oil | Shale Gas |
|---|---|---|---|---|---|
| Value | 0.59 (0.035%) | 65 (0.89%) | 1516 (0.13%) | - | - |
| Unit | billion barrels | Tcf | million short tons | - | - |
| Year | 2021 | 2020 | 2021 | - | - |
| Source | [6] | [6] | [6] | [-] | [-] |
* share of the country’s reserves in world total is provided in brackets
Although Uzbekistan has a huge potential to generate clean energy from its abundant solar and wind resources, the country's renewable energy market is rather at the initial stage of its full-scale development. The Government of Uzbekistan plans to significantly expand the use of all renewable energy sources in the shortest possible time, with an emphasis on solar energy. This is due to more than 300 sunny days per year and high DNI solar intensity, reaching DNI solar intensity of 4.9-5.1 kWh/m2 per day in the southwestern part of the country, between Kashkadarya and Sursondarya districts. In many areas of Uzbekistan, especially in the central and western regions, there are very favorable conditions for the development of wind energy, where wind speeds reach about 7.5 m/s at a height of 50 meters.
In addition to fossil fuels, another important source of energy in Uzbekistan is hydropower, but its potential is not fully utilized. The country has a significant resource both for the construction of small hydropower plants, for example in Andijan, Samarkand and Surkhandarya regions, and large hydropower plants mainly in Tashkent region.
Table 2. Renewable energy resources of Uzbekistan
| Resource/ explanations | Solar Potential (DNI)* | Wind Potential (50 м)* | Bio Potential (agricultural area) | Bio Potential (forest area) | Municipal Solid Waste |
|---|---|---|---|---|---|
| Value | 4.6 -4.9 | 6.0-7.5 | 58.3 | 8.4 | 0.40 |
| Unit | kWh/m2/day | m/s | % of land area | % of land area | kg/per capita/day |
| Year | 2020 | 2020 | 2020 | 2020 | 2018 |
| Source | [7] | [8] | [9] | [10] | [11] |
*for the majority of the territory of the country
Agriculture, primarily large-scale wheat cultivation and livestock rearing, is of critical importance to Uzbekistan. Organic agricultural waste is an excellent basis for the development of bioenergy, in particular the production of solid biofuels and biogas.
UZBEKISTAN, NAVOI
Latitude: 40.13 Longitude: 65.35
Average daily sky coverage over 10 years of observations, %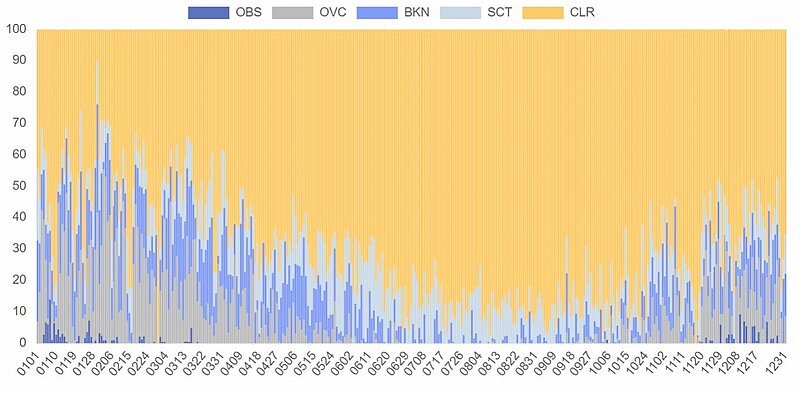
CLR - clear, SCT - scattered from 1/8 TO 4/8, BKN - broken from 5/8 TO 7/8, OVC - overcast, OBS - obscured, POB - partial obscuration
Source: based on NOAA U.S. Department of Commerce
Detailed information: Interactive map of solar resources
UZBEKISTAN, NAVOI
Latitude: 40.13 Longitude: 65.35
Average daily wind speed for 10 years of observations, m/s, 10 m above the ground
Source: based on NOAA U.S. Department of Commerce
Detailed information: Interactive map of wind resources
Energy Balance
According to [6], in 2022 in Uzbekistan, the total production of primary energy was 1.865 quadrillion Btu, while consumption was at the level of 1.854 quadrillion Btu. Thus, the share of domestic consumption in primary energy production was 99,4%. This makes Uzbekistan basically an energy-independent country (without taking into account the structure of energy consumption).
According to the Statistical Review of World Energy 2022, primary energy consumption in Uzbekistan in 2021 amounted to 1.97 exajoules and was dominated by natural gas – 84.8%, ahead of oil –8.6%, coal – 3.5%, and hydro – 2.5% [12].
Source: U.S. Energy Information Administration (Mar 2024) / www.eia.gov
Figure 2. The Production and Consumption of fossil fuels in Uzbekistan (left — coal, in the center — gas, right — oil)
As can be seen from the above diagram, coal production in Uzbekistan has been gradually increasing over the last ten years. At the same time, the demand for coal is greater, and its consumption in 2022 was about 20% higher than domestic production. In contrast, oil production was gradually been declining over the same period of time with the consumption more than twice as high as domestic production. Natural gas production and consumption have remained at approximately the same level with slight fluctuations and output moderately higher than demand.
Sources: U.S. Energy Information Administration (Mar 2024) / www.eia.gov | ||
| Figure 3. Electricity Generation in Uzbekistan |
Compared to other Central Asian countries, electricity generation in Uzbekistan is less diversified and 93.3% of electricity in 2022 was generated from fossil fuels. Natural gas is the dominant source, followed by hydropower and coal. The contribution of wind and solar energy is negligible to date.
Despite abundant natural resources for energy production, outdated infrastructure leads to huge distribution losses and unreliable power supply, especially in rural areas and power shortages during cold winter days. In addition, there is a trend of increasing demand for electricity from both business and households.
| Sources: 1. Crude oil proved reserves, 2021 / International Energy Statistic/Geography / U.S. Energy Information Administration (Nov 2021)*98 2. Natural gas proved reserves 2021 / International Energy Statistic / Geography / U.S. Energy Information Administration (Nov 2021) *99 3. Total recoverable coal reserves 2019 / International Energy Statistic / Geography / U.S. Energy Information Administration (Nov 2021) *81 4. Combination production-consumption for Crude oil 2018 / International Energy Statistic / Geography / U.S. Energy Information Administration (Nov 2021) *219 5. Combination production-consumption for Natural gas 2019 / International Energy Statistic / Geography / U.S. Energy Information Administration (Nov 2021) *123 6. Combination production-consumption for Coal 2019 / International Energy Statistic / Geography / U.S. Energy Information Administration (Nov 2021) *128 7. Electricity – from other renewable sources (% of total installed capacity), 2017 est. / The World Factbook / Library / Central Intelligence Agency *170 8. GDP per unit of energy use (PPP per unit of oil equivalent), 2020 *66 Primary energy consumption - BP Statistical Review of World Energy 2021/BP;GDP (purchasing power parity) - The World Factbook/Library/Central Intelligence Agency 9. Energy use (primary energy use of oil equivalent per capita) 2020 *127 Primary energy consumption – BP Statistical Review of World Energy 2021; Population - United Nations, Department of Economic and Social Affairs, Population Division (2019). World Population Prospects 2019, custom data acquired via website. Retrieved 15 November 2021*66 10. The Global Energy Architecture Performance Index Report (EAPI) 2017 / Rankings / Reports / World Economic Forum 11. Electric power consumption (kWh per capita), 2016 *217 Electricity Consumption - The World Factbook / Library / Central Intelligence Agency; Population - United Nations, Department of Economic and Social Affairs, Population Division (2019). World Population Prospects 2019, custom data acquired via website. Retrieved 15 November 2021 12. Combination of electricity production-consumption (kWh)/The World Factbook/Library/Central Intelligence Agency *216 * Total number of countries participating in ranking Figure 4. Energy indices of Uzbekistan |
Energy Infrastructure
Uzbekistan has rich hydrocarbon and mineral resources, which are one of the determining factors of the country's development. A territorial map of the distribution of the largest infrastructure projects of the fossil-fuel sector in Uzbekistan is shown in Figure 5.
Over the entire period of exploration in Uzbekistan, there have been discovered many oil and gas fields, but the core region for gas production in the country is Bukhara-Khiva region, where the main deposits of natural gas are concentrated. Uzbekistan's gas pipeline system provides access to the markets of China and Russia for domestic and international producers.
The most important discovered oil fields are located in the southwest of the in the Kashkadarya region and in Fergana Valley in the east. According to U.S. Energy Information Administration, there are 3 oil refineries in the country operating in Ferghana, Alty-Arik, and Bukhara, with a total crude oil distillation capacity of 232,000 b/d. 
Figure 5. Basic infrastructural facilities of the fossil fuel sector in Uzbekistan
Coal production in Uzbekistan is carried out at the Angren brown coal field, as well as Shargun and Baysun underground deposits. As already mentioned, Uzbekistan has significant mineral deposits, including uranium. According to the World Nuclear Association, Uzbekistan is the 5th largest uranium producer in the world and intends to significantly expand uranium mining in the future. Currently the bulk of uranium is mined in the middle part of the country, with Navoi city as the center, which is connected to the mines by railroad [13].
In addition to traditional conventional resources in the form of natural gas, crude oil and coal, Uzbekistan is rich in oil shale resources. The key oil shale deposits are concentrated in the Kyzylkum desert and mountains of Baysun. The country’s shale oil reserves are estimated at 47 billion tonnes at a depth of up to 600 m [14]. 
Figure 6. Electricity production and Renewable energy in Uzbekistan
Uzbekistan's energy system in general and electricity generation in particular is highly dependent on conventional energy sources. Looking at power generation in 2022 by technology, 93.3% of electricity was generated by fossil fuels ahead of hydropower, while wind and solar power output was insignificant.
Uzbekistan has set an ambitious goal of producing 25% of its electricity from renewable sources by 2030. To realize this goal, all available types of renewable energy, including wind and biomass, are planned to be involved, but the main focus will be on solar energy. According to the State Statistics Agency, the government is making efforts to attract investors and plans to build solar and wind power plants with a total capacity of 8 GW by 2030, as well as increase hydroelectric capacity to 1.935 GW. In addition, new technologies for processing biomass and organic agricultural waste to produce biogas are to be implemented [15].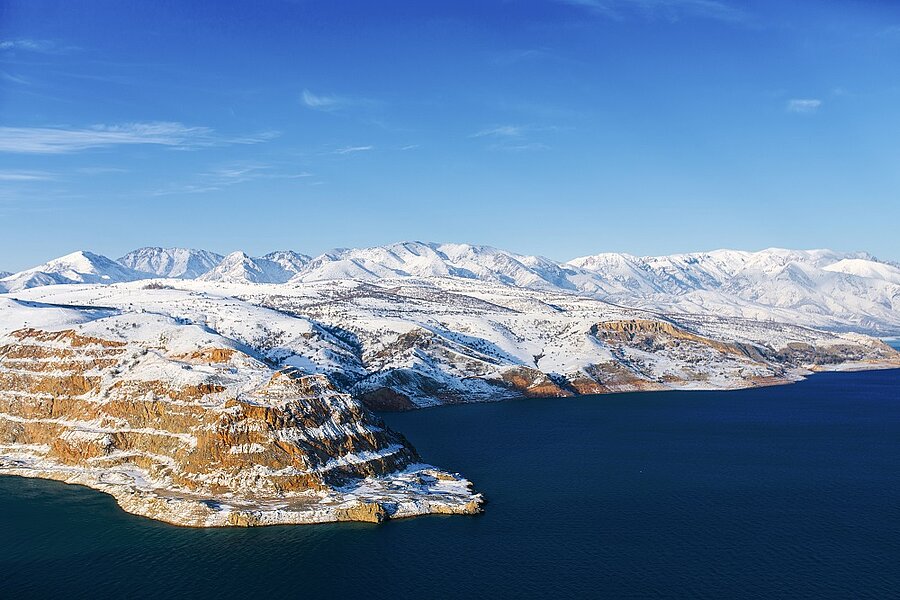
Charvak reservoir. Envato. VQCXD36HF4
Uzbekistan already has several photovoltaic projects of various capacities in operation. One of them is the 100-megawatt (MW) Nur-Navoi solar power plant, opened in 2021 and located in Navoi region. It produces enough electricity for 31,000 households [16].
Today, a fairly decent number of solar power projects are under construction or in the planning stage. Among them is the construction of three solar power plants in Surkhandarya, Samarkand and Jizzak regions of Uzbekistan with a total capacity of 897 MW, which are expected to be completed within a few years, thus increasing access to reliable and clean energy for households and businesses [17].
Wind energy should also contribute to the expansion and diversification of green infrastructure. One of the leaders of the wind energy sector UAE company Masdar will build the 1500-megawatt wind power plant in the Zarafshan district of the Navoi region. The project is expected to begin commercial operation at a capacity of 500 MW by the end of 2024 providing electricity to power 500,000 homes, while displacing 1.1 million tonnes of carbon dioxide per year [18].
As can be seen from the map above, the vast majority of hydropower projects are concentrated in the Tashkent region, which has a huge hydropower potential. According to [19], as of 2023, Uzbekistan's total hydropower capacity amounted to 2.1 thousand megawatts generating 6.5 billion kilowatt-hours of electricity annually. The government is considering new projects such as the construction of 3 hydropower plants with 23 megawatts capacity on the Great Andijan Channel and one 16 MW plant on the Tupalang River. In addition, 26 micro hydropower plants with a capacity of 9 megawatts with the involvement of the private sector are to be built.
Education and Innovation
Sources: 1. The Global Innovation Index 2021, Rankings / Knowledge / World Intellectual Property Organization / Cornell University, INSEAD, and WIPO (2021): Energizing the World with Innovation. Ithaca, Fontainebleau, and Geneva *132 2. Patent Grants 2011-2020, resident & abroad / Statistical country profiles / World Intellectual Property Organization *185 3.Patents in Force 2020 / Statistical country profiles / World Intellectual Property Organization *109 4. QS World University Rankings 2022 *97 5. SCImago Country Rankings (1996-2020) / Country rankings / SCImago, (n.d.). SIR-SCImago Journal & Country Rank [Portal]. Retrieved 17 Nov 2021 *240 6. Internet users in 2018 / The World Factbook / Central Intelligence Agency *229 7. Internet users in 2018 (% Population) / The World Factbook / Central Intelligence Agency *229 8. Government expenditure on education, total (% of GDP), 2019 / United Nations Educational, Scientific, and Cultural Organization (UNESCO) Institute for Statistics. License: CCBY-4.0 / Data as of September 2021*177 9. Research and development expenditure (% of GDP), 2018 / UNESCO Institute for Statistics. License: CCBY-4.0 / Data *119 10. Scientific and technical journal articles, 2018 / National Science Foundation, Science and Engineering Indicators. License: CCBY-4.0 / Data *197 * Total number of countries participating in ranking | ||
| Figure 7. The indices of education and innovation in Uzbekistan |
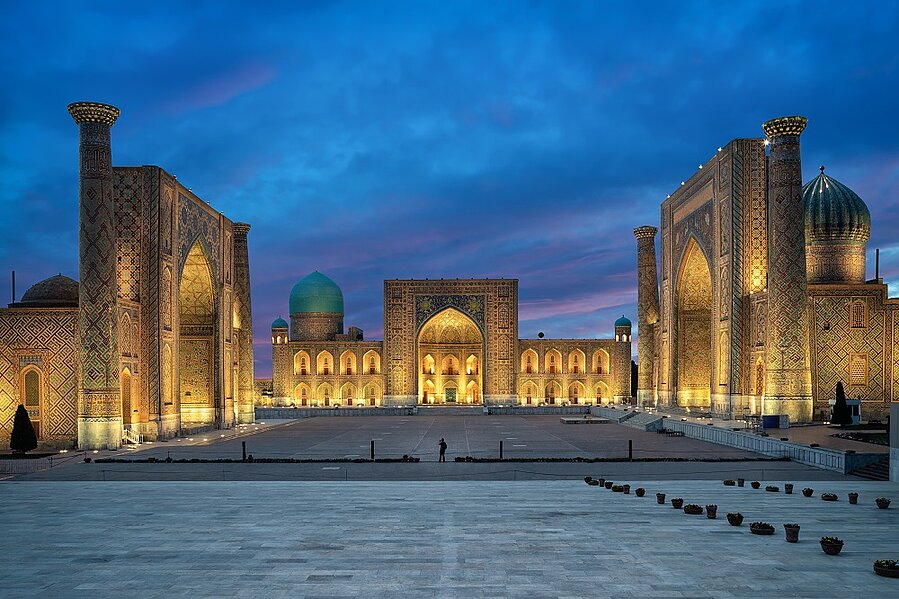
Registan square at dusk in Samarkand, Uzbekistan. Envato. 7FH9NCZG5Q
Like many countries with large populations, Uzbekistan performs well in terms of the absolute number of Internet users (0.82), but when the number of users is considered as a proportion of the entire population, the country is below the world average (0.40). The weakest point of the country on the chart is Government research and development expenditure (0.21).
Ecology and Environment Protection
| Sources: 1. CO2 total emission by countries 2020 / European Commission / Joint Research Centre (JRC) / Emission Database for Global Atmospheric Research (EDGAR)*208 2. CO2 per capita emission 2020/European Commission/Joint Research Centre (JRC) / Emission Database for Global Atmospheric Research (EDGAR) *208 3. Forest area 2020 (% of land area) / The Global Forest Resources Assessment 2020 / Food and Agriculture Organization of the United Nations *234 4. Forest area change 2010-2020 (1000 ha/year) / The Global Forest Resources Assessment 2020 / Food and Agriculture Organization of the United Nations *234 5. The Environmental Performance Index (EPI) 2020 / Rankings / Yale Center for Environmental Law & Policy / Yale University *180 6. Annual freshwater withdrawals (m3 per capita), 2017 *179 Annual freshwater withdrawals, total (billion m3), 2017 – Food and Agriculture Organization, AQUASTAT data. /License: CC BY-4.0; Population – United Nations, Department of Economic and Social Affairs, Population Division (2019). World Population Prospects 2019, custom data acquired via website. Retrieved 15 November 2021 7. The National Footprint Accounts 2017 (Biocapacity Credit / Deficit) / Global Footprint Network *188 8. Methane emissions (kt of CO2 equivalent), 2018 / Data for up to 1990 are sourced from Carbon Dioxide Information Analysis Center, Environmental Sciences Division, Oak Ridge National Laboratory, Tennessee, United States. Data from 1990 are CAIT data: Climate Watch. 2020. GHG Emissions. Washington, DC: World Resources Institute. Available at: License : Attribution-NonCommercial 4.0 International (CC BY-NC 4.0) *191 9. The Climate Change Performance Index (CCPI) 2022 / Overall Results / Jan Burck, Thea Uhlich, Christoph Bals, Niklas Höhne, Leonardo Nascimento / Germanwatch, NewClimate Institute & Climate Action Network *60 * Total number of countries participating in ranking | ||
| Figure 8. Environmental Indices of Uzbekistan |
Uzbekistan is one of the most methane emissions-intensive countries in the world (0.06). Furthermore, the energy sector accounts for a high level of GHG emissions (0.19). In terms of forest cover, Uzbekistan belongs to the forest-poor countries (0.21). However, the government regularly carries out activities to conserve and reproduce forest resources, and the indicator of forest area change is one of the highest presented in the diagram (0.94). The positive environmental characteristics of the country also include annual freshwater withdrawal (0.97), which is very high compared to other countries. Uzbekistan is not included in the Climate Change Performance Index 2022. In general, the country has a large number of environmental challenges that need to be addressed.
References
[1] List of sovereign states and dependencies by area / Wikipedia / en.wikipedia.org/wiki/List_of_sovereign_states_and_dependencies_by_area
[2] List of countries and dependencies by population density / Wikipedia / en.wikipedia.org/wiki/List_of_countries_and_dependencies_by_population_density
[3] Uzbekistan / The world factbook / Library / Central Intelligence Agency / www.cia.gov
[4] GDP, PPP (constant 2011 international $) / World Bank, International Comparison Program database. License: CC BY-4.0 / Data / The World Bank / www.worldbank.org
[5] GDP per capita, PPP (current international $) / World Bank, International Comparison Program database. License: CC BY-4.0 / Data / The World Bank / www.worldbank.org
[6] International Energy Statistic / Geography / U.S. Energy Information Administration (Dec 2022) / www.eia.gov/
[7] Solar resource data obtained from the Global Solar Atlas, owned by the World Bank Group and provided by Solargis / Global Solar Atlas / globalsolaratlas.info
[8] Wind Map / Global Wind Atlas 2.0, a free, web-based application developed, owned and operated by the Technical University of Denmark (DTU) in partnership with the World Bank Group, utilizing data provided by Vortex, with funding provided by the Energy Sector Management Assistance Program (ESMAP). For additional information: globalwindatlas.info
[9] Agricultural land (% of land area) /Food and Agriculture Organization, electronic files and web site. License: CC BY-4.0 / Data / The World Bank / www.worldbank.org
[10] Forest area (% of land area) /Food and Agriculture Organization, electronic files and web site. License: CC BY-4.0 / Data / The World Bank / www.worldbank.org
[11] What a Waste 2.0 (PDF) / Resources / The World Bank / www.worldbank.org
[12] BP Statistical Review of World Energy 2020-2022 (PDF) / BP / www.bp.com
[13] Uranium in Uzbekistan / World Nuclear Association / https://world-nuclear.org/information-library/country-profiles/countries-t-z/uzbekistan.aspx
[14] Перспективы использования горючих сланцев республики Узбекистан / PDF / https://library.ziyonet.uz/ru/book/84797
[15] Statistics Agency under the President of The Republic of Uzbekistan / https://stat.uz/en/
[16] Nur Navoi Solar Project / Our Projects /Masdar / https://masdar.ae/en/renewables/our-projects/100-mw-nur-navoi-solar-project
[17] Uzbekistan’s Renewable Power Potential With 3 New Solar Power Plants / 06 April 2023 / Asian Development Bank / https://www.adb.org/news/adb-masdar-unlock-uzbekistan-s-renewable-power-potential-3-new-solar-power-plants
[18] Masdar celebrates groundbreaking on Uzbekistan’s first wind farm and agrees to extend project capacity / Ministry of Energy of the Republic of Uzbekistan / https://minenergy.uz/en/news/view/1194
[19] Implementation of Hydropower Projects Considered / 17.03.2023 / President of the Republic of Uzbekistan / https://president.uz/en/lists/view/6015
The sources of charts and curves are specified under the images.
For more information about the energy industry in Uzbekistan see here