
Contents
General State of the Economy
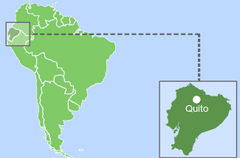
Ecuador, officially the Republic of Ecuador, is a country in the northwest of South America with three continental and one insular region, the Galapagos Islands in the Pacific, about 1,000 km west of the mainland. The country borders Colombia on the north and Peru on the east and south. The total length of the country's coastline is 2,237 km (the Pacific Ocean on the west) [3].
According to 2023 statistics, Ecuador is home to about 17,5 million people. In terms of population density the country is 149th in the world from 249 countries considered. The capital city is Quito, while the largest city is Guayaquil. The political form of government is a presidential republic and the administrative map of the country is divided into 24 provinces [1,2,3].
| Ecuador / Republic of Ecuador | ||
|---|---|---|
| Capital: Quito | Density: 69/km2 | Currency: United States dollar (USD) |
| Official languages: Spanish | Life expectancy at birth: 74.9 years | GDP (PPP): $252.590 billion (2024 est.) |
| National Day: 10 August | Area (land): 283,561 km2 | GDP - per capita (PPP): $13,642 (2024 est.) |
| Population: 17,483,326 (2023 est.) | Coastline: 2,237 km | Internet country code: .ec |
Source: [1,2,3,4,5]

Panoramic aerial view of Quito City, Ecuador. Envato. DJ6X5RVG8Y
Ecuador’s ranking positions relative to other countries have been determined for an extensive list of economic, energy, innovative and educational indices, as well as for metrics reflecting the state of the environment. The economic indices include, for example, GDP per capita, annual average GDP growth, high-technology exports, and others. The list of energy indices includes proven reserves of oil, gas and coal, production-consumption ratio combined, and energy use, etc. Each of the indices has a ranked list of included member countries. Since the number of countries in each rating is different for each index, the positioning of the country of interest is displayed on a special chart, where the vertical axis is a uniform relative scale from 0 to 1, whereas the horizontal axis denominates the various indices and respective numbers relating to the descriptions given underneath.
Thus, in such a relative “0-1” diagram, the country’s position is marked with a dot in proportion to its location in the original rating list. If the country is among the leaders regarding the selected indicator, it will be marked close to 1 in the upper green zone on the relevant chart “0-1”, if the country is an outsider in the rating list, then it will be marked in the lower red zone of the chart “0-1”, etc.
Ranking position of Ecuador for list of economic indices:
| Sources: 1. GDP (purchasing power parity), 2020 est. / The World Factbook/Library/Central Intelligence Agency *228 2. GDP - per capita (PPP), 2020 / The World Factbook/Library/Central Intelligence Agency *229 3. Inflation rate (consumer prices), 2019 est. / The World Factbook/Library/Central Intelligence Agency *228 4. Charges for the use of intellectual property, receipts (BoP, current US$), 2020 / International Monetary Fund, Balance of Payments Statistics Yearbook, and data files. / License: CC BY-4.0 *88 5. The Global Competitiveness Index 2019 / Rankings / Reports / World Economic Forum *141 6. High-technology exports (current US$) 2019-2020 / United Nations, Comtrade database through the WITS platform / License: CCBY-4.0 / Data *134 7. 2021 Index of Economic Freedom / International Economies / The Heritage Foundation *178 8. Reserves of foreign exchange and gold, 2017 est. / The World Factbook / Library / Central Intelligence Agency *195 9. Annual average GDP growth in %, for the last 10 years (2011-2020) / World Bank national accounts data, and OECD National Accounts data files / License: CC BY-4.0 *206 10. Public debt (% of GDP), 2017 est. / The World Factbook / Library / Central Intelligence Agency (from smallest to largest) *210 * Total number of countries participating in ranking Figure 1. Economic Indices of Ecuador |
As the chart above shows, most of the country's economic indicators are below the world average. In general, Ecuador is dependent on oil production, and oil prices on the world market have a direct impact on the economic performance. The highest indicators depicted in the ranking are the Inflation rate (0.89), Gross domestic product based on purchasing power parity (0.70), and Public debt as % of GDP (0.54). The weakest spots in the country's economic indicators are Index of Economic Freedom (0.16) and Charges for the use of intellectual property (0.25).
Energy resources
In addition to modest reserves of natural gas and coal, Ecuador has substantial proven crude oil reserves. The country is one of South America’s top oil producers, and the share of oil reserves is 0.49% of the global total. The share of the population of Ecuador is approximately 0.23% of the world's population. However, at the same time, oil reserves in Ecuador are significantly lower than those of the world leaders. For instance, they are more than 36 times less than in Venezuela and are more than 31 times less than in Saudi Arabia. [6].
In terms of tons of oil equivalent, according to 2024 data, conventional proved reserves by fuel type were: 97.7% – crude oil, 1.4% – coal, and 0.9% – natural gas (Fig.5).
Table 1. Fossil energy resources of Ecuador
| Resource /Explanations | Crude oil* | Natural gas* | Coal* | Tight Oil | Shale Gas |
|---|---|---|---|---|---|
| Value | 8.27 (0.49%) | 0.39 (0.005%) | 26.46 (0.002%) | no date | no date |
| Unit | billion barrels | Tcf | million short tons | - | - |
| Year | 2021 | 2020 | 2021 | - | - |
| Source | [6] | [6] | [6] | [-] | [-] |
* share of the country’s reserves in world total is provided in brackets
Hydropower prevails in terms of installed renewable energy capacities (more than 96.3%), followed by bioenergy (2.8%), solar energy (0.5%), and wind energy (0.4%). Hydropower plays a major role in Ecuador’s power generation, contributing about 79% to all electricity produced in 2022.
However, the country is not fully utilizing its very high overall hydropower potential (167 000 GWh/per year) of its mountainous terrain and numerous rivers. This also applies to solar power generation, which could also be much higher due to the favorable climate conditions.
Table 2. Renewable energy resources of Ecuador
| Resource/ explanations | Solar Potential (GHI)* | Wind Potential (50 м)* | Bio Potential (agricultural area) | Bio Potential (forest area) | Hydro Potential** | Municipal Solid Waste |
|---|---|---|---|---|---|---|
| Value | 4.4-5.7 | <4.0 | 21.8 | 50.3 | 167 000 | 0.89 |
| Unit | kWh/m2/day | m/s | % of land area | % of land area | GWh/year | kg/per capita/day |
| Year | 2020 | 2020 | 2020 | 2020 | 2013 | 2018 |
| Source | [7] | [8] | [9] | [10] | [11] | [12] |
*for the majority of the territory of the country
**gross theoretical capability
The average solar activity in the country is 4.4-5.7 kWh/m2 per day, and in areas of high activity, especially in the Andean highlands in the center of the country, Ecuador boasts high solar resources of 5.7-6.0 kWh/m2 per day. The same region and the Galapagos Islands also have high wind speeds, reaching over 7.5 m/s at 50 m height.
The development of solar and wind energy has become particularly important in recent years due to the shortage of electricity caused by low hydroelectric output in the face of a severe drought.
ECUADOR. MARISCAL SUCRE INTL
Latitüde: -0.14 Longitude: -78.49
Average daily sky coverage over 10 years of observations, %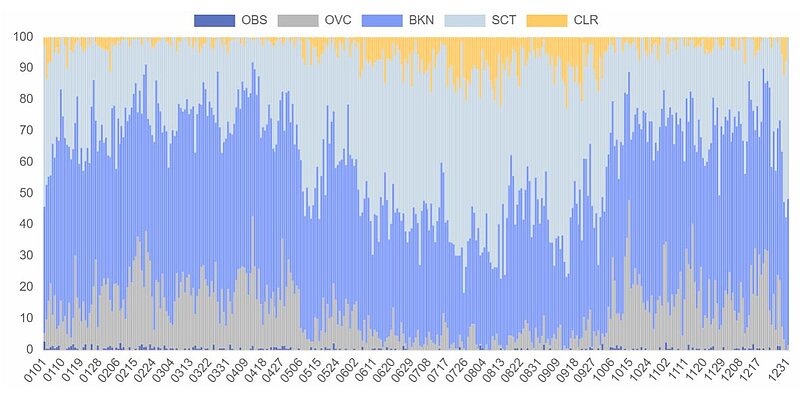
CLR - clear, SCT - scattered from 1/8 TO 4/8, BKN - broken from 5/8 TO 7/8, OVC - overcast, OBS - obscured, POB - partial obscuration
Source: based on NOAA U.S. Department of Commerce
Detailed information: Interactive map of solar resources
ECUADOR. ESMERALDAS AEROPUERTO (TACHINA)
Latitüde: 0.97 Longitude: -79.62
Average speed: 3.38 m/s, Operational share: 53%
Average daily wind speed for 10 years of observations, m/s, 10 m above the ground
Source: based on NOAA U.S. Department of Commerce
Detailed information: Interactive map of wind resources
With more than 40 active volcanoes, Ecuador has a large geothermal potential that has not been fully exploited due to various infrastructural and geological constraints, but in the medium and long term the development of this type of energy appears promising.
Ecuador has one of the richest biodiversity in the world. Along with by-products from forestry, agriculture and livestock production represent significant amounts of biomass. Biofuels such as bioethanol from sugarcane and biodiesel from palm oil are widely used in Ecuador.
Energy Balance
In 2022 in Ecuador, the total production of primary energy was 1.165 quadrillion Btu, while consumption was at the level of 0.542 quadrillion Btu. Thus, the share of domestic consumption in primary energy production is 46.5%, meaning that Ecuador is largely energy independent. The country is an important exporter of crude oil. Energy consumption per capita in 2022 was 30.11 million Btu per person, and energy consumption per GDP – 2.68 thousand Btu per USD at purchasing power parities [6].
According to the BP Statistical Review of World Energy 2022, total primary energy consumption in Ecuador in 2021 was 0.76 exajoules, about 64.5% of which was crude oil, 31.6% – hydro energy, 2.6% – natural gas, and 1.3% – renewables [13].
Source: U.S. Energy Information Administration (Mar 2024) / https://www.eia.gov
Figure 2. The production and consumption of fossil fuels in Ecuador (coal – left, gas – in the center, oil – right)
Domestic oil production is about twice as high as consumption and has remained stable over the last ten years. The gap between output and demand allows the country to export a significant amount of crude oil, mainly to Latin and North American countries.
Compared to oil production, Ecuador's natural gas production is rather limited, and all natural gas produced in Ecuador is consumed domestically.
Although there are some coal reserves in Ecuador, they are not being exploited, and in general coal does not play a significant role in overall energy consumption. The small amounts of coal consumed are imported, mainly from the USA.
Sources: U.S. Energy Information Administration (Mar 2024) / https://www.eia.gov | ||
| Figure 3. Electricity production in Ecuador |
Ecuador is generally self-sufficient in electricity and even exports electricity during periods of excess generation. Over the last 10 years, electricity consumption has increased by more than a third and is mainly provided by hydroelectric power plants, which account for 79% of the country's power supply. This makes the country's energy sector highly vulnerable to droughts and correspondingly low water levels. This weakness is pushing the accelerated development of solar and wind power, the share of which has been negligible for many years.
| Sources: 1. Crude oil proved reserves, 2021 / International Energy Statistic/Geography / U.S. Energy Information Administration (Nov 2021)*98 2. Natural gas proved reserves 2021 / International Energy Statistic / Geography / U.S. Energy Information Administration (Nov 2021) *99 3. Total recoverable coal reserves 2019 / International Energy Statistic / Geography / U.S. Energy Information Administration (Nov 2021) *81 4. Combination production-consumption for Crude oil 2018 / International Energy Statistic / Geography / U.S. Energy Information Administration (Nov 2021) *219 5. Combination production-consumption for Natural gas 2019 / International Energy Statistic / Geography / U.S. Energy Information Administration (Nov 2021) *123 6. Combination production-consumption for Coal 2019 / International Energy Statistic / Geography / U.S. Energy Information Administration (Nov 2021) *128 7. Electricity – from other renewable sources (% of total installed capacity), 2017 est. / The World Factbook / Library / Central Intelligence Agency *170 8. GDP per unit of energy use (PPP per unit of oil equivalent), 2020 *66 Primary energy consumption - BP Statistical Review of World Energy 2021/BP;GDP (purchasing power parity) - The World Factbook/Library/Central Intelligence Agency 9. Energy use (primary energy use of oil equivalent per capita) 2020 *127 Primary energy consumption – BP Statistical Review of World Energy 2021; Population - United Nations, Department of Economic and Social Affairs, Population Division (2019). World Population Prospects 2019, custom data acquired via website. Retrieved 15 November 2021*66 10. The Global Energy Architecture Performance Index Report (EAPI) 2017 / Rankings / Reports / World Economic Forum 11. Electric power consumption (kWh per capita), 2016 *217 Electricity Consumption - The World Factbook / Library / Central Intelligence Agency; Population - United Nations, Department of Economic and Social Affairs, Population Division (2019). World Population Prospects 2019, custom data acquired via website. Retrieved 15 November 2021 12. Combination of electricity production-consumption (kWh)/The World Factbook/Library/Central Intelligence Agency *216 * Total number of countries participating in ranking Figure 4. Energy indices of Ecuador |
Ecuador has relatively high indicators for crude oil reserves (0.83) and the Combination production-consumption for crude oil (0.90) is the highest indicator of those presented in the graph. In addition, Ecuador has a good electricity generation to consumption ratio (0.74). In terms of Energy use per capita (0.15) and Electricity from other renewable sources (0.19), the country ranks substantially lower than the world average.
Energy Infrastructure
The territorial map of Ecuador's fossil fuel infrastructure is shown below. Ecuador's crude oil reserves are concentrated in the eastern part of the country in the Amazon. The oil produced there is transported by pipeline through the Andes Mountains to the port of Esmeraldas in the north, where also the country’s biggest oil refinery is located.
The largest reserves are in Yasuni National Park, some of which are already being produced, such as the Ishpingo, Tambokocha and Tiputini fields. However, Yasuni National Park is a protected national territory, one of the most biodiverse regions on the planet, which makes oil extraction difficult because of the risk of destroying the unique environment. In August 2023, Ecuador held a historic referendum in which a majority of Ecuadorians voted to stop oil drilling in Yasuní National Park, which will result in the preservation of about 726 million barrels of oil underground [14].
Figure 5. Basic infrastructure facilities of the fossil fuel sector in Ecuador
Natural gas production is limited in Ecuador and its infrastructure is less developed than the oil sector. All gas produced in the country is consumed domestically, predominantly by the industry sector. Nearly all of the production came from the Amistad offshore field, located in shallow water in the Gulf of Guayaquil. The rest of the natural gas is associated with oil production.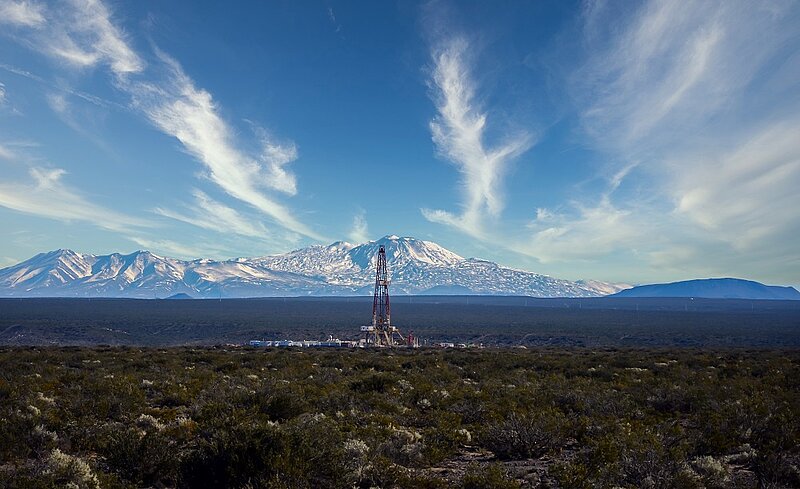
Beautiful shot of oil field drilling on the mountains. Envato. JTBAGCRW9D
Figure 6. Electricity production in Ecuador
As already mentioned, about 79% of Ecuador's electricity demand is covered by hydroelectric power plants. The Coca-Codo-Sinclair plant, located on the Coca River in Napo province, is Ecuador's largest hydroelectric plant with a capacity of 1,500 MW. Almost all of the remaining electricity is generated by conventional oil-fired thermal power plants. Natural gas and other renewable sources generate about 5% of electricity. However, the biggest operation fossil fuel power plant, the Termogas Machala, is gas powered. The Esmeraldas Oil Power Plant with a total output of 228 MW, is the country’s biggest oil power plant. 
Figure 7. Renewable energy in Ecuador
Currently, the largest renewable plant in the country is the Huascachaca wind farm with a capacity of 50 megawatts, capable of providing electricity to more than 90,000 homes. It is located in San Sebastián de Juluc, on a plateau at an altitude of 1,400 meters, and is equipped with 14 wind turbines of 3.571 MW each [15].
Ecuador has recently adopted legislative amendments regarding alternative energy and energy supply. The highest priority is the development of wind and solar energy, also in order to get rid of the heavy dependence on hydropower, which has been experiencing failures due to droughts. In the field of renewable energy, many new projects have emerged, such as El Aromo, a significant solar photovoltaic (PV) plant in the province of Manabí, which will produce at least 200 MW, or the Villonaco III wind project, located in the province of Loja, with a capacity of 110 MW. In addition, as part of the Electricity Master Plan, it is planned to build the Santiago hydroelectric plant, which will consist of eight units with an installed capacity of 2,400 MW [16].
Education and Innovation
The following chart shows Ecuador’s positions in terms of education and innovation.
| Sources: 1. The Global Innovation Index 2021, Rankings / Knowledge / World Intellectual Property Organization / Cornell University, INSEAD, and WIPO (2021): Energizing the World with Innovation. Ithaca, Fontainebleau, and Geneva *132 2. Patent Grants 2011-2020, resident & abroad / Statistical country profiles / World Intellectual Property Organization *185 3.Patents in Force 2020 / Statistical country profiles / World Intellectual Property Organization *109 4. QS World University Rankings 2022 *97 5. SCImago Country Rankings (1996-2020) / Country rankings / SCImago, (n.d.). SIR-SCImago Journal & Country Rank [Portal]. Retrieved 17 Nov 2021 *240 6. Internet users in 2018 / The World Factbook / Central Intelligence Agency *229 7. Internet users in 2018 (% Population) / The World Factbook / Central Intelligence Agency *229 8. Government expenditure on education, total (% of GDP), 2019 / United Nations Educational, Scientific, and Cultural Organization (UNESCO) Institute for Statistics. License: CCBY-4.0 / Data as of September 2021*177 9. Research and development expenditure (% of GDP), 2018 / UNESCO Institute for Statistics. License: CCBY-4.0 / Data *119 10. Scientific and technical journal articles, 2018 / National Science Foundation, Science and Engineering Indicators. License: CCBY-4.0 / Data *197 * Total number of countries participating in ranking Figure 8. The indices of education and innovation in Ecuador |
Exactly half of the country's performance in education and innovation is below the world average. Ecuador is well positioned in terms of absolute number of Internet users (0.76), but looking at the share of Internet users in the population, the country's values are significantly lower (0.45). Other relatively high Ecuador's indicators include the Scientific and technical journal articles (0.68), the SCImago Country Rankings (0.68), and Government expenditure on education (0.59). Indicators for both patents in force (0.10) and patent grants (0.28) belong to the weakest spots of the presented indices of education and innovation in Ecuador.
Ecology and Environment Protection
Indicators related to environmental issues are presented in the following diagram.
| Sources: 1. CO2 total emission by countries 2020 / European Commission / Joint Research Centre (JRC) / Emission Database for Global Atmospheric Research (EDGAR)*208 2. CO2 per capita emission 2020/European Commission/Joint Research Centre (JRC) / Emission Database for Global Atmospheric Research (EDGAR) *208 3. Forest area 2020 (% of land area) / The Global Forest Resources Assessment 2020 / Food and Agriculture Organization of the United Nations *234 4. Forest area change 2010-2020 (1000 ha/year) / The Global Forest Resources Assessment 2020 / Food and Agriculture Organization of the United Nations *234 5. The Environmental Performance Index (EPI) 2020 / Rankings / Yale Center for Environmental Law & Policy / Yale University *180 6. Annual freshwater withdrawals (m3 per capita), 2017 *179 Annual freshwater withdrawals, total (billion m3), 2017 – Food and Agriculture Organization, AQUASTAT data. /License: CC BY-4.0; Population – United Nations, Department of Economic and Social Affairs, Population Division (2019). World Population Prospects 2019, custom data acquired via website. Retrieved 15 November 2021 7. The National Footprint Accounts 2017 (Biocapacity Credit / Deficit) / Global Footprint Network *188 8. Methane emissions (kt of CO2 equivalent), 2018 / Data for up to 1990 are sourced from Carbon Dioxide Information Analysis Center, Environmental Sciences Division, Oak Ridge National Laboratory, Tennessee, United States. Data from 1990 are CAIT data: Climate Watch. 2020. GHG Emissions. Washington, DC: World Resources Institute. Available at: License : Attribution-NonCommercial 4.0 International (CC BY-NC 4.0) *191 9. The Climate Change Performance Index (CCPI) 2022 / Overall Results / Jan Burck, Thea Uhlich, Christoph Bals, Niklas Höhne, Leonardo Nascimento / Germanwatch, NewClimate Institute & Climate Action Network *60 * Total number of countries participating in ranking Figure 9. Environmental Indices of Ecuador |
Ecuador's unique ecosystem faces various environmental challenges related to climate change, water pollution and high CO2 (0.33) and methane (0.32) emissions. As the graph above shows, the country has a relatively large forest area (0.75), but deforestation is among the main problems, and forest area change (0.11) is the weakest of those presented. 
Lake in Ecuador. Envato. E97SXDLK6V
Ecuador is not included in the Climate Change Performance Index (CCPI) 2022, so this position in the chart remains unfilled.
References
[1] List of sovereign states and dependencies by area / Wikipedia / https://en.wikipedia.org/wiki/List_of_sovereign_states_and_dependencies_by_area
[2] List of countries and dependencies by population density / Wikipedia / https://en.wikipedia.org/wiki/List_of_countries_and_dependencies_by_population_density
[3] Ecuador / The world factbook / Library / Central Intelligence Agency / www.cia.gov
[4] GDP, PPP (constant 2011 international $) / World Bank, International Comparison Program database. License: CC BY-4.0 / Data / The World Bank / www.worldbank.org
[5] GDP per capita, PPP (current international $) / World Bank, International Comparison Program database. License: CC BY-4.0 / Data / The World Bank / www.worldbank.org
[6] Ecuador / Geography / U.S. Energy Information Administration / www.eia.gov/international/overview/world
[7] Solar resource data obtained from the Global Solar Atlas, owned by the World Bank Group and provided by Solargis / Global Solar Atlas / http://globalsolaratlas.info/
[8] Wind Map / Global Wind Atlas 2.0, a free, web-based application developed, owned and operated by the Technical University of Denmark (DTU) in partnership with the World Bank Group, utilizing data provided by Vortex, with funding provided by the Energy Sector Management Assistance Program (ESMAP). For additional information: https://globalwindatlas.info
[9] Agricultural land (% of land area) / Food and Agriculture Organization, electronic files and web site. License: CC BY-4.0 / Data / The World Bank / www.worldbank.org
[10] Forest area (% of land area) / Food and Agriculture Organization, electronic files and web site. License: CC BY-4.0 / Data / The World Bank / www.worldbank.org
[11] World Energy Resources: Hydro World Energy Council / 2013 / Publications / World Energy Council / www.worldenergy.org
[12] What a Waste 2012 (PDF) / Resources / The World Bank / www.worldbank.org
[13] BP Statistical Review of World Energy 2020 - 2022 (PDF) / BP / www.bp.com
[14] Ecuadorians vote to halt oil drilling in biodiverse Amazonian national park / August 2023 / www.theguardian.com/world/2023/aug/21/ecuador-votes-to-halt-oil-drilling-in-amazonian-biodiversity-hotspot
[15] Ecuador's 50-MW state-owned wind farm nears operations / Renewables now / https://renewablesnow.com/news/ecuadors-50-mw-state-owned-wind-farm-nears-operations-813022/
[16] Alternative Energy & Power 2023. Ecuador (PDF) / July 20, 2023 / https://practiceguides.chambers.com/practice-guides/alternative-energy-power-2023/ecuador/trends-and-developments/O14050
The sources of charts and curves are specified under the images.
For more information about the energy industry in Ecuador see here