
Contents
General State of the Economy
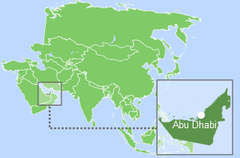
The United Arab Emirates, or the UAE, is located in the eastern part of the Arabian Peninsula. The country consists of seven emirates: Abu Dhabi, Ajman, Dubai, Ras Al Khaimah, Umm al-Quwain, Fujairah and Sharjah. The UAE borders Oman in the southeast and northeast, Saudi Arabia in the west and south, and Qatar in the north. The country also has exits to the Persian and Oman Gulfs.
According to 2022 statistics, the UAE, which in terms of the size of its territory is 71st in the world, is home to 9.9 million people. In terms of population density the country is 115th in the world [1,2,3]. The total length of the country's coastline is 1 318 km [3].
| The United Arab Emirates / دولة الإمارات العربية المتحدة | ||
|---|---|---|
| Capital: Abu Dhabi | Density: 99/km2 | Currency: UAE dirham (AED) |
| Official languages: Arabic, English | Life expectancy at birth: 79.56 years | GDP (PPP): $655.79 billion (2019 est.) |
| National Day: 2 December | Area (land): 83,600 km2 | GDP - per capita (PPP): $67,100 (2019 est.) |
| Population: 9,915,803 (2022 est.) | Coastline: 1,318 km | Internet country code: .ae |
Source: [1,2,3,4,5]
Each emirate is an absolute monarchy. The Emir of Abu Dhabi is the president of the UAE, the capital of the state is also the capital of this emirate – the city of Abu Dhabi, the political form of government is the federation of absolute monarchies, and the official language is Arabic [3].
The United Arab Emirate’s ranking positions relative to other countries have been determined for an extensive list of economic, energy, innovative and educational indices, as well as for metrics reflecting the state of the environment. The economic indices include, for example, GDP per capita, annual average GDP growth, high-technology exports, and others. The list of energy indices includes proven reserves of oil and gas, production-consumption ratio combined, and energy use, etc. Each of the indices has a ranked list of included member countries. Since the number of countries in each rating is different for each index, the positioning of the country of interest in the rating is displayed on a special chart, where the vertical axis is a uniform relative scale from 0 to 1, whereas the horizontal axis denominates the various indices and respective numbers relating to the descriptions given underneath.
Thus, in such a relative “0-1” diagram, the country’s position is marked with a dot in proportion to its location in the original rating list. If the country is among the leaders regarding the selected indicator, it will be marked close to 1 in the upper green zone on the relevant chart “0-1”, if the country is an outsider in the rating list, then it will be marked in the lower red zone of the chart “0-1”, etc.
Ranking position of the United Arab Emirates for list of economic indices:
| Sources: 1. GDP (purchasing power parity), 2020 est. / The World Factbook/Library/Central Intelligence Agency *228 2. GDP - per capita (PPP), 2020 / The World Factbook/Library/Central Intelligence Agency *229 3. Inflation rate (consumer prices), 2019 est. / The World Factbook/Library/Central Intelligence Agency *228 4. Charges for the use of intellectual property, receipts (BoP, current US$), 2020 / International Monetary Fund, Balance of Payments Statistics Yearbook, and data files. / License: CC BY-4.0 *88 5. The Global Competitiveness Index 2019 / Rankings / Reports / World Economic Forum *141 6. High-technology exports (current US$) 2019-2020 / United Nations, Comtrade database through the WITS platform / License: CCBY-4.0 / Data *134 7. 2021 Index of Economic Freedom / International Economies / The Heritage Foundation *178 8. Reserves of foreign exchange and gold, 2017 est. / The World Factbook / Library / Central Intelligence Agency *195 9. Annual average GDP growth in %, for the last 10 years (2011-2020) / World Bank national accounts data, and OECD National Accounts data files / License: CC BY-4.0 *206 10. Public debt (% of GDP), 2017 est. / The World Factbook / Library / Central Intelligence Agency(from smallest to largest) *210 * Total number of countries participating in ranking Figure 1. Economic Indices of the United Arab Emirates |
Since the discovery of oil in the country there has been rapid economic growth, which has made it possible to achieve a high standard of living for the population; this is reflected in the comparative diagram of various economic indices – Figure 1. The oil sector forms the base of the UAE’s economy, but the government is actively trying to diversify sources of income of GDP [3]. In almost all cases the positioning of the country is higher than the world average, in the upper half of the chart (among 50% of the best countries in the world are included in the rating). Due to the rather large resource base, an open economy, flexible taxation system, active attraction of foreign investment, such indicators as the level of GDP, reserves of foreign exchange and gold are in the top quarter of the graph (among 25% of the best countries in the world are included in the rating).
Since the early 1990s, the country has experienced a steady growth in GDP at purchasing power parity [4]. GDP at purchasing power parity increased from $637.3 in 2017 to $655.8 billion (34th place in the world) in 2019 [3].
The country’s GDP at purchasing power parity per capita is somewhat higher (12th place in the world), which has been demonstrating negative dynamics: from $70 000 in 2015 to $67 100 in 2019 [3,5]. The inflation rate changed from 1.9% in 2017 to - 1.9% in 2019; according to this indicator, the country is 4th in the world [3].
According to the Global Competitiveness Report, presented by the World Economic Forum in 2019, the United Arab Emirates is 25th out of an estimated total of 141 countries. This rating reflects the effectiveness of the use of the country’s own resources for sustainable development. In addition to a number of economic indicators this index also takes into account such variables as education, health, level of innovation, etc. In the list of countries that exported high-tech products in 2019-2020, the country was 60th out of 134 countries.
According to the Index of Economic Freedom, which is based on freedom of business, freedom from government action, property protection, and freedom from corruption, the United Arab Emirates was 14th in 2021 out of the 178 countries considered. In terms of gold reserves and foreign exchange reserves the country was 27th in the world in 2017.
According to the indicator for the average GDP growth in percentage over the last 10 years, in 2020 the country was 49th out of 206 countries. In terms of public debt, calculated as a percentage of the country's GDP, the country was ranked 190th out of 210 countries considered in 2017.
Energy Resources
The UAE has substantial proven fossil fuel reserves. The share of oil reserves is about 6% of the world’s total, the share of natural gas is 3% as well [6]. However, oil reserves are more than 2.5 times less than in Saudi Arabia (258.6 billion bbl) while gas reserves are almost four times less than in Qatar (842.627 Tcf) [6].
In terms of tons of oil equivalent, proved reserves of conventional hydrocarbons as of 2021 were: proved oil reserves – 70.9%, natural gas – 29.1% (Fig. 5). The matrix of unconventional natural resources looks somewhat different: shale gas – 63.8%, shale (tight) oil – 36.2% (Fig.5). At the same time, the total reserves of unconventional fossil resources are slightly less than half of the conventional resources.
Table 1. Fossil energy resources of the United Arab Emirates
| Resource /Explanations | Crude oil* | Natural gas* | Coal | Shale Gas** | Tight Oil** | Coal Mine Methane |
|---|---|---|---|---|---|---|
| Value | 97.8 (5.88%) | 215.1 (2.96%) | no data | 205.3 | 22.6 | no data |
| Unit | billion barrels | Tcf | – | Tcf | billion barrels | – |
| Year | 2021 | 2020 | – | 2015 | 2015 | – |
| Source | [6] | [6] | – | [7] | [7] | – |
*share of the country’s reserves in world total is provided in brackets
**unproved technically recoverable
In absolute terms, proved oil reserves in the country in 2021 were estimated at 97.8 billion barrels according to [3, 6, 7].
The U.S. Energy Information Administration [6] estimated the reserves of natural gas in the United Arab Emirates in 2021 at 215 Tcf, and the Central Intelligence Agency at 6.091 trillion m3 [3]. In the BP report, proved natural gas reserves in 2020 were 209.7 Tcf [7], while according to the OAPEC report, at the end of 2016 they were 6 091 Bcm [8].
According to [9], shale (tight) oil reserves in the UAE in 2014 amounted to 22.6 billion barrels, which is second only to Libya among countries in the region. The UAE also has the second largest shale gas reserves in the Middle East and North Africa after Algeria, which in 2014 were 205.3 Tcf [9].
The UAE does not possess a rich variety of renewable energy sources. A selection of basic indicators of this type of resource is presented in Table 2.
The level of direct solar radiation in most of the country is <5.5 kWh/m2/day [10]. The maximum level of solar radiation can be observed in the south of the country – about 5.5-5.7 kWh/m2/day.
The distribution of wind resources is as follows: in most of the country the wind speed does not exceed 4.5-5.5 m/s [11]. The peak of wind activity is noted in northeast, where the wind speed can exceed 5.5 m/s at a height of 50 m [11]. About 4.6% of the UAE is covered by agricultural land and around 3.8% is forested [12,13].
Table 2. Renewable energy resources of the United Arab Emirates
| Resource/ Explanations | Solar Potential (GHI)* | Wind Potential (50 м)* | Geothermal Potential | Bio Potential (agricultural area) | Bio Potential (forest area) | Municipal Solid Waste |
|---|---|---|---|---|---|---|
| Value | <5.5 | 4.5–5.5 | no data | 4.6 | 3.8 | 1.60 |
| Unit | kWh/m2/day | m/s | – | % of land area | % of land area | kg/per capita/day |
| Year | 2018 | 2018 | – | 2018 | 2018 | 2016 |
| Source | [10] | [11] | – | [12] | [13] | [14] |
*for most of the territory of the country
The level of generation of municipal waste in the country in 2016 was 1.60 kg per capita per day, and is projected to grow to 2 kg per capita per day in 2025. This figure is significantly lower than that of most highly developed countries and roughly corresponds to that of Saudi Arabia – 1.4 kg per capita per day [14].
Energy Balance
According to [6], in 2021 in the UAE, the total production of primary energy was 10.086 Btu, while consumption was at the level of 4.645 Btu. Thus, the share of domestic consumption in primary energy production is 46%, meaning that the UAE is largely energy independent. The country is an important exporter of crude oil and gas, in particular to Asian countries. Energy consumption per capita in 2021 was 495.97 million Btu per person, and energy consumption per GDP, (2021) - 7.18 thousand Btu per USD at purchasing power parities [6].
According to the BP Statistical Review of World Energy 2022, total primary energy consumption in the United Arab Emirates in 2021 was 4.53 exajoules, about 55.2% of which was natural gas, and 39.7% was oil, 2.2% – nuclear, while coal was 1.5% and renewables – 1.1% [7]. In the OAPEC report, energy consumption in 2016 was estimated at 1 761.4 thousand barrels of oil equivalent per day [8].
Oil production in the country increased from 2500 thousand barrels/day in 2001 to 3 786 thousand barrels/day in 2021 (Fig. 2) [15]. In BP's report, in 2021 production was estimated at 3 668 thousand barrels/day [7].
Source: U.S. Energy Information Administration (Dec 2021) / www.eia.gov
Figure 2. The production and consumption of fossil fuels in the United Arab Emirates (left – coal, in the center – gas, right – oil)
According to the AOPEC report the country's oil production in 2016 was 3088.3 thousand barrels/day [8].
At the same time, the consumption of this resource remained practically unchanged over the course of 15 years, and in 2019 it amounted to 864 thousand barrels/day [15]. According to [7], in 2021, oil consumption was at the level of 952 thousand barrels/day, according to OAPEC [8] report – 437.3 thousand barrels of oil equivalent/day in 2016.
According to [6] in 2018, crude oil exports were at the level of 2.4 million barrels/day. The main consumers of oil and oil products from the UAE are the Asian countries [6].
Production and consumption of natural gas between 2001 and 2019 showed solid growth (Fig. 2) and in 2019 reached a level of 2221 Bcf, and 2604 Bcf respectively [6]. According to [7] gas production in 2021 was 57 billion m3, while consumption was at the level of 69.4 Bcm [7].
Coal consumption in the country, according to 2021 data, was about 2.6 million short tons [15].
Sources: U.S. Energy Information Administration (Dec 2021) / www.eia.gov | ||
| Figure 3. Electricity production in the United Arab Emirates |
The United Arab Emirates almost completely rely on fossil resources to produce electricity (Figure 3.). Electricity production in the country in 2019 was at the level of 129.41 TWh (Fig.6). According to the OAPEC report, in 2016 the production of electricity was 127 366 GW/h, and consumption – 126 582 GW/h [8].
The country’s position in the comparative diagram of energy index is shown in Figure 4.
The indices, which are based on reserves of fossil fuels and export opportunities, show the United Arab Emirate’s distinct advantage over most of the world. In the list of countries for the production of electricity from renewable sources (excluding hydropower), in 2017 the country was close to bottom of the list – 169th out of 170 countries selected for consideration, ahead of Saudi Arabia. In the Energy Architecture Performance Index 2017, which is based first on the level of economic growth, environmental safety, and energy independence of the country, including access to energy, the UAE is 107th out of 127 countries considered. However, it should be noted that during the last 8 years the country has lost 11 ranking positions.
| Sources: 1. Crude oil proved reserves, 2021 / International Energy Statistic/Geography / U.S. Energy Information Administration (Nov 2021)*98 2. Natural gas proved reserves 2021 / International Energy Statistic / Geography / U.S. Energy Information Administration (Nov 2021) *99 3. Total recoverable coal reserves 2019 / International Energy Statistic / Geography / U.S. Energy Information Administration (Nov 2021) *81 4. Combination production-consumption for Crude oil 2018 / International Energy Statistic / Geography / U.S. Energy Information Administration (Nov 2021) *219 5. Combination production-consumption for Natural gas 2019 / International Energy Statistic / Geography / U.S. Energy Information Administration (Nov 2021) *123 6. Combination production-consumption for Coal 2019 / International Energy Statistic / Geography / U.S. Energy Information Administration (Nov 2021) *128 7. Electricity – from other renewable sources (% of total installed capacity), 2017 est. / The World Factbook / Library / Central Intelligence Agency *170 8. GDP per unit of energy use (PPP per unit of oil equivalent), 2020 *66 Primary energy consumption - BP Statistical Review of World Energy 2021/BP;GDP (purchasing power parity) - The World Factbook/Library/Central Intelligence Agency 9. Energy use (primary energy use of oil equivalent per capita) 2020 *127 Primary energy consumption – BP Statistical Review of World Energy 2021; Population - United Nations, Department of Economic and Social Affairs, Population Division (2019). World Population Prospects 2019, custom data acquired via website. Retrieved 15 November 2021*66 10. The Global Energy Architecture Performance Index Report (EAPI) 2017 / Rankings / Reports / World Economic Forum 11. Electric power consumption (kWh per capita), 2016 *217 Electricity Consumption - The World Factbook / Library / Central Intelligence Agency; Population - United Nations, Department of Economic and Social Affairs, Population Division (2019). World Population Prospects 2019, custom data acquired via website. Retrieved 15 November 2021 12. Combination of electricity production-consumption (kWh)/The World Factbook/Library/Central Intelligence Agency *216 * Total number of countries participating in ranking Figure 4. Energy indices of the United Arab Emirates |
When considering the GDP per unit of energy use, the country is 52th out of 66 countries surveyed, which is below the world average, while energy consumption per capita is much higher – 4th out of 66 countries. In terms of electricity consumption per capita, the country is 9th in the world, however, for the indicator of combination of electricity production-consumption, the United Arab Emirates is 38th in the ranked list of 216 countries.
Energy Infrastructure
A territorial map of the distribution of the largest infrastructure projects of the fossil fuel sector in the United Arab Emirates is shown in Figure 5.
As previously mentioned, oil reserves amount to around 70.9% of the energy potential of fossil fuels. The majority of oil fields in the UAE are concentrated on the shelf of the Persian Gulf (Fig. 5). The leading oil field is the offshore Upper Zakum, whose production figures are 670 thousand barrels/day [16]. The country's refineries have a total installed capacity of 1 124 000 barrels/day (Fig. 5). The country's largest refinery is Al Ruwais, owned by ADNOC, with an installed capacity of 817 000 barrels/day [17]. The main oil terminal is Ruwais (Fig. 5), and the largest oil storage is Fujairah [18].
Two types of oil pipelines connect the oil fields with the major refineries: pipelines for crude oil that have a total length of 3 287 km and the liquefied petroleum gas pipeline, which is 300 km long (Fig.5). The total length of pipelines for transportation of petroleum products is 218 km.
The largest gas fields are also both continental and offshore (Fig. 5). The leading natural gas field is the Shah natural gas field; production from this field is at the level of 1 billion scfd [19]. Gas is transported through a pipeline 3 277 km long, as well as a pipeline for gas condensate with a total length of 533 km (Fig. 5).
The natural gas processing infrastructure is represented by several plants, the largest of which is the Shah natural gas processing plant with a capacity of 1 000 million scfd [20].
Figure 5. Basic infrastructural facilities of the fossil fuel sector in the United Arab Emirates
The LNG export terminal at Das Island has a capacity of 8 million tons of gas per year, while Dubai Jebel Ali LNG FRSU has 3 million tons of gas per year [21,22]. Figure 6 shows the most important facilities in the UAE producing electrical energy. The share of fossil resources in electricity generation in the UAE in 2019 was about 97.3% (Fig.6). There are about 10 large gas-fired power plants with a capacity of more than 500 MW and one oil power station with a capacity of more than 100 MW (Fig. 6).
The largest gas-fired power plant is the Jebel Ali Complex, with a capacity of more than 5 775 MW [23]. The largest oil power plant is Madinat Zayed with an installed capacity of 118 MW [24]. The Barakah nuclear power plant is under construction and will have an installed capacity of 5 600 MW [25].
Figure 6. Electricity and renewable energy in the United Arab Emirates
As noted above, renewable energy in the Emirates does not have a decisive influence on electricity production and in 2019 electricity production from renewable sources was at the level of 3.56 TWh (Fig. 6).
The solar radiation level in the most populated areas of the country may reach 5.7 kWh/m2/day [10]. Nevertheless, the level of development of solar energy in the country is not comparable with resource opportunities. There are several different solar stations based on photovoltaics and concentrated solar energy (Fig. 6). The largest photovoltaic complex is the Mohammed bin Rashid Al Maktoum Solar Park 1-2, with an installed capacity of 1013 MW [26]. The largest CSP paraboloid type plant is Shams 1 with an installed capacity of 100 MW [27]. In the north-western part of the country along the coast of the Persian Gulf, along the border between Saudi Arabia and Abu Dhabi, the wind speed reach 6 m/s at a height of 90 m. As a result, in the Ruwais area there is a wind park, Sir Bani Yas, which has an installed capacity of 850 kW [28].
Shams Solar Power Station
The priorities of the current energy strategy of the country are diversification of energy sources, elimination of natural gas imports, and the improvement of the environmental situation by reducing the amount of CO2 emissions. The rapidly growing demand for gas has helped to create a number of expensive projects, such as Onshore Gas Development (OGD), Integrated Gas Development (IGD) and Offshore Associated Gas (OAG) projects – that may increase the production of the country’s natural gas reserves [6]. GE and Harbin are planning to build an environmentally friendly coal-fired power plant with a capacity of 6 510 MW that will cost $8 billion [29], while Siemens plans to build a gas-fired power plant with a capacity of 2 200 MW [30]. Within the framework of the UAE Vision 2021 energy strategy, it is planned to increase the share of renewable energy sources to 27% in the next four years. The main focus is on solar energy, the price for which has fallen by almost 70% over the past five years [31]. Abu Dhabi Water and Electricity Company (ADWEC), Chinese JinkoSolar and Japanese Marubeni Corp. plan to build a photovoltaic station in Abu Dhabi, with a capacity of 1 177 MW [32]. There are several projects in the field of domestic waste processing, including the construction of a plant in Abu Dhabi with a capacity of 100 MW, in Dubai with a capacity of 60 MW, in Sharjah – 80 MW [33]. In 2017, the UAE Ministry of Energy, in cooperation with the leading energy sector shareholders, adopted the UAE energy strategy, which will be in place until 2050. This strategy sets a limit of 50% of the share of clean energy in electricity generation, and will save about $190.5 billion. The energy consumption matrix will look as follows: renewable energy sources – 44%, natural gas – 38%, 12% – clean fossil sources, 6% – nuclear energy, while reducing CO2 emissions by 70% [31].
Education and Innovation
The set of indices reflecting the position of the UAE among other countries in the field of education and innovation can be seen in Figure 7. According to the diagrams presented, the UAE is among the countries with a high level of education and innovation, which largely predetermines the technological development in the field of energy. The United Arab Emirates is 33rd out of 132 countries considered in the ranking of countries of the Global Innovation Index (see diagram).
| Sources: 1. The Global Innovation Index 2021, Rankings / Knowledge / World Intellectual Property Organization / Cornell University, INSEAD, and WIPO (2021): Energizing the World with Innovation. Ithaca, Fontainebleau, and Geneva *132 2. Patent Grants 2011-2020, resident & abroad / Statistical country profiles / World Intellectual Property Organization *185 3.Patents in Force 2020 / Statistical country profiles / World Intellectual Property Organization *109 4. QS World University Rankings 2022 *97 5. SCImago Country Rankings (1996-2020) / Country rankings / SCImago, (n.d.). SIR-SCImago Journal & Country Rank [Portal]. Retrieved 17 Nov 2021 *240 6. Internet users in 2018 / The World Factbook / Central Intelligence Agency *229 7. Internet users in 2018 (% Population) / The World Factbook / Central Intelligence Agency *229 8. Government expenditure on education, total (% of GDP), 2019 / United Nations Educational, Scientific, and Cultural Organization (UNESCO) Institute for Statistics. License: CCBY-4.0 / Data as of September 2021*177 9. Research and development expenditure (% of GDP), 2018 / UNESCO Institute for Statistics. License: CCBY-4.0 / Data *119 10. Scientific and technical journal articles, 2018 / National Science Foundation, Science and Engineering Indicators. License: CCBY-4.0 / Data *197 * Total number of countries participating in ranking Figure 7. The indices of education and innovation in the United Arab Emirates |
The United Arab Emirates is active in the field of patenting in many areas of human activity, including energy technologies.
According to the number of patents granted to the UAE residents, both inside the country and abroad, the country ranks 60th in the world, however in terms of patents in force, the country is 66th out of 109 countries considered.
The country is well positioned when considering the number of publications of specialists in scientific and technological journals. It is also regarded highly by the Scimago Journal and Country Rank. As such, the UAE ranks 59th out of 240 countries in the rating of Scimago, and in the Scientific and Technical Journal Activities – 58th out of 197 countries, and it is the highest result for the region.
Universities such as The Petroleum Institute, the United Arab Emirates University, the American University of Sharjah, Khalifa University and the University of Wollongong in Dubai train specialists in various energy fields, including Petroleum Engineering, Electrical Engineering and Environmental Sciences, Nuclear Engineering, etc.
The Masdar Institute of Science and Technology and the University of Shrjah, as well as the American University of Sharjah are actively researching synthetic fuels. The Petroleum Institute, Abu Dhabi National Oil Company and Abu Dhabi Marine Operating Company are conducting research in the field of unconventional oil. The Petroleum Institute and ADCO publish research papers on the subject of associated petroleum gas.
The Abu Dhabi Company for Onshore Oil Operations and Abu Dhabi National Oil Company are engaged in research of hydrocarbons extraction from low-permeability plays.
The United Arab Emirates University, and the Masdar Institute of Science and Technology patent their inventions and publish scientific papers in the field of bioenergy.
A large number of the United Arab Emirates companies patent technical solutions in the field of energy production from renewable sources. In the field of solar energy the following should be mentioned: SABA&CO and Abu Dhabi Future Energy Company as well as the United Arab Emirates University. The Masdar Institute of Science and Technology and the American University of Shrjah, as well as the Petroleum Institute conduct research in this field. Masdar Institute of Science and Technology holds a number of patents and has the highest number of publications in the field of wind energy.
Ecology and Environment Protection
A diagram of environmental indices is shown in Figure 8. This figure shows the indices that have an indirect effect on the energy sector. The environmental situation in the country is very negative; this is indicated by the country's positioning below the world average – most of the indices are at the bottom of the chart. First of all, the country demonstrates a relatively high level of CO2 and methane emissions, both per capita and in general.
In relation to the forest area as a percentage of total land area, the UAE is 199th in the world, but there is a positive trend in forest area change. According to this indicator, the country is 122th in the world. At the same time, the country has a high Environmental Performance Index (EPI) rating, which focuses primarily on assessing the environmental performance of national governments. In this rating the country is 42nd out of 180 member countries and demonstrates a positive trend.
| Sources: 1. CO2 total emission by countries 2020 / European Commission / Joint Research Centre (JRC) / Emission Database for Global Atmospheric Research (EDGAR)*208 2. CO2 per capita emission 2020/European Commission/Joint Research Centre (JRC) / Emission Database for Global Atmospheric Research (EDGAR) *208 3. Forest area 2020 (% of land area) / The Global Forest Resources Assessment 2020 / Food and Agriculture Organization of the United Nations *234 4. Forest area change 2010-2020 (1000 ha/year) / The Global Forest Resources Assessment 2020 / Food and Agriculture Organization of the United Nations *234 5. The Environmental Performance Index (EPI) 2020 / Rankings / Yale Center for Environmental Law & Policy / Yale University *180 6. Annual freshwater withdrawals (m3 per capita), 2017 *179 Annual freshwater withdrawals, total (billion m3), 2017 – Food and Agriculture Organization, AQUASTAT data. /License: CC BY-4.0; Population – United Nations, Department of Economic and Social Affairs, Population Division (2019). World Population Prospects 2019, custom data acquired via website. Retrieved 15 November 2021 7. The National Footprint Accounts 2017 (Biocapacity Credit / Deficit) / Global Footprint Network *188 8. Methane emissions (kt of CO2 equivalent), 2018 / Data for up to 1990 are sourced from Carbon Dioxide Information Analysis Center, Environmental Sciences Division, Oak Ridge National Laboratory, Tennessee, United States. Data from 1990 are CAIT data: Climate Watch. 2020. GHG Emissions. Washington, DC: World Resources Institute. Available at: License : Attribution-NonCommercial 4.0 International (CC BY-NC 4.0) *191 9. The Climate Change Performance Index (CCPI) 2022 / Overall Results / Jan Burck, Thea Uhlich, Christoph Bals, Niklas Höhne, Leonardo Nascimento / Germanwatch, NewClimate Institute & Climate Action Network *60 * Total number of countries participating in ranking Figure 8. Environmental Indices of the United Arab Emirates |
At the end of the review it is also worth noting that, according to the Ecological Footprint Atlas, the country is among the environmental debtors.
In recent years, significant public and private investments have been allocated to solve environmental problems in the country. One such example is the construction of a cluster of environmentally friendly technologies in Masdar City [34], near the city of Abu Dhabi and close to Abu Dhabi International Airport. Despite the repeated postponements of the official opening it is without a doubt a significant and important energy project. Within this project, he government plans to apply many modern technologies related to clean energy production, energy efficiency and energy saving. Masdar has a unique architectural design that includes street coolers. The city has used the most advanced materials for its construction and has been applying the latest solutions in the field of mass automation of urban management, as well as the processing of municipal waste. The city can become a home for 40 000 inhabitants, manufacturers of environmentally friendly products and research organizations. The basis for energy supply of the city is the maximum use of solar energy, mainly photovoltaics. Undoubtedly, the implementation of such a large-scale environmental project can become a living beacon for the construction of similar satellite cities, as well as the promotion of applied technologies in other countries of the world.
References
[1] List of sovereign states and dependencies by area / Wikipedia / https://en.wikipedia.org/wiki/List_of_sovereign_states_and_dependencies_by_area
[2] List of countries and dependencies by population density / Wikipedia / https://en.wikipedia.org/wiki/List_of_countries_and_dependencies_by_population_density
[3] United Arab Emirates / The-world-factbook / Library / Central Intelligence Agency / https://www.cia.gov/
[4] GDP, PPP (constant 2011 international $) / World Bank, International Comparison Program database. License: CC BY-4.0 / Data / The World Bank / http://www.worldbank.org/
[5] GDP per capita, PPP (current international $)/ World Bank, International Comparison Program database. License: CC BY-4.0 / Data / The World Bank / http://www.worldbank.org/
[6] United Arab Emirates / Geography / U.S. Energy Information Administration (May 06, 2020) / http://www.eia.gov/
[7] BP Statistical Review of World Energy 2022 (PDF) / BP / https://www.bp.com/
[8] Annual Statistics Report 2017 (PDF) / AOPEC / http://www.oapecorg.org/
[9] World Shale Resource Assessments / U.S. Energy Information Administration (September 24, 2015) / https://www.eia.gov/
[10] Solar resource data obtained from the Global Solar Atlas, owned by the World Bank Group and provided by Solargis / Global Solar Atlas / http://globalsolaratlas.info/
[11] Wind Map / Global Wind Atlas 2.0, a free, web-based application developed, owned and operated by the Technical University of Denmark (DTU) in partnership with the World Bank Group, utilizing data provided by Vortex, with funding provided by the Energy Sector Management Assistance Program (ESMAP). For additional information: https://globalwindatlas.info
[12] Agricultural land (% of land area) / Food and Agriculture Organization, electronic files and web site. License: CC BY-4.0 / Data / The World Bank / http://www.worldbank.org
[13] Forest area (% of land area) /Food and Agriculture Organization, electronic files and web site. License: CC BY-4.0 / Data / The World Bank / http://www.worldbank.org
[14] World Bank What a Waste / Data / The World Bank / http://www.worldbank.org
[15] International Energy Statistic / Geography / U.S. Energy Information Administration (Jan 2020) /http://www.eia.gov/beta/international/
[16] Zakum / SubSeaIQ / http://www.subseaiq.com/
[17] Ruwais Refinery / Wikipedia / https://en.wikipedia.org/wiki/Ruwais_Refinery
[18] UAE / Middle East / Existing Terminals / Horizon Terminals / http://www.horizon-terminals.com/
[19] Shah Sour Gas Field, United Arab Emirates / Hydrocarbons Technology / http://www.hydrocarbons-technology.com/
[20] Abu Dhabi National Oil Company / Wikipedia / https://en.wikipedia.org/wiki/Abu_Dhabi_National_Oil_Company#Oil_and_gas_processing
[21] Abu Dhabi Gas Liquefaction Company / Wikipedia / https://en.wikipedia.org/wiki/Abu_Dhabi_National_Oil_Company#Abu_Dhabi_Gas_Liquefaction_Company_.28ADGAS.29
[22] Jebel Ali LNG Import Terminal / FSRU / Excelerate Energy L.P. / http://excelerateenergy.com/
[23] 2016 / Annual Statistics / DEWA Publications / Dubai Electricity & Water Authority / https://www.dewa.gov.ae/en/
[24] Production / Al Mirfa Power Company (AMPC) / http://www.ampc.ae/
[25] United Arab Emirates / World Nuclear Association / http://www.world-nuclear.org
[26] Mohammed bin Rashid Al Maktoum Solar Park Phase II, Dubai, United Arab Emirates / Power Technology / http://www.power-technology.com/
[27] Shams 1 / UAE Projects / Masdar / http://www.masdar.ae/en/
[28] Sir Bani Yas Island is home to largest wind turbine in the region / January 30, 2012 / By Shehab Al Makahleh / Gulf News / https://gulfnews.com/
[29] GE and Harbin to build clean coal-fired power plant in UAE / Power Engineering International / http://www.powerengineeringint.com
[30] Siemens to build huge power plant in the UAE / Construction Business News / http://www.cbnme.com/
[31] UAE State of Energy Report 2017 / UAE Ministry of Energy. / https://www.moenr.gov.ae/en/open-data.aspx
[32] EnergyTrend / JinkoSolar and Marubeni Sign to Build 1,177 MW Power Plant in Abu Dhabi / http://pv.energytrend.com/
[33] Waste-to-energy / Government.ae. / http://beta.government.ae/
[34] Masdar City / Masdar / http://masdar.ae/
The sources of charts and curves are specified under the images.
For more information about the energy industry in the UAE see here