
Contents
General State of the Economy
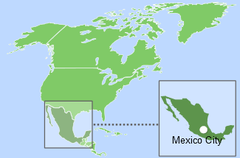
Mexico,officially the United Mexican States, is one of the most developed countries in Latin America. Mexico is located in the southern region of North America and shares a long border with the U.S. to the north, and borders Belize and Guatemala to the south. To the east, the country has access to the Gulf of Mexico and the Caribbean Sea, and to the west to the Gulf of California and the Pacific Ocean. In terms of territory (1 964 thousand km2), Mexico ranks 13th in the world; in terms of population density the country ranks 152nd [1,2].
| Mexico / Estados Unidos Mexicanos | ||
|---|---|---|
| Capital: Mexico City | Density: 61/km2 | Currency: Mexican peso (MXN) |
| Official languages: Spanish | Life expectancy at birth: 70.13 years | GDP (PPP): $2.92 trillion (2022 est.) |
| National Day: 16 September | Area: 1,972,550 km2 | GDP - per capita (PPP): $22,440 (2022 est.) |
| Population: 129,875,529 (2023 est.) | Coastline: 9,330 km | Internet country code: .mx |
Source: [1,2,3,4,5]
The total length of the country's coastline is 9 330 km [3]. As of 2022, the country is home to around 129 million people; more than 60% of the population are mestizos. The administrative map of Mexico is divided into 31 states, and one federal district [3].
Mexico borders the United States and has a free trade agreement (NAFTA) with more than 26 countries, and demonstrates high indices related to GDP, the market value of publicly traded shares, high-technology export of goods and gold reserves (Fig. 1).
| Sources: 1. GDP (purchasing power parity), 2020 est. / The World Factbook/Library/Central Intelligence Agency *228 2. GDP - per capita (PPP), 2020 / The World Factbook/Library/Central Intelligence Agency *229 3. Inflation rate (consumer prices), 2019 est. / The World Factbook/Library/Central Intelligence Agency *228 4. Charges for the use of intellectual property, receipts (BoP, current US$), 2020 / International Monetary Fund, Balance of Payments Statistics Yearbook, and data files. / License: CC BY-4.0 *88 5. The Global Competitiveness Index 2019 / Rankings / Reports / World Economic Forum *141 6. High-technology exports (current US$) 2019-2020 / United Nations, Comtrade database through the WITS platform / License: CCBY-4.0 / Data *134 7. 2021 Index of Economic Freedom / International Economies / The Heritage Foundation *178 8. Reserves of foreign exchange and gold, 2017 est. / The World Factbook / Library / Central Intelligence Agency *195 9. Annual average GDP growth in %, for the last 10 years (2011-2020) / World Bank national accounts data, and OECD National Accounts data files / License: CC BY-4.0 *206 10. Public debt (% of GDP), 2017 est. / The World Factbook / Library / Central Intelligence Agency(from smallest to largest) *210 * Total number of countries participating in ranking Figure 1. Economic Indices of Mexico |
According to aggregate indicators of economic indices, Mexico can be classified as a developed country. In recent years, Mexico has shown moderate economic growth. Between the early 1990s and 2017, the country experienced steady growth in GDP at purchasing power parity, amounting to $2.346 trillion in 2015 and reaching $2.463 trillion in 2017, falling to $2,306 in 2020 [3,4]. By this indicator, Mexico is 13th in the world, ahead of Saudi Arabia and Canada, but behind Brazil and Indonesia [3].
According to GDP at purchasing power parity per capita, Mexico shows a figure above world average – $17 900 in 2020 [3], which has grown almost 3 times since 1990 [5]. The inflation rate in 2019 was 3.6% compared to 6% in 2017 [3]. The basis of Mexico's exports is manufactured goods, oil and petroleum products. Mexico’s main economic partner is the United States; the country also trades extensively with China and Japan.
According to the Global Competitiveness Report, presented by the World Economic Forum in 2019, Mexico placed 48th, out of a total of 141 countries considered. This rating measures the effectiveness of the use of the country’s own resources for sustainable development. In addition to a number of economic indicators this index also takes into account such variables as education, health, level of innovation, etc.
In terms of high-tech product exports, the country ranked 12th out of 134 countries in 2019-2020, ahead of not only all the countries in the region, but a number of European countries and Canada. According to the Index of Economic Freedom, which is based on freedom of business, freedom from government intervention, property protection, and freedom from corruption, Mexico was 65th in 2021, out of the 178 countries considered. In 2020, by average GDP growth in percentage over the last 10 years, the country was 145th out of 206 countries. In terms of public debt, calculated as a percentage of the country's GDP, Mexico was ranked 82nd out of 210 countries considered in 2017.
Mexican oil giant, Pemex, is included in the Global 500 ranking of the world's largest companies.
Energy Resources
Mexico has significant reserves of fossil resources (Table 1), but the primary resource is oil. Mexican oil deposits are represented by reserves of traditional oil, as well as tight oil and extra heavy oil. The country also has large coal reserves and natural gas reserves, including shale gas.
Table 1. Fossil energy resources of Mexico
| Resource / Explanations | Crude oil* | Natural gas* | Coal* | Shale Gas** | Tight Oil** | Coal mine methane | Extra Heavy Oil |
|---|---|---|---|---|---|---|---|
| Value | 5.8(0.34%) | 6.4(0.09%) | 1335(0.11%) | 545.2 | 13.1 | 11.6-29.1 | 1 |
| Unit | billion barrels | Tcf | million short tons | Tcf | billion barrels | Bcm | million barrels |
| Year | 2021 | 2020 | 2021 | 2013 | 2013 | 2010 | 2008 |
| Source | [20] | [20] | [20] | [8] | [8] | [6,11] | [9] |
*share of the country’s reserves in world total is provided in brackets
**unproved technically recoverable
In terms of tons of oil equivalent, in 2021 proved reserves of conventional hydrocarbons in Mexico were: oil – 43.9%; coal – 47.1%; and gas – 9% (Fig.5). The unconventional natural resource matrix was as follows: shale gas – 87.6%; tight oil – 11.2%; associated petroleum gas – 1%; oil sands and extra heavy oil – 0.1%; and coal mine methane utilization potential – 0.1% (Fig. 5).
In terms of oil reserves, Mexico is third among Latin American countries, after Venezuela and Brazil. According to information presented in [3], as of the beginning of 2021, oil reserves totalled 5.786 billion barrels. According to BP's report, from 2000 to 2020, total proven oil reserves decreased from 24.6 to 6.1 billion barrels in 2020 [6]. In a prospective survey by the Secretaria de Energia, proven reserves of traditional oil in Mexico in 2017 were estimated at 7.04 billion barrels, and at 6.46 billion barrels in 2018 [7].
Mexico has large reserves of shale (tight) oil – around 13.1 billion barrels according to 2013 data [8]. The country also has small reserves of extra-heavy oil, estimated at the end of 2008 at approximately 1 million barrels (6 million barrels – original reserves) [9].
Proven reserves of natural gas in Mexico in 2018 were 180.3 billion m³ [3]; BP [6] estimated reserves at 0.2 trillion m³ in 2020.
According to the Energy Information Administration report from 2013, unproven, technically recoverable shale gas reserves in Mexico were 545.2 trillion cubic feet (sixth in the world) [8]. Total reserves of associated petroleum gas were 20,39 Tcf [10].
Coal reserves, according to [6], were estimated at 1 211 million tons in 2020. According to the calculations of Advanced Energy Technologies, the potential for coal mine methane utilization (according to a methodology based on methane emissions [11] and coal reserves [6]), amounted to around 11.6-29.1 billion m³. Mexico has significant potential for the development of renewable energy (Table 2).
Table 2. Renewable energy resources of Mexico
| Resource/ Explanations | Solar Potential (GHI)* | Wind Potential (50 м)* | Hydro energy Potential** | Bio Potential (agricultural area) | Bio Potential (forest area) | Geothermal Potenial | Municipal Solid Waste |
|---|---|---|---|---|---|---|---|
| Value | 5.3-6.3 | 4.0-5.0 | 53 000 | 50 | 33.8 | 10 000 | 1.16 |
| Unit | kWh/m2/day | m/s | MW | % of land area | % of land area | MW | kg/per capita/day |
| Year | 2018 | 2018 | 2014 | 2020 | 2020 | 2014 | 2016 |
| Source | [12] | [13] | [16] | [14] | [15] | [16] | [17] |
* for the majority of the territory of the country
** economically exploitable hydropower potential
Due to its favorable geographical location, Mexico has significant potential for the development of solar energy. The most typical level of global horizontal irradiation is between 5.3-6.3 kW /m²/ day, though this figure can be exceeded in the central part of the country, in Puebla and Morelos states, and in the state of Baja California Sur [12].
Wind speed in most parts of Mexico does not exceed 4.0-5.0 m/s, however in Pacific coastal areas, in the state of Oaxaca, it can reach over 8.0 m/s [13].
33.8% of Mexico is forested with around 50% covered by agricultural land [14, 15]. This resource has the potential to play a significant role in energy production.
According to the Secretaria de Energia, hydropower potential in 2014 was 53 GW, and the geothermal energy potential was 10 GW [16].The volume of municipal waste corresponds to the level of other developed countries — 1.16 kg/year/per capita, however, this figure is almost two times lower than in the United States [17].
Energy Balance
According to BP's report, total primary energy consumption in Mexico in 2021 amounted to 6.79 exajoules: around 38% of which was from oil; 47% from natural gas; 3.4% from coal; 1.6% from nuclear power; 4.9% from hydropower; and 5.7% from renewable energy [6].
In 2020, Balanсe Nacional de Energia [18] reported that the total primary energy production in Mexico was 6,784.70 PJ: of this, the total share of crude oil was 56.3%; gas and condensate – 27.7%; coal – 2.8%; renewable energy resources, including hydropower – 11.2%; and nuclear power – 1.8%. This imbalance between production and consumption is accounted for by both the export of coal, and through intensive expansion of natural gas exports (Fig. 2).
Mexico is the fourth largest oil producer in America after the U.S., Canada and Brazil [19]. Oil production has decreased annually since 2008, and in 2021 it was 1.924 million barrels / day [20]. In [6], the production of oil in Mexico was reported at 1 928 thousand barrels / day in 2021. According to the Secretaria de Energia, production of all types of oil between 2016 and 2017 decreased by an average of 9.5%, amounting to 1 950 thousand barrels /day in 2017 [7].
The volume of oil consumption has remained practically unchanged during the last decade (Fig. 2), totalling 1 350 thousand barrels / day in 2021 [6]. According to the Secretaria de Energia, the volume of oil exports from Mexico in 2017 decreased by 2.6% compared to the previous year, amounting to 1 174 thousand b / d [7].
In 2019, the country exported 1.3 million b/d, mainly to the U.S.; however, the volume of exports, as well as Mexico’s share in U.S. imports, are declining [7,19].
Internal gas production in 2021 was 844 bcf, demonstrating a decline, compared to the previous year [20]. In 2021, according to [6], gas production amounted to 29.2 billion m3, and according to [3] – 27.03 bcm in 2019.
Gas consumption in Mexico has been growing since 2001, due to an ever-increasing demand and increased capacity of the electric power industry; and within a period of 20 years has increased from 1 494 to 3 033 billion cubic feet by 2021 [20]. In 2021, this figure was 88.2 billion cubic meters, which is 5.7% more than in the previous year [6].
Source: U.S. Energy Information Administration (Dec 2021) / https://www.eia.gov
Figure 2. The production and consumption of fossil fuels in Mexico (coal – left, gas – in the center, oil – right)
Mexico imports gas primarily from the USA (5.5 Bcf / day in 2019) through pipelines [19]. The country receives liquefied natural gas from the USA, Qatar, Nigeria and Peru [19].
PEMEX is developing the production of shale gas and light-weight oil, but this process is complicated by a lack of necessary financing, as well as the lack of high-tech equipment [21]. In 2019 the volume of gas imports reached 59.11 Bcm [3].
Coal production in Mexico reached its peak in 2011 (21.52 million short tons), with consumption at 28.43 million short tons; in 2021 production and consumption were 8,203 million short tons and 9,079 million short tons, respectively [20]. According to Balanse Nacional de Energia 2017, coal consumption in 2017 totalled 23 097 million tons, with 10 404 million tons of imports and domestic production at 12 982.59 million tons [16]. Historically, Mexico has a high share of fossil fuels in electricity production (Fig. 3).
According to the U.S. Energy Information Administration, Mexican public power producers generated around 310.05 TWh of electricity in 2020, of which 74.6% was from fossil fuels, 7.5% from hydropower, 3.5% from nuclear energy, and 14.4% from other renewable sources (Fig.7) [22].
Source: U.S. Energy Information Administration (Dec 2021) / https://www.eia.gov | ||
| Figure 3. Electricity production in Mexico |
Mexico’s position in the comparative diagram of energy index is shown in Fig. 4.
As mentioned previously, Mexico has a powerful potential of traditional fossil resources, which provides a high level of associated indices. However, while having a relatively high production-consumption ratio for crude oil, the country simultaneously shows extremely low indicators for the production-consumption ratio for natural gas and coal. GDP per unit of energy use is above the world average.
| Sources: 1. Crude oil proved reserves, 2021 / International Energy Statistic/Geography / U.S. Energy Information Administration (Nov 2021)*98 2. Natural gas proved reserves 2021 / International Energy Statistic / Geography / U.S. Energy Information Administration (Nov 2021) *99 3. Total recoverable coal reserves 2019 / International Energy Statistic / Geography / U.S. Energy Information Administration (Nov 2021) *81 4. Combination production-consumption for Crude oil 2018 / International Energy Statistic / Geography / U.S. Energy Information Administration (Nov 2021) *219 5. Combination production-consumption for Natural gas 2019 / International Energy Statistic / Geography / U.S. Energy Information Administration (Nov 2021) *123 6. Combination production-consumption for Coal 2019 / International Energy Statistic / Geography / U.S. Energy Information Administration (Nov 2021) *128 7. Electricity – from other renewable sources (% of total installed capacity), 2017 est. / The World Factbook / Library / Central Intelligence Agency *170 8. GDP per unit of energy use (PPP per unit of oil equivalent), 2020 *66 Primary energy consumption - BP Statistical Review of World Energy 2021/BP;GDP (purchasing power parity) - The World Factbook/Library/Central Intelligence Agency 9. Energy use (primary energy use of oil equivalent per capita) 2020 *127 Primary energy consumption – BP Statistical Review of World Energy 2021; Population - United Nations, Department of Economic and Social Affairs, Population Division (2019). World Population Prospects 2019, custom data acquired via website. Retrieved 15 November 2021*66 10. The Global Energy Architecture Performance Index Report (EAPI) 2017 / Rankings / Reports / World Economic Forum 11. Electric power consumption (kWh per capita), 2016 *217 Electricity Consumption - The World Factbook / Library / Central Intelligence Agency; Population - United Nations, Department of Economic and Social Affairs, Population Division (2019). World Population Prospects 2019, custom data acquired via website. Retrieved 15 November 2021 12. Combination of electricity production-consumption (kWh)/The World Factbook/Library/Central Intelligence Agency *216 * Total number of countries participating in ranking Figure 4. Energy indices of Mexico |
The share of renewable energy in electricity production in Mexico is less than 5%, according to the Central Intelligence Agency; the country ranked 81st out of 170 countries selected for consideration in 2017.
In the Energy Architecture Performance Index 2017, which is based primarily on the level of economic growth, environmental safety, and energy independence of the country, including access to energy, Mexico gained 5 ranking positions over the previous year, and is 44th in the world.
Mexico is in the top half of the ranked list of countries for such indicators as GDP per unit of energy use in 2020 – 14th out of 66 countries considered, while energy consumption per capita is much lower – 54th out of 66 countries. In terms of electricity consumption per capita, the country is 107th in the world, however, for combined electricity production-consumption, Mexico is 11th in the ranked list of 216 countries.
Thus, according to the information provided, Mexico not only possesses significant reserves of traditional mineral resources, but also significant reserves of unconventional fossil resources and a powerful potential for renewable energy development.
Energy Infrastructure
Fossil fuel extraction is carried out along the Mexican Gulf, where the main oil, natural and shale gas deposits are located. The energy infrastructure is also concentrated along the coast, in close proximity to the fields (Fig. 5). The main offshore oil field is Litoral de Tabasco; production from this field was at the level of 300 000 barrels/day in 2013 [23]. Oil extracted from onshore fields accounts for approximately one quarter of total crude oil production in Mexico, but is of a higher quality. The largest onshore field is Samaria-Luna, which produced around 145 thousand barrels/day in 2015 [19]. The main natural gas field is Burgos Basin, and in 2010 the extraction from this field was 1.6 Bcf / day [24].
Coal extraction fields are located in the north-east of the country. The largest are MICARE and MIMOSA, located in the state of Coahuila, which produces a total of 11 million tons annually [25].
In the south of the country there are six large oil terminals. The refining industry of Mexico is represented by 6 large refineries, the largest is Miguel Hidalgo (Tula) with an installed capacity of 300 thousand barrels/day [26]. In 2018 six PEMEX refineries had desulfurization facilities with a total capacity of 1 615 thousand barrels/day [7].
Figure 5. Basic infrastructure facilities of the fossil fuel sector in Mexico
The largest in terms of installed capacity in 2018 was Dos Bocas, which produced approximately 191 thousand barrels/day. The aforementioned Tula has a capacity of 142 thousand barrels/day [7]. The Mexican oil industry is dominated by Pemex, Mexico’s largest company. Pemex manages a well-developed network of oil pipelines linking the main fields with oil refineries and export terminals: crude oil pipelines with a total length of 8 775 km; oil pipelines for the transportation of petroleum products with a length of 7 565 km; and 2 102 km of liquefied petroleum gas pipelines (Fig. 5). The natural gas infrastructure is represented by three LNG import terminals, several natural gas processing plants, and a pipeline system more than 18 000 km long (Fig. 5). The largest terminal - Costa Azul LNG Terminal - has a capacity of 7.6 million tons per year [27]. Cactus, the largest natural gas processing plant, has an installed capacity of 1702 MCf / day [28].
A map showing the territorial distribution of the largest unconventional fossil fuel infrastructure facilities in Mexico is shown in Fig. 6
Figure 6. Energy infrastructure in Mexico: unconventional fossil fuels
The most prevalent unconventional fossil resource of Mexico is shale gas, the largest deposits of which are located in the east of the country. The country’s deposits of super heavy oil belong to the state-owned company Pemex; the largest deposit is Ku-Maloob-Zaap (KMZ), with an extraction rate 853 thousand barrels/day in 2010 [29]. In the south-east of the country, accumulations of gas hydrates have been confirmed. Mexico's electricity production predominantly relies on fossil fuels; gas, oil and coal-fired power plants can be found in Figure 7.
The largest power plants are: oil - Pdte Adolfo Lopez Mateos (Tuxpan) (2 100 MW); coal – Petacalco (Plutarco Elías Calles) (2 778 MW); and combined cycle – Tula (Francisco Pérez Ríos) (489 MW). Nuclear power is represented by the Laguna Verde station, with a capacity of 1 400 MW [30]. Mexico also has a number of large hydroelectric power plants with a capacity of more than 400 MW each, the largest of them is Manuel Morreno Torres Chicoasen, with an installed capacity of 2 400 MW [30]. The total installed capacity of all hydroelectric power plants is 12 429 MW [30].
Figure 7. Electricity production in Mexico
In Figure 8, you can see the main facilities of the Mexican infrastructure for the production of energy from renewable sources.
Renewable energy in Mexico, excluding hydropower, does not have a significant share in total electricity generation. The total electricity production from renewable sources in 2020, excluding hydropower, was 44.81 TWh (Fig. 8). Mexico's geographic location would allow for the successful development of concentrated and photovoltaic solar energy. However, this resource has not been actively commercialized.
Solar energy in Mexico is represented by both photovoltaic stations and stations of concentrated solar energy of parabolic type. The largest of the latter type is Agua Prieta II, with a capacity of 14 MW [31]. Acciona is involved in the development of a number of wind power plants in the country; among the company's major projects is the construction of stations in Oaxaca and Ventika I II, with a capacity of 405 MW and 252 MW, respectively [32,33]. Bioenergy is being actively developed in Mexico and in 2019 biomass generated around 3.0 TWh (Fig. 8). The country has biomass processing plants, biogas production plants, biodiesel plants, first generation bioethanol plants, second generation bioethanol plants, pellets and landfill gas plants.
Figure 8. Renewable energy in Mexico
Grupo Azucarero del Tropico owns the largest biomass processing plant - Ingenio La Gloria - with an installed capacity of more than 52.5 MW [34]. Monterrey's landfill gas production facility has an installed capacity of 12 MW, providing around 7 municipalities in the Monterrey region with electricity [35].
The company Fabrica de Alimentos Tenerife y Destiladora de Papalopan produces around 250 million tons of bioethanol annually at the country's largest enterprise – Orizaba [36]. The largest enterprise producing biodiesel in the country is Ricino Mex, which produces around 21 tons of fuel per day [37]. According to data from 2016, Mexico is ranked fourth in the world, after the United States, the Philippines and Indonesia, by installed capacity of geothermal power plants, rated at 1 058 MW [38]. The largest stations are Cerro Pietro II and Cerro Pietro III and have an installed capacity of 220 MW each [39].
The main goals of the energy strategy of Mexico are to increase the country's energy efficiency, attract foreign investment for the development of energy in the regions, and to increase the share of natural gas and renewable energy sources in electricity generation [40]. Within the framework of Prospectiva de Energias Renovables 2015-2029, the country plans to increase the country's renewable energy complex capacity by 20 950 MW, through wind farms (11 952 MW), hydroelectric plants (5 450 MW), solar stations (1 822 MW), geothermal stations (1 618 MW) and biomass power plants (108 MW) [41]. The construction of gas pipelines in Mexico presents an attractive investment opportunity for a number of large global companies. The Canadian Trans Canada organization has become one of the biggest players in Mexico since the opening of domestic oil markets for foreign companies.
As of 2022, the company operates a 93,300 km network of natural gas pipelines. In addition, Trans Canada expects to complete its first Canadian solar power project in 2023 with the capacity of 81 megawatts. A number of projects are also being developed to connect gas fields with power plants, for example, Sur de Texas – Tuxpan, as well as power plants with Tuxpan-Tula consumers. In total, the company has shares in 9 projects [42,47]. Mexico is also among the 20 world leaders in the volume of associated petroleum gas combustion. The independent Mexican oil and gas company Petrolera Perseus S.A. De C.V. (Perseus) and American Greyrock Energy Inc. announced cooperation in this field. Using Direct Fuel Production™ technology and the Flare-to-Fuels system, Greyrock plans to process combustible gas into clean and transportable types of fuel [45]. Cooperation between Mexico and America is also evident in the field of extraction of unconventional hydrocarbons. The Mexican fund EIM Capita and the American AEP plan joint exploration of the Burgos deposit [46].
Education and Innovation
The set of indices reflecting the position of Mexico among other countries in the field of education and innovation can be seen in Figure 9. Mexico demonstrates high results for the majority of indicators. In the Global Innovation Index, Mexico was 55th in 2021, ahead of Uruguay and Colombia.
According to the number of patents granted to Mexican nationals, both domestically and abroad, the country ranks 39th in the world. Similarly, by the number of patents in force, the country was 19th in the world, indicating the country's favourable conditions for innovation.
Mexico is well positioned when considering the number of publications of specialists in scientific and technological journals – 23rd place out of 197 countries considered. It also places highly in the Scimago Journal and Country Rank (28th place). In terms of government expenditure on education as a percentage of the country's GDP, the country demonstrates a result close to the world average – 65th out of 177 countries selected for consideration. Nevertheless, 24 Mexican universities are included in the QS University Rating. In terms of government expenditure on research and development as a percentage of GDP, the country ranks 65th in the world, behind Cuba and Argentina.
Universidad Autonoma del Carmen and Universidad de Guanajuato are actively involved in research in the field of associated petroleum gas. GeoEstratos, S.A. DeC.V. and Instituto Mexicano del Petroleo (IMP) are among the leaders of patenting among Mexican companies in the field of extraction and processing of unconventional oil. Studies in this field and in the field have been conducted by Instituto Mexicano del Petróleo (IMP), Pemex E&P and Universidad Nacional Autonoma de Mexico (UNAM).
| Sources: 1. The Global Innovation Index 2021, Rankings / Knowledge / World Intellectual Property Organization / Cornell University, INSEAD, and WIPO (2021): Energizing the World with Innovation. Ithaca, Fontainebleau, and Geneva *132 2. Patent Grants 2011-2020, resident & abroad / Statistical country profiles / World Intellectual Property Organization *185 3.Patents in Force 2020 / Statistical country profiles / World Intellectual Property Organization *109 4. QS World University Rankings 2022 *97 5. SCImago Country Rankings (1996-2020) / Country rankings / SCImago, (n.d.). SIR-SCImago Journal & Country Rank [Portal]. Retrieved 17 Nov 2021 *240 6. Internet users in 2018 / The World Factbook / Central Intelligence Agency *229 7. Internet users in 2018 (% Population) / The World Factbook / Central Intelligence Agency *229 8. Government expenditure on education, total (% of GDP), 2019 / United Nations Educational, Scientific, and Cultural Organization (UNESCO) Institute for Statistics. License: CCBY-4.0 / Data as of September 2021*177 9. Research and development expenditure (% of GDP), 2018 / UNESCO Institute for Statistics. License: CCBY-4.0 / Data *119 10. Scientific and technical journal articles, 2018 / National Science Foundation, Science and Engineering Indicators. License: CCBY-4.0 / Data *197 * Total number of countries participating in ranking Figure 9. The indices of education and innovation in Mexico |
Research on gas hydrates is carried out by research organizations such as Centro de Investigacion Cientifica y de Educación Superior de Ensenada, CIIDIR-IPN Unidad Sinaloa.
Pemex and Universidad Michoacana de San Nicolas de Hidalgo are engaged in research in the field of non-traditional oil production, including directional drilling and hydro-cracking.
In the field of synthetic fuel development, Instituto Tecnologico de Celaya, Universidad de Guanajuato, Instituto Technologico y de Estudios Superiores de Monterrey, Universidad Michoacana de San Nicolas de Hidalgo are the leading research institutions. The leading patent holders in the field of bioenergy is Universidad Nacional Autonoma de Mexico (UNAM). Research and development in this field is also being carried out by Instituto Tecnologico y de de Estudios Superiores de Monterrey.
A large number of Mexican universities conduct research in the field of energy production from renewable sources. In the field of wind energy — Instituto Tecnologico y de de Estudios Superiores de Monterrey, Universidad Michoacana de San Nicolas de Hidalgo, Universidad Nacional Autonoma de Mexico (UNAM). The main patent-holders in the field of solar energy are Universidad Nacional Autonoma de Mexico (UNAM), Vitro, S.A.B. de C.V.; Cortina Innovations, Universidad Autonoma del Estado de Mexico. Universidad Nacional Autonoma de Mexico (UNAM)., Universidad de Sonora and Universidad Autonoma de Baja California have the largest number of scientific publications in this field.
According to Advanced Energy Technologies, in Mexico 15 universities train specialists in the field of energy. The leading university is the Universidad Nacional Autónoma de México (UNAM)/National Autonomous University of Mexico, which offers such programs as Renewable Energy Engineering, Geological Engineering, Mechanical Engineering, Petroleum Engineering.
In Mexico, the research institutes specializing in the field of oil industry are Instituto Mexicano del Petroleo, and in renewable energy – Instituto Nacional de Electricidad y Energías Limpias.
Ecology and Environment Protection
A diagram of environmental indices is shown in Figure 10. The ecological situation in Mexico is relatively inauspicious; most of the indicators are located in the lower part of the chart.
Mexico has a high level of methane emissions and CO2 emissions, both in general and per capita. There are no positive trends in forest area change, and, in terms of the ecological footprint on a global scale, Mexico is a debtor, demonstrating one of the lowest indicators among American countries.
| Sources: 1. CO2 total emission by countries 2020 / European Commission / Joint Research Centre (JRC) / Emission Database for Global Atmospheric Research (EDGAR)*208 2. CO2 per capita emission 2020/European Commission/Joint Research Centre (JRC) / Emission Database for Global Atmospheric Research (EDGAR) *208 3. Forest area 2020 (% of land area) / The Global Forest Resources Assessment 2020 / Food and Agriculture Organization of the United Nations *234 4. Forest area change 2010-2020 (1000 ha/year) / The Global Forest Resources Assessment 2020 / Food and Agriculture Organization of the United Nations *234 5. The Environmental Performance Index (EPI) 2020 / Rankings / Yale Center for Environmental Law & Policy / Yale University *180 6. Annual freshwater withdrawals (m3 per capita), 2017 *179 Annual freshwater withdrawals, total (billion m3), 2017 – Food and Agriculture Organization, AQUASTAT data. /License: CC BY-4.0; Population – United Nations, Department of Economic and Social Affairs, Population Division (2019). World Population Prospects 2019, custom data acquired via website. Retrieved 15 November 2021 7. The National Footprint Accounts 2017 (Biocapacity Credit / Deficit) / Global Footprint Network *188 8. Methane emissions (kt of CO2 equivalent), 2018 / Data for up to 1990 are sourced from Carbon Dioxide Information Analysis Center, Environmental Sciences Division, Oak Ridge National Laboratory, Tennessee, United States. Data from 1990 are CAIT data: Climate Watch. 2020. GHG Emissions. Washington, DC: World Resources Institute. Available at: License : Attribution-NonCommercial 4.0 International (CC BY-NC 4.0) *191 9. The Climate Change Performance Index (CCPI) 2022 / Overall Results / Jan Burck, Thea Uhlich, Christoph Bals, Niklas Höhne, Leonardo Nascimento / Germanwatch, NewClimate Institute & Climate Action Network *60 * Total number of countries participating in ranking Figure 10. Environmental Indices of Mexico |
Mexico does, however, have a relatively high valuation in the Environmental Performance Index rankings (EPI) 2020, which focuses primarily on assessing the environmental performance of national governments. In this rating Mexico is inferior to Brazil, placing 51st out of 180 member countries but demonstrates a positive trend. According to The Environmental Vulnerability Index, which is based on years of observations and 50 indicators, which include for example, changing climatic characteristics or the quality of water resources, waste volumes, oil spills and other hazardous substances, etc. Mexico is 124th, and is characterized as "vulnerable".
Mexico is among the top twenty countries with the highest rate of associated petroleum gas emissions. In this regard, there are a number of enterprises helping to reduce associated gas emissions. These include projects for the reinjection of gas into the wells – offshore in the Cantarell field and onshore in Veracruz, on the territory of Tres Hermanos.
References
[1] List of sovereign states and dependencies by area / Wikipedia / https://en.wikipedia.org/wiki/List_of_sovereign_states_and_dependencies_by_area
[2] List of countries and dependencies by population density / Wikipedia / https://en.wikipedia.org/wiki/List_of_countries_and_dependencies_by_population_density
[3] Mexico / The world factbook / Library / Central Intelligence Agency / https://www.cia.gov/
[4] GDP, PPP (constant 2011 international $) / World Bank, International Comparison Program database. License : CC BY-4.0 / Data / The World Bank / http://www.worldbank.org/
[5] GDP per capita, PPP (current international $)/ World Bank, International Comparison Program database .License : CC BY-4.0 / Data / The World Bank / http://www.worldbank.org/
[6] BP Statistical Review of World Energy 2019 - 2022 (PDF) / BP / https://www.bp.com/
[7] Prospectiva de Petroleo Crudo y Petroliferos 2018-2032 (PDF) / Secretaria de Energia / SENER / http://base.energia.gob.mx/
[8] World Shale Resource Assessments / U.S. Energy Information Administration (September 24, 2015) / https://www.eia.gov/
[9] 2010 Survey of Energy Resources (PDF) / World Energy Council / www.worldenergy.org/
[10] Evaluación de las reservas de hidrocarburos 1 de enero de 2018 (PDF) / Pemex / http://www.pemex.com/
[11] 2006 IPCC Guidelines for National Greenhouse Gas Inventories, Volume 2, Energy, Fugitive Emissions (PDF) / The Intergovernmental Panel on Climate Change (IPCC) / https://www.ipcc-nggip.iges.or.jp/
[12] Solar resource data obtained from the Global Solar Atlas, owned by the World Bank Group and provided by Solargis / Global Solar Athlas / http://globalsolaratlas.info/
[13] Wind Map / Global Wind Atlas 2.0, a free, web-based application developed, owned and operated by the Technical University of Denmark (DTU) in partnership with the World Bank Group, utilizing data provided by Vortex, with funding provided by the Energy Sector Management Assistance Program (ESMAP). For additional information: https://globalwindatlas.info
[14] Agricultural land (% of land area) / Food and Agriculture Organization, electronic files and web site. License: CC BY-4.0 / Data / The World Bank / http://www.worldbank.org
[15] Forest area (% of land area) /Food and Agriculture Organization, electronic files and web site. License: CC BY-4.0 / Data / The World Bank / http://www.worldbank.org/
[16] Energías Renovables 2015 (PDF) / Gobierno de Mexico / http://www.gob.mx/
[17] World Bank What a Waste / Data / The World Bank / http://www.worldbank.org
[18] Balanсe Nacional de Energia 2020 (PDF) / Gobierno de Mexico / http://www.gob.mx/
[19] Mexico / Geography / U.S. Energy Information Administration (November 30, 2020) /http://www.eia.gov/beta/international/
[20] International Energy Statistic / Geography / U.S. Energy Information Administration /http://www.eia.gov/beta/international/
[21] Mexico Oil and Gas Profile / A Barrel Full / http://abarrelfull.wikidot.com/
[22] Sistema de Información Energética Sector Eléctrico Generación bruta de energía por tecnología (megawatts-hora) / SENER / http://sie.energia.gob.mx/
[23] Pemex construira diez plataformas / 07 October 2013 / El Universal / http://www.eluniversal.com.mx/
[24] Burgos Natural Gas Plant, Gulf of Mexico, Mexico / Hydrocarbons Technology / http://www.hydrocarbons-technology.com/
[25] Unidad MICARE and Unidad MIMOSA / Minera del Norte (MINOSA) / Altos Hornos de Mexico (AHMSA) / http://www.ahmsa.com/
[26] Miguel Hidalgo (Tula) / Pemex Refinacion / http://www.ref.pemex.com/
[27] About us / Energia Costa Azul / http://www.energiacostaazul.com.mx/english/
[28] Complejos procesador de gas Cactus / Pemex Gas y Petroquimica Basica / http://www.gas.pemex.com/
[29] KMZ / International Petroleum Encyclopedia 2010 / International Petroleum Encyclopedia 2010, book, page 115 / www.google.com
[30] Systema Electrica National / Gobierno de Mexico / http://www.gob.mx/
[31] Concentrated Solar Power Plant Agua Prieta II / Renewable Energy / Engineering and industrial construction / Abengoa / http://www.abengoa.com.mx/web/en/index.html
[32] Panorama General de la Energía Eólica en México (2010) (PDF) / Asociacion Mexicana de EnergiaEolica (AMDEE) / http://www.amdee.org/
[33] Ventika Wind Farm, Mexico / Power Technology / http://www.power-technology.com/
[34] Ingenio La Gloria / Nuestros Ingenios / Grupo Azucarero del Tropico / http://www.gat.com.mx/
[35] Mexico’s President Applauds Monterrey’s Landfill Gas Plant as Model Renewable Energy Project for Latin America / September 17, 2008 / General Electric Newsroom / http://www.genewsroom.com/
[36] Orizaba, cuna de los energeticos; se producen 350 mil litros de etanol diarios en Oxifuel / 15/05/2015 / Al Calor Politico / https://www.alcalorpolitico.com/
[37] Inaugura Sagarpa planta de biodiesel Ricino Mex en Oaxaca / 15 Feb 2017 / Noticias MVS / http://www.noticiasmvs.com/
[38] Will 2016 be the year of geothermal energy in Mexico? / 6 Jan 2016 / Alexander Richter / Think Geoenergy / http://www.thinkgeoenergy.com/
[39] Prospectiva de Energias Renovables 2017-2031 by Secretaria de Energia (2016) (PDF) / Gobierno de Mexico / http://www.gob.mx/
[40] Estrategia Nacional de Energía 2013-2027 / Gobierno de Mexico / http://www.gob.mx/
[42] Energético Sustentable Guía Hacia Un Futuro Para Las Américas (PDF) / Ianas / http://www.ianas.org/
[43] Trans Canada in Mexico / Trans Canada / http://www.transcanada.com/
[44] México invertirá 5.000 millones de dólares en proyectos solares hasta 2020 / 16 Jul 2016 / El Periódico de la Energía / http://elperiodicodelaenergia.com/
[44] México agregará 6,3 GW eólicos y 5,4 GW fotovoltaicos en tres años / 02 Jan 2017 / Mexico to add 6.3 GW wind and 5.4 GW photovoltaic in three years / El Periódico de la Energía / http://elperiodicodelaenergia.com/
[45] Perseus, Greyrock to monetize Mexico flare gas / May 2016 / Hydrocarbon Processing / http://www.hydrocarbonprocessing.com/
[46] American Energy Partners, EIM Capital form partnership for shale exploration in Mexico's Burgos basin / Dec 1st, 2015 / Oil and Gas Journal / http://www.ogj.com/
[47] TC Energy / https://www.tcenergy.com/
The sources of charts and curves are specified under the images.
For more information about the energy industry in Mexico see here