
Contents
General State of the Economy
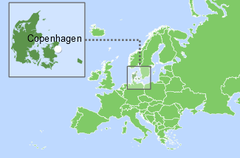
Denmark, officially the Kingdom of Denmark, is located in Northern Europe. Its capital city is Copenhagen. Neighboring countries are Norway (to the north), Germany (to the south), and Sweden (to the south-east). The country has access to the Baltic Sea and the North Sea.
Denmark is the 133rd largest country in the world in terms of area and, as of 2022, is home to around 5.9 million people. The country ranks 93rd in the world by population density [1,2,3]. The total length of the coastline is 7,314 km [3]. Denmark’s political form of government is constitutional monarchy and the official language is Danish [3]. The administrative map of Denmark is divided into 5 regions.
Denmark has a balanced modern market economy, which is reflected in Figure 1. By almost every indicator in the presented diagram, Denmark places in the top 25% of the leading countries in the world included in the rating.
| Sources: 1. GDP (purchasing power parity), 2020 est. / The World Factbook/Library/Central Intelligence Agency *228 2. GDP - per capita (PPP), 2020 / The World Factbook/Library/Central Intelligence Agency *229 3. Inflation rate (consumer prices), 2019 est. / The World Factbook/Library/Central Intelligence Agency *228 4. Charges for the use of intellectual property, receipts (BoP, current US$), 2020 / International Monetary Fund, Balance of Payments Statistics Yearbook, and data files. / License: CC BY-4.0 *88 5. The Global Competitiveness Index 2019 / Rankings / Reports / World Economic Forum *141 6. High-technology exports (current US$) 2019-2020 / United Nations, Comtrade database through the WITS platform / License: CCBY-4.0 / Data *134 7. 2021 Index of Economic Freedom / International Economies / The Heritage Foundation *178 8. Reserves of foreign exchange and gold, 2017 est. / The World Factbook / Library / Central Intelligence Agency *195 9. Annual average GDP growth in %, for the last 10 years (2011-2020) / World Bank national accounts data, and OECD National Accounts data files / License: CC BY-4.0 *206 10. Public debt (% of GDP), 2017 est. / The World Factbook / Library / Central Intelligence Agency (from smallest to largest) *210 * Total number of countries participating in ranking Figure 1. Economic Indices of Denmark |
From the early 1990s the country has experienced sustained GDP growth at purchasing power parity, both in general and per capita [4,5]. GDP at purchasing power parity increased from $276 billion in 2015 to $326.2 billion (53rd in the world) in 2020 [3]. GDP at purchasing power parity per capita is somewhat higher (20th in 2020 2017). The dynamics of this indicator is also positive: from $48,800 in 2015 to 55,900 in 2020 [3]. The inflation rate changed from 1.1% 2017 to 0.7% in 2019. By this indicator the country places 52nd out of 228 countries. ranked from low to high, however this does not always correspond to the real state of the economy [3].
According to The Global Competitiveness Report 2019, presented by the World Economic Forum, Denmark is 10th out of a total of 141 countries studied, slightly behind ahead of Finland and Norway. This rating reflects the effectiveness of the use of the country’s own resources for sustainable development. In addition to a number of economic indicators this index also takes into account such variables as education, health, level of innovation, etc. In terms of high-technology exports in the year 2019-2020 (from an estimated total of 134 countries), Denmark was 30th, higher than the world average. According to the Index of Economic Freedom, which takes into account business freedom, freedom from government intervention, protection of property, and freedom from corruption, Denmark was 10th in 2021 out of 178 countries. In terms of reserves of foreign exchange and gold, Denmark was 30th in 2017, behind, for example, the Czech Republic, but ahead of Sweden and Norway.
According to the indicator for the average GDP growth in percentage over the last 10 years (2011-2020), in 2020 the country was 140th out of 206 countries. In terms of public debt, calculated as a percentage of the country's GDP, Denmark was ranked 151st out of 210 countries considered in 2017.
Energy resources
Denmark does not have significant reserves of fossil resources (Table 1). According to [3] in terms of oil and gas reserves the country places low on the global comparative list (46th and 77th, respectively). According to the BP Statistical Review of World Energy 2021 [6] in 2020, proven oil reserves were 400 million barrels, and according to [3] at the beginning of 2018 they were estimated to be at 439 million barrels. According to data from the Danish Energy Agency, as of January 1, 2018, total oil reserves in the country were estimated at 139 million m³, 68 million m³ of which were under ongoing recovery and approved for development [7]. The proven reserves of natural gas in Denmark at the end of 2020 according to BP[6] were 1 Tcf, and about 12.86 Bcm at the beginning of 2018 [3]. According to the Danish Energy Agency, as of January 1, 2018, the country's total natural gas reserves were 72 billion Nm³ [9]. Denmark also has the second largest shale gas reserves in Western Europe – 31.7 Tcf [8].
Table 1. Fossil energy resources of Denmark
| Resource /Explanations | Crude oil* | Natural gas* | Coal | Shale Gas* | Tight Oil* | Coal mine methane | Oil Shale |
|---|---|---|---|---|---|---|---|
| Value | 439 | 12.86 | no data | 31.7 | no data | no data | no data |
| Unit | million barrels | Bcm | - | Tcf | - | - | - |
| Year | 2018 | 2018 | - | 2013 | - | - | - |
| Source | [3] | [3] | - | [6] | - | - | - |
*ongoing recovery and approved for development
**unproved technically recoverable
Denmark has a variety of renewable sources for energy production, including a significant potential for wind energy. A selection of basic indicators of this type of resource is presented in Table 2.
Table 2. Renewable energy resources of Denmark
| Resource/ Explanations | Solar Potential (GHI)* | Wind Potential (50 м)* | Small Hydro energy Potential | Bio Potential (agricultural area) | Bio Potential (forest area) | Municipal Solid Waste |
|---|---|---|---|---|---|---|
| Value | 2.7–2.9 | 6.0–7.0 | 9.75 | 63.4 | 12.9 | 845 |
| Unit | kWh/m2/day | m/s | MW | % of land area | % of land area | kg per capita |
| Year | 2018 | 2018 | 2016 | 2018 | 2018 | 2020 |
| Source | [9] | [10] | [11] | [12] | [13] | [14] |
*for most of the territory of the country
The level of global horizontal irradiation for the majority of the country is low – between 2.7-2.9 kWh/m2/day, but can reach 2.9-3.1 kWh/m2/day in the south-eastern part of the country [9]. The distribution of wind resources is as follows: for the majority of the country, the wind is 6.0–7.0 m/s, and in the north-western part of the country and along the coastline with the North Sea, at a height of 50 m can reach over 8.7 m/s [10]. The potential of small hydropower in Denmark is 9.75 MW; the installed capacity of small hydropower is also 9.75 MW, which indicates this resource is being fully exploited for electricity production in the country [11]. 63.4% of Denmark is covered by agricultural land [12], while forest area accounts for only 12.9% of the country's territory [13].
In terms of municipal waste generation (845 kg per capita in 2020), Denmark is higher than in the Netherlands (535 kg per capita), and in Sweden (431 kg per capita) [14]. Municipal waste is a valuable raw material for recycling or energy production, which is actively used in Denmark, however long-term decomposing substances can significantly pollute the environment.
Energy Balance
Oil production between 2001-2020 decreased more than 2 times reaching a level of 106 thousand barrels/day in 2020 [16]. BP estimated oil production at 72 thousand barrels/day in 2020 [6]. According to the Danish Energy Agency, oil production in 2018 is projected to be 7.4 million m3 [7]. The volume of oil consumption in the country since 2008 also showed a decline (Fig.2), but a significantly smaller one, and in 2020 amounted to 137 thousand barrels/day [16]. Oil imports to Denmark in 2017 amounted to 98,240 barrels/day, and exports - 82,980 barrels/day [3].
Natural gas consumption in Denmark gradually declined between 2001-2020 and in 2020 reached a level of 77 Bcf [16]. BP’s Statistical Review of World Energy June 2021 [6] estimated production at 1.4 billion m3 in 2020. According to the Danish Energy Agency, gas production in 2018 [7] is expected to be 3.6 billion Nm3. According to [3], natural gas imports to Denmark in 2017 were 509.7 million m3, with exports of 2.237 billion m3. The consumption of imported coal in the country has been gradually decreasing since 2006, with small fluctuations, and in 2017 it was 2.92 and 1.36 million short tons in 2020 million short tons [16].
Source: U.S. Energy Information Administration (Dec 2021) / www.eia.gov
Figure 2. The production and consumption of fossil fuels in Denmark (coal – left, gas – in the center, oil – right)
In recent years, Denmark has a high share of renewable resources in electricity production (Fig. 3).
According to the U.S. Energy Information Administration, electricity production reached 28.46 TWh in 2020, dominated by renewable energy – slightly more than 85%; the share of fossil fuels was about 15% (Fig.6).
According to [17] the import of electricity into Denmark in 2018 exceeded its exports by more than 1.5 times.
Sources: U.S. Energy Information Administration (Dec 2021) / www.eia.gov | ||
| Figure 3. Electricity generation in Denmark |
Denmark’s position in the comparative diagram of energy index is shown in Figure 4. Despite the relatively small amount of fossil energy resources in Denmark, the country is among the world leaders in terms of the ratio of production and consumption of oil and gas, since it fully meets its own domestic needs. In terms of the share of electricity production from renewable energy sources (excluding hydropower), Denmark is second only to Luxembourg among the 170 countries selected for consideration.
Denmark is ranked 4th, behind Switzerland, Norway and Sweden in the EAPI of 2017 (Energy Architecture Performance Index), which is based principally on the level of economic growth, environmental safety, and energy independence of the country, including access to energy.
| Sources: 1. Crude oil proved reserves, 2021 / International Energy Statistic/Geography / U.S. Energy Information Administration (Nov 2021)*98 2. Natural gas proved reserves 2021 / International Energy Statistic / Geography / U.S. Energy Information Administration (Nov 2021) *99 3. Total recoverable coal reserves 2019 / International Energy Statistic / Geography / U.S. Energy Information Administration (Nov 2021) *81 4. Combination production-consumption for Crude oil 2018 / International Energy Statistic / Geography / U.S. Energy Information Administration (Nov 2021) *219 5. Combination production-consumption for Natural gas 2019 / International Energy Statistic / Geography / U.S. Energy Information Administration (Nov 2021) *123 6. Combination production-consumption for Coal 2019 / International Energy Statistic / Geography / U.S. Energy Information Administration (Nov 2021) *128 7. Electricity – from other renewable sources (% of total installed capacity), 2017 est. / The World Factbook / Library / Central Intelligence Agency *170 8. GDP per unit of energy use (PPP per unit of oil equivalent), 2020 *66 Primary energy consumption - BP Statistical Review of World Energy 2021/BP;GDP (purchasing power parity) - The World Factbook/Library/Central Intelligence Agency 9. Energy use (primary energy use of oil equivalent per capita) 2020 *127 Primary energy consumption – BP Statistical Review of World Energy 2021; Population - United Nations, Department of Economic and Social Affairs, Population Division (2019). World Population Prospects 2019, custom data acquired via website. Retrieved 15 November 2021*66 10. The Global Energy Architecture Performance Index Report (EAPI) 2017 / Rankings / Reports / World Economic Forum 11. Electric power consumption (kWh per capita), 2016 *217 Electricity Consumption - The World Factbook / Library / Central Intelligence Agency; Population - United Nations, Department of Economic and Social Affairs, Population Division (2019). World Population Prospects 2019, custom data acquired via website. Retrieved 15 November 2021 12. Combination of electricity production-consumption (kWh)/The World Factbook/Library/Central Intelligence Agency *216 * Total number of countries participating in ranking Figure 4. Energy indices of Denmark |
Over the last 8 years the country has gained 1 position in the rating.
In terms of electricity consumption per capita, the country is 48th in the world, however, for the indicator of combination of electricity production-consumption, Denmark is 205th in the ranked list of 216 countries.
Energy Infrastructure
A territorial map showing the distribution of the largest infrastructure projects of the fossil fuel sector in Denmark is shown in Figure 5.
The proven crude oil reserves account for 69.3% of the total energy potential of the country's mineral resources, with reserves of natural gas accounting for30.7% (Fig. 5).
Figure 5. Basic infrastructure facilities of the fossil fuel sector in Denmark
Danish oil and gas fields are located in the North Sea and are being developed by the main operators – DONG E & P A/S, Hess Denmark ApS and MærskOlieog Gas A/S. One of these fields is Hejre, which, according to DONG has a potential production of 44,000 barrels of oil equivalent/day (boe/day) [18,19]. The largest gas-condensate field is the Tyra Field, with proven reserves of 1.250 billion cubic feet and production levels of 237.8 million cubic feet per day [20]. Two oil refineries, Kalundborg (110,000 bpd) and Fredericia (68,000 bpd), conduct oil refining in Denmark; the operators are Statoil and Shell, respectively [21] (Fig. 5). One of the main oil terminals in Denmark is Stigsnaes (Kalundborg) with a total capacity of 406,000 m³ and a loading speed of up to 2,500 cubic metres per hour. Fredericia (800,000 m³) is the largest oil storage facility [22,23]. Transportation of crude oil and petroleum products is carried through pipelines with a total length of 330 km (Fig. 5). The Danish gas system is represented by two gas storage facilities, Lille Torup and Stenlille [24], and a gas processing plant Nybro [25]; gas is transported internally through a network of pipelines 1536 km long (Fig. 5).
As noted above, the unconventional gas fields in Denmark, according to the U.S. Energy Information Administration (EIA) may contain 31.7 Tcf of technically recoverable shale gas, as of 2013 [26].
The map of the territorial distribution of Denmark's largest infrastructure facilities for electricity generation is presented in Figure 6. According to the U.S. Energy Information Administration, in 2020 the share of fossil resources in electricity production in Denmark was 14.8% (Fig. 6).
The country has a significant number of stations for the production of electricity from fossil fuels, including power plants with a capacity of more than 100 MW, including one oil, two gas, five combined-type power plants and three coal-fired plants (Fig. 6).
Figure 6. Electricity production in Denmark
The largest power plants in Denmark are: Skaerbaek gas power plant, with a total capacity of 392 MW [27]; Kyndby oil power plant, with installed capacity of 676 MW, Avedore combined type power plant with installed capacity of 793 MW; and Asnaes coal power plant, with installed capacity 1,057 MW [28,29,30].
Hydropower in Denmark has a small share in electricity generation and is represented by small hydroelectric power plants, including Tange with installed capacity of 3.3 MW [31].
In Figure 7, you can see the main facilities of the Danish infrastructure for the production of energy from renewable sources. As noted above, renewable energy in Denmark plays an important role in electricity generation. The total production of electricity from renewable sources in 2019 was 23.08 TWh (Fig. 7). On the North Sea coast, as well as in offshore high wind activity zones, there are 10 large wind farms with a capacity of more than 60 MW, the Horns Rev III, which is a project under construction, and a large number of smaller ones. According to [32] in 2016 Denmark had the highest installed capacity per capita in the world — 5 526 MW. The largest of these is Anholt, with an installed capacity of 399.6 MW [33]. Denmark is the absolute world leader in the share of wind power in electricity generation. According to [17] in 2016, this ratio amounted to more than 40% of the total electricity production and more than 40% of the total volume of its consumption; the world average is around 3.5%. Danish Vestas is one of the ten largest manufacturers of wind turbines, and occupies more than 10% of the market. Over the first 8 months of 2017, according to the company's website [34], Vestas received orders for the installation of almost 1500 megawatts of wind power in the USA, about 500 megawatts in Argentina, about 600 megawatts in Germany, Mongolia, Thailand, China, Norway and many other countries. As mentioned previously, the level of solar radiation in some parts of the country can reach 3.5 kWh/m², which is low, but sufficient enough for the production of energy through photovoltaics [12]. As a result, there are a number of solar energy facilities, including five photovoltaic stations with a capacity of more than 1 MW each and 11 solar district heating plants (Fig. 7).
In 2015, Lerchenborg – the largest solar PV power plant in Scandinavia, with an installed capacity of 61 MW - was connected to the Danish electricity grid, providing electricity to around 30,000 households [35,36]. According to [37], almost 1 million square metres of thermal solar collectors with a total installation capacity of 656 mw were installed in Denmark. Silkeborg, the largest solar district heating plant, covers about 20% of the annual heating demand of the city, the peak generation of which is around 110 MW [38].
Figure 7. Renewable energy in Denmark: solar, wind and hydrogen
Denmark is actively developing hydrogen energy as a source of energy for vehicles. As of November 2017, 11 hydrogen fueling stations were in operation in the country (Figure 7). Figure 8 shows the main bio-energy facilities in Denmark for energy production. In 2020, the total installed bioenergy capacity was 2.13 GW (Fig. 8).
There are about 153 enterprises [39] in the country producing biogas, as well as enterprises for processing biomass and municipal waste and landfill gas; biodiesel, bioethanol, and pellet-producing companies (Fig. 8).
Denmark is one of the top 10 world leaders in terms of the share of biofuels in the production of heat and electricity, significantly exceeding the world average, and is among the top 10 world producers of syngas from biomass and municipal waste for the subsequent generation of electricity.
Figure 8. Renewable energy in Denmark: bioenergy
Affald Varme Aarhus manages the largest biomass Lisbjerg, with an installed capacity of more than 153 MW [40]. StigeOe Landfill Gas Plant generates about 2.94MW of electricity from landfill gas [41].
The second-generation bioethanol production plant Kalundborg Pomacle produces 5.4 million litres of fuel per year, which can be added to traditional gasoline [42].
The main Danish facilities in the field of bio energy are: Otterup Bio Diesel Plant, which can produce around 80,000 tons annually [43]; Skive Fjernvarme biomass gasification with an installed capacity of 32 MWth [44]; Køge Vattenfall Biopillefabrik, which produces 150,000 tons of pellets annually [44]; and Sønderjysk Biogas Bevtoft biogas plant that produces about 21 million m3 of biogas annually [45].
Denmark is known to make efficient use of various types of waste. Despite the fact that in terms of the share of thermal energy production from waste relative to the total production, Denmark ranks much lower than Switzerland - around 21% and 62%, respectively (although ahead of almost all other countries); the share of electricity production from waste is around 6% – the highest figure in the world [18]. The leaders in the generation of electricity from municipal waste is Amager Bakke (Copenhagen) with an installed capacity of 81 tons per hour, 26.6 MW [46]; the Sønder Stenderup torrefication plant produces about 10,000 tons of high-energy pellets per year; and two BtL-FT plants, the largest of which at Aalborg, produces 24 tons of biofuel a year [47,48].
The main priority of Denmark's energy policy is to increase the share of renewable energy in electricity generation to 100% by 2050. The short-term energy strategy until 2020 included the following objectives: increasing the share of wind energy in electricity production to 50%; reducing total energy consumption by 7.6% in relation to 2010; and reducing greenhouse gas emissions by 34%, in relation to 1990. Since 2013, the country's new buildings are not allowed to use oil and gas for heating the premises, and in turn the use of renewable energy sources for electricity and heating is fully supported by the state. Such state initiatives include active subsidies, feed-in tariffs, tenders for the construction of new facilities, and modernization of old ones. Another priority of the country's energy policy is taxation. According to the "Green Tax Package", adopted in 1996, industrial enterprises could be reimbursed energy and CO2 taxes if they made an agreement with the authorities on energy saving projects, as well as being able to apply for government subsidies and participate in projects for the development of renewable energy. From 2019 to 2020, consumption of bioethanol and biodiesel increased by 11.1%. In 2020, diesel oil (including biodiesel) accounted for 63.9% of total energy consumption for transport compared to 42.1% in 1990. Until 2020 electric car owners in Denmark were exempt from purchase tax and the annual owners’ tax [49]. After the state abandoned tax incentives for electric vehicles, their sales fell by about 60% [50]. In June 2017, the governments of the leading offshore wind energy markets – Germany, Belgium and Denmark, announced their intentions in their negotiations with the largest producers to increase the capacities of this energy sector to 4 GW per year by 2020. Winning bids of auctions in this field decreased by 48% compared to the price obtained in 2015 (and the target of €100/MWh planned for 2020 was reached in 2017) [51].
Notable in the field of biotechnology is Gemidan Ecogi A/S, which has developed a technology for processing source separated food wastes. In March 2017, the company received a contract for the construction of a waste treatment facility capable of processing 24,000 tons of waste per year [52]. In turn, Xergi, a Danish company specializing in the production of biogas, intends to build its largest plant, which will supply the Arla Foods milk powder production facility in Videbak in western Denmark with green energy [53]. In the town of Hobro, in northern Denmark, the HyBalance Power-to-Gas demonstration project, with a budget of €15 million, and co-managed by Hydrogenics, Air Liquide and a number of other companies, uses PEM electrolysis technology and innovative hydrogen delivery processes [54]. In August 2017, the Danish Aalborg CSP received an order for the construction of a solar power heating plant with a capacity of 8 MW, which will provide heating for more than 2.5 thousand inhabitants in the Copenhagen area [55]. The Danish city of Aarhus is to become the first city in the world to provide most of its citizens with fresh water using energy from wastewater. Marselisborg Wastewater Treatment Plant can generate enough electricity from wastewater to fuel the plant, and use the surplus for pumping drinking water throughout the city [56].
Education and Innovation
A set of indices reflecting the positioning of Denmark among other countries in the field of education and innovation is presented in Figure 9. As shown by the diagram, Denmark is a country with a very high level of intellectual culture indicators.
According to the Global Innovation Index, Denmark is ranked 9th out of 132 countries in 2021 (see diagram for links). According to the number of patents granted to Danish nationals, both domestically and abroad the country ranks 21st in the world. Similarly, by the number of valid patents, the country was 26th in the world, indicating the country's favorable conditions for innovation.
In terms of government expenditure on education as a percentage of the country's GDP, the country demonstrates a result above the world average – 7th out of 177 countries selected for consideration.
| Sources: 1. The Global Innovation Index 2021, Rankings / Knowledge / World Intellectual Property Organization / Cornell University, INSEAD, and WIPO (2021): Energizing the World with Innovation. Ithaca, Fontainebleau, and Geneva *132 2. Patent Grants 2011-2020, resident & abroad / Statistical country profiles / World Intellectual Property Organization *185 3.Patents in Force 2020 / Statistical country profiles / World Intellectual Property Organization *109 4. QS World University Rankings 2022 *97 5. SCImago Country Rankings (1996-2020) / Country rankings / SCImago, (n.d.). SIR-SCImago Journal & Country Rank [Portal]. Retrieved 17 Nov 2021 *240 6. Internet users in 2018 / The World Factbook / Central Intelligence Agency *229 7. Internet users in 2018 (% Population) / The World Factbook / Central Intelligence Agency *229 8. Government expenditure on education, total (% of GDP), 2019 / United Nations Educational, Scientific, and Cultural Organization (UNESCO) Institute for Statistics. License: CCBY-4.0 / Data as of September 2021*177 9. Research and development expenditure (% of GDP), 2018 / UNESCO Institute for Statistics. License: CCBY-4.0 / Data *119 10. Scientific and technical journal articles, 2018 / National Science Foundation, Science and Engineering Indicators. License: CCBY-4.0 / Data *197 * Total number of countries participating in ranking Figure 9. The Indices of education and innovation in Denmark |
Five Danish universities are included in the QS University Rating. It should also be noted that the country's GDP is high, therefore, in absolute terms the costs of education and research are significant. In terms of the amount of government expenditure on research and development as a percentage of GDP, the country is 7th in the world, behind Sweden, and Finland in the region. Denmark ranks highly when considering the number of publications of specialists in scientific and technological journals and patent activities. Denmark placed 23rd out of 240 participating countries in the Scimago ranking, and in Scientific and Journal Activities is ranked 26th out of 196 countries. The country is also among the leaders in terms of its number of internet users. Danish universities, such as the University of Southern Denmark, the University of Copenhagen, the Technical University of Denmark, Aalborg University, and Aarhus University train specialists in various fields of energy Civil and Structural Engineering, Electrical Power Engineering, Environmental protection, Fuel Cells and Hydrogen Technology, Wind Power Systems, Oil and Gas Technology, Offshore Energy Systems, etc.
In the field of synthetic fuel production inventions are actively patented by one of the world leaders in the field – Haldor Topsoe A/S, and Elsam Kraft A/S. Research and development in this field is carried out by Haldor Topsoe A/S and the Technical University of Denmark (DTU).
Welltec A/S, Flsmidth A/S, SCF Technologies A/S are actively engaged in research in the field of extraction and processing of unconventional oil. The Technical University of Denmark (DTU) is the leading research institution in the field. The leading patent holders in the field of hydrocarbon production from reservoirs with low permeability are Welltec A/S, Novoyzmes A/S, Maersk Oil. Research and development in this field is carried out by Aarhus Universtiy and Maersk Oil.
The leaders among Danish companies in the field of associated gas are Haldor Topsoe A/S, Maersk Oil and Haldor Topsoe A/S; the Technical University of Denmark (DTU) is conducting research in this field.
The leading patent holders in the field of bioenergy are Green Farm Energy A/S, the Technical University of Denmark, Steeper Energy Aps, Novoyzmes A/S, Haldor Topsoe A/S. Research and development in this field is being carried out by the Technical University of Denmark (DTU), the University of Copenhagen, and Aalborg University. A large number of Danish companies patent technical solutions in the field of energy production from renewable sources. In the field of solar energy are Alpha-E Aps, Innogie Aps, and Photosolar ApS. Leading research organizations in this field are the Technical University of Denmark (DTU) and Aarhus University.
Vestas Wind Systems A/S is one of the world leaders not only in the manufacturing of wind turbines, but also in patenting their technical solutions in the field of wind energy. Among other companies, we should mention LM Wind Power, LM WP Patent Holding A/S, Envision Energy (Denmark) APS, Siemens AG, MHI Vestas Offshore Wind A / S, and the research is being carried out by the Technical University of Denmark (DTU), Aalborg University, DONG Energy A/S and others.
Ecology and Environment Protection
A diagram of environmental indices shown in Figure 10, to some extent represents the ecological situation in the country. In recent years, Denmark has done a lot to reduce emissions. Under the Paris Agreement, Denmark has pledged to reduce emissions by 70% from 1990 levels by 2030 and is aiming for climate neutrality by 2050. The country demonstrates a medium level of CO2 emissions in general, and per capita, and occupies advanced positions in the renewable energy sector.
| Sources: 1. CO2 total emission by countries 2020 / European Commission / Joint Research Centre (JRC) / Emission Database for Global Atmospheric Research (EDGAR)*208 2. CO2 per capita emission 2020/European Commission/Joint Research Centre (JRC) / Emission Database for Global Atmospheric Research (EDGAR) *208 3. Forest area 2020 (% of land area) / The Global Forest Resources Assessment 2020 / Food and Agriculture Organization of the United Nations *234 4. Forest area change 2010-2020 (1000 ha/year) / The Global Forest Resources Assessment 2020 / Food and Agriculture Organization of the United Nations *234 5. The Environmental Performance Index (EPI) 2020 / Rankings / Yale Center for Environmental Law & Policy / Yale University *180 6. Annual freshwater withdrawals (m3 per capita), 2017 *179 Annual freshwater withdrawals, total (billion m3), 2017 – Food and Agriculture Organization, AQUASTAT data. /License: CC BY-4.0; Population – United Nations, Department of Economic and Social Affairs, Population Division (2019). World Population Prospects 2019, custom data acquired via website. Retrieved 15 November 2021 7. The National Footprint Accounts 2017 (Biocapacity Credit / Deficit) / Global Footprint Network *188 8. Methane emissions (kt of CO2 equivalent), 2018 / Data for up to 1990 are sourced from Carbon Dioxide Information Analysis Center, Environmental Sciences Division, Oak Ridge National Laboratory, Tennessee, United States. Data from 1990 are CAIT data: Climate Watch. 2020. GHG Emissions. Washington, DC: World Resources Institute. Available at: License : Attribution-NonCommercial 4.0 International (CC BY-NC 4.0) *191 9. The Climate Change Performance Index (CCPI) 2022 / Overall Results / Jan Burck, Thea Uhlich, Christoph Bals, Niklas Höhne, Leonardo Nascimento / Germanwatch, NewClimate Institute & Climate Action Network *60 * Total number of countries participating in ranking Figure 10. Environmental indices of Denmark |
Due to the fact that Denmark has a very active policy to reduce emissions, the country is the frontrunner in the list of 60 countries responsible for more than 90% of global CO2 emissions related to energy in the Climate Change Performance Index (CCPI) 2022. In terms of forest area as a percentage of the country, Denmark is 153rd in the world, but nevertheless demonstrates a positive trend in the forest area change – 39th in the world; the preservation of this bio resource is seemingly a priority for the Danish government. The situation is brightened by a high valuation of Denmark in the Environmental Performance Index rankings (EPI) 2020, which focuses primarily on assessing the environmental performance of national governments. Here, the country is in the first place.
References
[1] List of sovereign states and dependencies by area / Wikipedia / https://en.wikipedia.org/wiki/List_of_sovereign_states_and_dependencies_by_area
[2] List of countries and dependencies by population density / Wikipedia / https://en.wikipedia.org/wiki/List_of_countries_and_dependencies_by_population_density
[3] Denmark / The world factbook / Library / Central Intelligence Agency / https://www.cia.gov/
[4] GDP, PPP (constant 2011 international $) / World Bank, International Comparison Program database. License: CC BY-4.0 / Data / The World Bank / http://www.worldbank.org/
[5] GDP per capita, PPP (current international $)/ World Bank, International Comparison Program database. License: CC BY-4.0 / Data / The World Bank / http://www.worldbank.org/
[6] BP Statistical Review of World Energy 2021 (PDF) / BP / https://www.bp.com/
[7] Resource Assessment and Production Forecasts (PDF) / 30th of August 2018 / Danish Energy Agency / https://ens.dk/
[8] World Shale Resource Assessments / U.S. Energy Information Administration (September 24, 2015) / https://www.eia.gov/
[9] Solar resource data obtained from the Global Solar Atlas, owned by the World Bank Group and provided by Solargis / Global Solar Atlas / http://globalsolaratlas.info/
[10] Wind Map / Global Wind Atlas 2.0, a free, web-based application developed, owned and operated by the Technical University of Denmark (DTU) in partnership with the World Bank Group, utilizing data provided by Vortex, with funding provided by the Energy Sector Management Assistance Program (ESMAP). For additional information: https://globalwindatlas.info
[11] Small Hydropower Sector Overview and Potential (PDF) / Small Hydro World / www.smallhydroworld.org/
[12] Agricultural land (% of land area) / Food and Agriculture Organization, electronic files and web site. License: CC BY-4.0 / Data / The World Bank / http://www.worldbank.org
[13] Forest area (% of land area) /Food and Agriculture Organization, electronic files and web site. License: CC BY-4.0 / Data / The World Bank / http://www.worldbank.org/
[14] Municipal waste statistics Updated / December 2021 / Full list / Statistics Explained / Eurostat / https://ec.europa.eu/
[15] BP Statistical Review of World Energy 2017 (PDF) / BP / https://www.bp.com/
[16] International Energy Statistic / Geography / U.S. Energy Information Administration /http://www.eia.gov/beta/international/
[17] Denmark Electricity and Heat for 2018 / IEA Publishing. Licence: International Energy Agency / International Energy Agency / https://www.iea.org
[18] Production (PDF) 20 december 2018 / Danish Energy Agency / https://ens.dk/
[19] The Danish Twist (PDF)/ July 2013 / Oil & Gas Financial Journal / http://www.ogfj.com/
[20] Tyra Field / Wikipedia / https://en.wikipedia.org/wiki/Tyra_Field
[21] Denmark/ List of oil refineries / Wikipedia / https://en.wikipedia.org/wiki/List_of_oil_refineries#Denmark
[22] Stigsnaes: facilities facts / Inter Terminals / http://interterminals.com/
[23] Energy Supply Security 2014, Part 2 / IEA Publishing. Licence: International Energy Agency / International Energy Agency / https://www.iea.org
[24] Denmark Natural Gas Storage (2 existing gas storages) / Storage Map: Information by point / Gas Infrastructure Europe (GIE) / http://www.gie.eu/
[25] Danish Gas System / Dong Energy / http://assets.dongenergy.com/
[26] Denmark / Other Western Europe / U.S. Energy Information Administration (EIA) (June 2019) / http://www.eia.gov/
[27] Skærbæk Gas Power Plant / Industry About / http://www.industryabout.com/
[28] Kyndby Oil Power Plant / Industry About / http://www.industryabout.com/
[29] Avedøre Power Station/ Wikipedia / https://en.wikipedia.org/wiki/Aved%C3%B8re_Power_Station
[30] Avedøre Power Station/ Asnæs Power Station / https://en.wikipedia.org/wiki/Asn%C3%A6s_Power_Station
[31] Tangevaerket Dam/ Wikipedia / https://en.wikipedia.org/wiki/Tangev%C3%A6rket_Dam
[32] Denmark (PDF)/ Leire Gorroño Albizu, Daniele Pagani and Tonny Brink / Nordic Folkecenter for Renewable Energy / April 2018 WWEA Policy Paper Series (PP-02-18-A) / https://www.wwindea.org/
[33] Anholt Wind Farm / 4C Offshore / http://www.4coffshore.com/
[34] Vestas / https://www.vestas.com/
[35] Financial partnership between project planners and LBBW set to run for 15 years / WIrSol / https://wirsol.com/
[36] Solarpark Lerchenborg / Wikipedia / https://de.wikipedia.org/wiki/Solarpark_Lerchenborg
[37] Solar Heat Worldwile (PDF) / AEE INTEC / http://www.aee-intec.at/
[38] Denmark: Arcon-Sunmark Announces Silkeborg Solar Plant Development / Global Solar Thermal Energy Council / http://www.solarthermalworld.org/
[39] IEA Bioenergy Task 37: Biogas / http://task37.ieabioenergy.com/
[40] Lisbjerg Power Station/ Wikipedia / https://en.wikipedia.org/wiki/Lisbjerg_Power_Station
[41] StigeOe Landfill Gas Plant, Denmark / FORCE Technology / https://bio-chp.force.dk/
[42] Kalundborg Bioethanol Demonstration Plant, Denmark / Chemicals Technology / http://www.chemicals-technology.com/
[43] About us / Emmelev A/S / https://books.google.lv/
[44] Appendix 5 List of largest biomass gasifiers / Large Industrial Users of Energy Biomass, September 2013 / IEA Bioenergy Task 40 / http://bioenergytrade.org/
[45] E.ON og SBI åbner Danmarks største biogasanlæg/ Sønderjysk Biogas Bevtoft A/S / http://www.soenderjyskbiogas.dk/
[46] Industry About/ Amager Bakke (Copenhagen) Waste-to-energy Plant / http://www.industryabout.com/
[47] Netherlands / Overview of project initiatives / IEA Bioenergy Task 32: Biomass Combustion and Co-firing / http://www.ieabcc.nl/
[48] ETIP Bioenergy-SABS / Production Facilities / http://www.etipbioenergy.eu/
[49] Energy Policy in Denmark /December 2012 / Danish Energy Agency / https://ens.dk/
[50] New passenger car registrations by alternative fuel type in the European Union (PDF) / ACEA / http://www.acea.be/
[51] Leading Energy Ministers and industry captains join forces for significant offshore wind volumes in Europe by 2030 / Wind Europe / https://windeurope.org/
[52] Danish Firm to Build 24,000 TPA Garden Food Waste Pre-Treatment Plant / Waste Management world / https://waste-management-world.com/
[53] Xergi set to build their biggest biogas plant yet at milk powder factory / Bio Energy Insight / http://www.bioenergynews.com/
[54] Hydrogenics Selected to Join €15 Million Power-to-Gas Project / 23/02/2016 / Hydrogenics / http://www.hydrogenics.com/
[55] Aalborg CSP wins another order for a concentrated solar power heating plant in Denmark / Helioscsp / http://helioscsp.com/
[56] Danish city makes ‘world first’ by powering its water needs with sewage energy / Bioenergy insight / http://www.bioenergy-news.com/
[57] Coal is a climate problem / European Coal Map / http://www.coalmap.eu/
The sources of charts and curves are specified under the images.
For more information about the energy industry in Denmark see here