
Contents
General State of the Economy
In terms of the size of the territory, Peru is 19th in the world, behind Brazil, Argentina and Mexico among the Latin American countries [1]. The average population density in the country is 26 people per 1 km2 (197th in the world [2]). The total length of the country's coastline is 2 414 km [3].
According to 2022 statistics, the country is home to more than 33 million people [3]. More than half the population of Peru is concentrated in the region of the Andes Mountains, the official languages are Spanish, Quechua and Aymara [3].
| Republic of Peru / República del Perú | ||
|---|---|---|
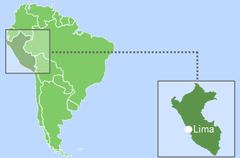
| Capital: Lima | Density: 23/km2 | Currency: Peruvian sol (PEN) |
| Official languages: Spanish, Quechua, Aymara | Life expectancy at birth: 73.66 years | GDP (PPP): $548.465 billion (2023 est.) |
| National Day: 28 July | Area: 1,285,216 km2 | GDP - per capita (PPP): $15,893 (2023 est.) |
| Population: 34,352,720 (2023 est.) | Coastline: 3,080 km | Internet country code: .pe |
Source: [1,2,3,4,5]
The level of development of the Peruvian economy is reflected in the comparative diagram of various economic indices – Fig.1. For 7 out of 10 indices Peru is positioned at the top half of the diagram.
| Sources: 1. GDP (purchasing power parity), 2020 est. / The World Factbook/Library/Central Intelligence Agency *228 2. GDP - per capita (PPP), 2020 / The World Factbook/Library/Central Intelligence Agency *229 3. Inflation rate (consumer prices), 2019 est. / The World Factbook/Library/Central Intelligence Agency *228 4. Charges for the use of intellectual property, receipts (BoP, current US$), 2020 / International Monetary Fund, Balance of Payments Statistics Yearbook, and data files. / License: CC BY-4.0 *88 5. The Global Competitiveness Index 2019 / Rankings / Reports / World Economic Forum *141 6. High-technology exports (current US$) 2019-2020 / United Nations, Comtrade database through the WITS platform / License: CCBY-4.0 / Data *134 7. 2021 Index of Economic Freedom / International Economies / The Heritage Foundation *178 8. Reserves of foreign exchange and gold, 2017 est. / The World Factbook / Library / Central Intelligence Agency *195 9. Annual average GDP growth in %, for the last 10 years (2011-2020) / World Bank national accounts data, and OECD National Accounts data files / License: CC BY-4.0 *206 10. Public debt (% of GDP), 2017 est. / The World Factbook / Library / Central Intelligence Agency(from smallest to largest) *210 * Total number of countries participating in ranking Figure 1. Economic Indices of Peru |
Between 1990 and 2019, the country experienced a steady growth of GDP at purchasing power parity, both in general and per capita [4,5].
However, GDP at purchasing power parity decreased from $417.8 billion in 2019 to $371.2 billion in 2020 [3]. The country’s GDP at purchasing power parity per capita is lower, which has also been demonstrating negative dynamics: from $12 900 in 2019 to $11 300 in 2020 [3]. The inflation rate rose from 1.3% in 2018 to 2.1% in 2019 [3].
According to the Global Competitiveness Report presented by the World Economic Forum in 2019, Peru is 65th from an estimated total of 141 countries, behind Colombia und Uruguay. This rating reflects the effectiveness of the use of the country’s own resources for sustainable development. In addition to a number of economic indicators this index also takes into account such variables as education, health, level of innovation, etc.
According to the Index of Economic Freedom, which is based on freedom of business, freedom from government action, property protection, and freedom from corruption, Peru was 50th in 2021 out of the 178 countries considered. In terms of gold reserves and foreign exchange reserves in 2017 Peru was 35th in the world. According to the indicator for the average GDP growth in percentage over the last 10 years, in 2020 the country was 93rd out of 206 countries. In terms of public debt, calculated as a percentage of the country's GDP, Peru was ranked 174th out of 210 countries considered in 2017.
Energy resources
With the exception of natural gas Peru has insignificant reserves of fossil resources. In addition to natural gas, oil and coal deposits, unconventional resources such as extra-heavy oil are also present in the country (Table 1). In terms of tons of oil equivalent, in 2021 proved reserves of conventional hydrocarbons in Peru were: natural gas –58.9%, coal – 15.6%, oil –25.5% (Fig.5). Peru has the third largest natural gas reserves in South America, which totalled 12.88 Tcf in 2017 and 9.2 Tcf in 2020 [6,7]. According to the U.S. Central Intelligence Agency in 2021, natural gas reserves in the country were estimated at 300.1 billion cubic meters [3].
Table 1. Fossil energy resources of Peru
| Resource /Explanations | Crude oil | Natural gas | Coal | Shale Gas | Tight Oil | Coal mine methane | Extra heavy oil* |
|---|---|---|---|---|---|---|---|
| Value | 858.9 | 300.1 | 112 | no data | no data | no data | 7 |
| Unit | million bbl | billion cubic meters | million short tonnes | - | - | - | million bbl |
| Year | 2021 | 2021 | 2021 | - | - | - | 2008 |
| Source | [3] | [3] | [9] | - | - | - | [8] |
*reserves
According to estimates of the Ministry of Energy of Peru [6], as of December 2020 proven reserves of liquid hydrocarbons in Peru were estimated at 763.27 million barrels, of which crude oil was 300.22 million barrels, gas condensate – 463.05 million barrels. According to BP review, the proven reserves of oil in 2020 amounted to 0.7 thousand million barrels [7], however [3] estimates the reserves of oil in Peru to be at the level of 858.9 million barrels in 2021. Peru also has small deposits of extra-heavy oil (last place among the countries of South America), according to estimates [8] –about 7 million barrels.
Coal reserves in the country were 112 million short tons in 2021 [9].
Peru has a good resource potential for the development of clean energy production. A selection of basic indicators of this type of resource is presented in Table 2.
Table 2. Renewable energy resources of Peru
| Resource/ Explanations | Solar Potential (GHI)* | Wind Potential (50 м)* | Hydro energy Potential** | Bio Potential (agricultural area) | Bio Potential (forest area) | Geothermal Potential | Municipal Solid Waste |
|---|---|---|---|---|---|---|---|
| Value | 5.2-6.3 | 4.5-7.5 | 212 826 | 19.1 | 56.5 | 3000 | 0.75 |
| Unit | kWh/m2/day | m/s | MW | % of land area | % of land area | MWe | kg/per capita/day |
| Year | 2018 | 2018 | 2013 | 2020 | 2020 | 2015 | 2016 |
| Source | [10] | [11] | [14] | [16] | [17] | [18] | [19] |
* for the majority of the territory of the country
** gross theoretical capability
The level of solar radiation is low and, in most of the country and in the west, is relatively high 5.2-6.3 kWh/m2/day [10]. The maximum level of solar radiation is observed in the south-west, in the province of Puno andcan be over 8.8 kWh/m2/day [10]. For the majority of the country, the average annual wind speed is usually about 4.5-7.5 m/sec. However, in the south-west, at an altitude of 50 meters, the average annual wind speed can reach over 7.5 m/sec [11].
Peruvian rivers originate mainly in the Andes, and those that flow into Lake Titicaca have great potential for hydropower. The largest rivers are the Ucayali, the Maranyon, the Amazon and others [12]. According to the Peruvian Ministry of Energy [13,14], the theoretical hydro potential of Peru in 2013 was 212 826 MW, and the technical potential is 135 377 MW. Moreover, on the coast there is a certain potential for tidal energy, which can reach between 20-30 kw/m [15]. More than 56.5% of Peru is forested, and about 19.1% is agricultural land, and this is a fairly rich bio-resource for energy production, which in the future can diversify the country's energy mix [16,17]. The potential of geothermal energy in the country was estimated at 3 000 MWe in 2015 [18].
This energy review would not be complete without mentioning municipal waste (0.75 kg per capita per day), which on the one hand is a valuable raw material for recycling or energy production, and on the other – long decaying organic and other hazardous substances, damaging the environment [19].
Energy Balance
The total primary energy consumption in Peru in 2021, which totalled 1.20 exajoules, was dominated by oil – 43.3%, hydropower – 25%, the share of natural gas was 24.2%, coal –4.2%, and renewables – 4.2%[67].
The production of crude oil in Peru has grown annually over the past 10 years, mainly due to gas condensate (Fig. 2) and since 2001 has almost doubled, from 96 000 barrels/day to 179 000 barrels/day, in 2014, however than it slowed down [9] and reached the level of 125 thousand barrels in 2021 [7, 9]. According to the Peruvian Ministry of Energy, the production of liquid hydrocarbons in 2020 was at the level of 124 662 barrels/day [6].
A similar trend was observed in the field of oil consumption, which increased from 155 thousand barrels/day in 2001 to 266 thousand barrels/day in 2019 and dropped to 208 thousand barrels/day in 2021, according to BP –266 thousand barrels/day in 2021 [9]. Exports of crude oil from Peru in 2018 amounted to 6 500 barrels a day, with imports of 112 900 barrels day [3].
The production of natural gas has been growing steadily since 2001. In 2009, there was a sharp increase due to the discovery of the Camisea field, which allowed exporting its surplus (Fig. 2). As such, according to [9], the production of natural gas in 2000 was at the level of 13 Bcf and by 2021 increased by more than 25 times and amounted to 420 Bcf, and according to the Peruvian Ministry of Energy [6] – 1.161 MMSCFD per day in 2020.
The consumption of natural gas also grew steadily, having undergone a slight stagnation in 2009. According to [9], in 2021 Peru consumed this resource at the level of 287 Bcf, according to [7] in 2021 the country consumed about 8 Bcm of natural gas. Exports of this recourse were 5.446 Bcm in 2019 [3].
Production of coal also gradually grew over the last 20 years (Fig. 2). According to the U.S. Energy Information Administration, coal production increased from 21 thousand short tons in 2001 to 475 thousand short tons in 2021, while consumption decreased from 517 thousand short tons in 2001 to 259 thousand short tons in 2021 [9].
Source: U.S. Energy Information Administration (Dec 2022) / www.eia.gov
Figure 2. The production and consumption of fossil fuels in Peru (coal – left, gas – in the center, right – oil)
In 2021, Peru generated about 58.14 TWh of electricity, 39.6% were generated by thermal power plants, 54.9% by hydroelectric power stations, and 5.5% by other renewable sources (Fig. 6).
Peru’s position in the comparative diagram of energy index is shown in Figure 4.
Indices based on reserves of natural gas and its export opportunities show Peru’s distinct advantage over most of the world. The share of renewable energy in electricity production in Peru is 4%, according to the Central Intelligence Agency, and in 2017 the country was 115th out of 170 countries selected for consideration.
Sources: U.S. Energy Information Administration (Dec 2022) / www.eia.gov | ||
| Figure 3. Electricity production in Peru |
In the Energy Architecture Performance Index 2017, which is based first on the level of economic growth, environmental safety, and energy independence of the country, including access to energy, Peru lost 9 ranking positions over the previous year, and is 27th in the world.
| Sources: 1. Crude oil proved reserves, 2021 / International Energy Statistic/Geography / U.S. Energy Information Administration (Nov 2021)*98 2. Natural gas proved reserves 2021 / International Energy Statistic / Geography / U.S. Energy Information Administration (Nov 2021) *99 3. Total recoverable coal reserves 2019 / International Energy Statistic / Geography / U.S. Energy Information Administration (Nov 2021) *81 4. Combination production-consumption for Crude oil 2018 / International Energy Statistic / Geography / U.S. Energy Information Administration (Nov 2021) *219 5. Combination production-consumption for Natural gas 2019 / International Energy Statistic / Geography / U.S. Energy Information Administration (Nov 2021) *123 6. Combination production-consumption for Coal 2019 / International Energy Statistic / Geography / U.S. Energy Information Administration (Nov 2021) *128 7. Electricity – from other renewable sources (% of total installed capacity), 2017 est. / The World Factbook / Library / Central Intelligence Agency *170 8. GDP per unit of energy use (PPP per unit of oil equivalent), 2020 *66 Primary energy consumption - BP Statistical Review of World Energy 2021/BP;GDP (purchasing power parity) - The World Factbook/Library/Central Intelligence Agency 9. Energy use (primary energy use of oil equivalent per capita) 2020 *127 Primary energy consumption – BP Statistical Review of World Energy 2021; Population - United Nations, Department of Economic and Social Affairs, Population Division (2019). World Population Prospects 2019, custom data acquired via website. Retrieved 15 November 2021*66 10. The Global Energy Architecture Performance Index Report (EAPI) 2017 / Rankings / Reports / World Economic Forum 11. Electric power consumption (kWh per capita), 2016 *217 Electricity Consumption - The World Factbook / Library / Central Intelligence Agency; Population - United Nations, Department of Economic and Social Affairs, Population Division (2019). World Population Prospects 2019, custom data acquired via website. Retrieved 15 November 2021 12. Combination of electricity production-consumption (kWh)/The World Factbook/Library/Central Intelligence Agency *216 * Total number of countries participating in ranking Figure 4. Energy indices of Peru |
Peru is in the top half of the ranked list of countries for such indicators as GDP per unit of energy use in 2020 – 12th out of 66 countries considered, while energy consumption per capita is much lower – 59th out of 66 countries. In terms of electricity consumption per capita, the country is 128th in the world, however, for the indicator of combination of electricity production-consumption, Peru is 52nd in the ranked list of 216 countries.
Energy Infrastructure
A territorial map of the distribution of the largest infrastructure projects of the fossil fuel sector in Peru is shown in Figure 5.
As previously mentioned, natural gas is the country's main mineral resource. The largest natural gas field is the Camisea, which according to experts can contain 8.8 trillion cubic feet [20]. The main gas fields are connected to the infrastructure through a developed network of gas pipelines 1 526 km long. The Aguaytia gas processing plant is the largest and has a capacity of 173 MW. This plant was part of the "Aguaytia" project worth $273 million, which also provided for the construction of 290 km of pipelines and 392 km of power lines [21]. The largest oil field is the offshore Corvina Oil and Gas Field, the extraction of which is at the level of 4 656 barrels/day [22].
Three types of oil pipelines connect the oil fields with the major refineries: pipelines for crude oil with a total length of 1 033 km; oil pipelines for the transportation of petroleum products with a length of 15 km; liquefied petroleum gas pipeline 786 km long (Fig.5).
The total installed capacity of Peruvian oil refineries is 200 000 barrels/day. There are seven refineries in the country, the largest of which is La Pampillla Lima, with a capacity of 102 thousand barrels/day [23]. Also in the country there are about a dozen large oil storages. The most capacious of these is Callao Oil Storage, with a volume of 1 130 600 barrels [24].
Figure 5. Basic infrastructure facilities of the fossil fuel sector in Peru
Along the coast there are three import oil terminals and one LNG terminal. The largest oil terminal is Bayovar, with an installed capacity of 100 thousand barrels per hour [25]. The export LNG terminal has a capacity of 4.4 million tons per year [26]. By 2019, the government of Peru plans to modernize Refinería de Talara, the second-largest refinery, and repair the Oleoducto Nor Peruano (ONP) oil pipeline [27].
The most important coal fields of Peru - Alto Chicama and Santa Basins –are in the central part of the country. There also have been hydrate occurrences found to the west of the country (Fig. 5).
Figure 6 shows the most important facilities in Peru producing electrical energy. 
Figure 6. Electricity production in Peru
The production of electricity through fossil fuels is carried out mainly through gas power stations (Fig. 6). The largest station of this type is Chilca Uno, with an installed capacity of 852 MW [28]. Electricity from coal and oil is produced at power plants, the largest of which is coal Ilo 21 (135 MW) and oil Ilo 1 (216.8 MW) and Ilo 31 (500 MW) [29].
The total installed capacity of the hydroelectric power plants in Peru, according to data for 2021, is estimated at 5.49 GW of which 10 hydroelectric plants have a capacity of more than 100 MW (Fig. 7). The maximum capacity of hydroelectric power stations is the Mantaro-Tablachaca Complex – 1 008 MW [30].
Figure 7 shows the main facilities of the Peruvian infrastructure for the production of energy from renewable sources.
As previously stated, renewable energy in Peru, excluding hydropower, does not have a decisive influence on the production of basic types of energy. Most renewable energy enterprises are concentrated in the south of the country and along the coast. 
Figure 7. Renewable energy in Peru
The level of solar radiation in most of the country reaches 5.2-6.3 kWh/m2 per day, and the level of wind activity in coastal areas can reach 7.5 m/s, which contributes to the development of wind and solar stations (see Figure 7). In the country there are about 5 solar stations and 4 wind farms with a capacity of more than 1 MW. The largest wind farm Wayra has an installed capacity of 132 MW, and the leading photovoltaic Rubi station has a capacity of 180 MW and is included in the national grid [31,32].
The total installed capacity of renewable energy in Peru is 6.43 GW, of which about 85.4% is in hydropower, 6.4% in wind energy, 3% in bioenergy and 5.2% in solar energy (Figure 7).
In addition, it is worth noting a steady growth in wind power capacity, which increased from 142.7 MWe in 2014 to 239.7 MWe in 2017 [33].
Considering the significant bio and forest resources, bioenergy also received significant development in Peru. The bioenergy infrastructure in the country is represented by both biomass processing enterprises and biogas and biodiesel plants (Fig. 7). The largest biomass plant is owned by Maple Energy and has an installed capacity of 37 MW [34].
Grupo Palmas is successfully developing modern technologies for biodiesel production and owns several enterprises, the largest of which is Uchiza, producing about 200 tons of biodiesel daily [35].
The leading enterprises for the production of bioethanol are in the Piura region, where the natural conditions for the production of sugar cane are the most favourable. The Romero Group owns 6 000 hectares in the region, and the Cana Brava plant produces about 350 000 litres of bioethanol daily [36]. The landfill gas production plant, Huaycoloro landfill, has a capacity of 40 million tons [37].
The National Energy Strategy 2014-2025 (Plan Energético Nacional 2014-2025) mainly focuses on ensuring universal access to energy resources, increasing the share of renewable energy sources in power generation and reducing carbon dioxide emissions [38]. Two development scenarios are considered within the framework of the strategy; one with a minimum rate of 4.5% of GDP and another with a maximum rate of 6.5% of GDP that would contribute to a more efficient development of the energy sector. It is also planned to increase oil production to 153 million barrels/day by 2025 and gas - about 3 000 million cubic meters per day. The total investment for the implementation of the conceived strategy will be about $53 million [38].
Education and Innovation
Solution of modern energy problems, as well as the practical implementation of actual energy projects, largely depend on the level of education and innovations in the country.
The set of indices reflecting the position of Peru among other countries in the field of education and innovation can be seen in Figure 8.
Peru's performance in this area is highly controversial; almost half of the indices are at the top of the chart and have positive characteristics, the others are showing fairly low rates.
| Sources: 1. The Global Innovation Index 2021, Rankings / Knowledge / World Intellectual Property Organization / Cornell University, INSEAD, and WIPO (2021): Energizing the World with Innovation. Ithaca, Fontainebleau, and Geneva *132 2. Patent Grants 2011-2020, resident & abroad / Statistical country profiles / World Intellectual Property Organization *185 3.Patents in Force 2020 / Statistical country profiles / World Intellectual Property Organization *109 4. QS World University Rankings 2022 *97 5. SCImago Country Rankings (1996-2020) / Country rankings / SCImago, (n.d.). SIR-SCImago Journal & Country Rank [Portal]. Retrieved 17 Nov 2021 *240 6. Internet users in 2018 / The World Factbook / Central Intelligence Agency *229 7. Internet users in 2018 (% Population) / The World Factbook / Central Intelligence Agency *229 8. Government expenditure on education, total (% of GDP), 2019 / United Nations Educational, Scientific, and Cultural Organization (UNESCO) Institute for Statistics. License: CCBY-4.0 / Data as of September 2021*177 9. Research and development expenditure (% of GDP), 2018 / UNESCO Institute for Statistics. License: CCBY-4.0 / Data *119 10. Scientific and technical journal articles, 2018 / National Science Foundation, Science and Engineering Indicators. License: CCBY-4.0 / Data *197 * Total number of countries participating in ranking Figure 8. The indices of education and innovation in Peru |
According to the index of Global Innovation in 2021, Peru is ranked 70th out of 132 participating countries (see diagram for links to sources of information).
According to the number of patents granted to Peruvian residents, both inside the country and abroad, the country ranks 99th in the world. Similarly, by the number of patents in force, the country was 63rd in the world, which largely characterizes the country's patent attractiveness.
In the QS University Rating, eight Peruvian universities are included, which may be due to low levels of public funding for research, development of science and training in general, as evidenced by the 8th and 9th index. Positive trends are observed in the field of scientific publications according to Scimago Journal and Country Rank and Worldbank. Scimago ranks Peru 72nd out of 240 countries, and in the ranking of Scientific and Technical Journal Activities 67th place, from 197 countries.
Leading universities in the country that train specialists in various fields of energy are Universidad Científica del Sur, Universidad Nacional de Trujillo, and Universidad Nacional Mayor de San Marcos. These universities offer training in such specialties as Environmental Engineering and Management, Architecture and Environmental Urbanism, Mines Engineering, Environmental Engineering, Fluid Mechanics Engineering, and conduct active research in the field of bioenergy. Research on gas hydrates is carried out by as Petroperu S.A. Universidad Nacional de Ingeneria and Savia Peru S.A. are engaged in research in the field of non-traditional hydrocarbons production, including directional drilling. Clariant S.A., Petroperu S.A., Pluspetrol Peru Corporation conduct research in the field of extraction and processing of unconventional oil. The leading research institutions in the field of bioenergy are San Marcos National University and Universidad Cientifica del Sur.
Ecology and Environment Protection
A diagram of environmental indices is shown in Figure 9.
The analysis of the selected indices presented in the diagram provides an assessment of the ecological situation in the country. First of all, it is necessary to note the extremely high level of CO2 emissions and methane emissions; however, per capita the situation does not appear so troublesome due to the relative sparseness of the country. There is a very negative trend in forest area change. In this ranking Peru is at the bottom of the list – 222nd out of 234 countries.
| Sources: 1. CO2 total emission by countries 2020 / European Commission / Joint Research Centre (JRC) / Emission Database for Global Atmospheric Research (EDGAR)*208 2. CO2 per capita emission 2020/European Commission/Joint Research Centre (JRC) / Emission Database for Global Atmospheric Research (EDGAR) *208 3. Forest area 2020 (% of land area) / The Global Forest Resources Assessment 2020 / Food and Agriculture Organization of the United Nations *234 4. Forest area change 2010-2020 (1000 ha/year) / The Global Forest Resources Assessment 2020 / Food and Agriculture Organization of the United Nations *234 5. The Environmental Performance Index (EPI) 2020 / Rankings / Yale Center for Environmental Law & Policy / Yale University *180 6. Annual freshwater withdrawals (m3 per capita), 2017 *179 Annual freshwater withdrawals, total (billion m3), 2017 – Food and Agriculture Organization, AQUASTAT data. /License: CC BY-4.0; Population – United Nations, Department of Economic and Social Affairs, Population Division (2019). World Population Prospects 2019, custom data acquired via website. Retrieved 15 November 2021 7. The National Footprint Accounts 2017 (Biocapacity Credit / Deficit) / Global Footprint Network *188 8. Methane emissions (kt of CO2 equivalent), 2018 / Data for up to 1990 are sourced from Carbon Dioxide Information Analysis Center, Environmental Sciences Division, Oak Ridge National Laboratory, Tennessee, United States. Data from 1990 are CAIT data: Climate Watch. 2020. GHG Emissions. Washington, DC: World Resources Institute. Available at: License : Attribution-NonCommercial 4.0 International (CC BY-NC 4.0) *191 9. The Climate Change Performance Index (CCPI) 2022 / Overall Results / Jan Burck, Thea Uhlich, Christoph Bals, Niklas Höhne, Leonardo Nascimento / Germanwatch, NewClimate Institute & Climate Action Network *60 * Total number of countries participating in ranking Figure 9. Environmental Indices of Peru |
The situation is also brightened by the position of Peru above the world average in the Environmental Performance Index (EPI) 2020, which is primarily based on an assessment of the performance of national governments aimed at improving the environmental situation in the country through the rational use of natural resources. Here, Peru is 90th in 2020 and demonstrates a positive trend.
According to the Environmental Vulnerability Index, which is based on years of observations and 50 indicators and includes, for example, changing climatic characteristics or the quality of water resources, waste volumes, oil spills and other hazardous substances, etc. Peru is placed 60th, ahead of Argentina (92nd place) and Chile (93rd place), and considered "vulnerable". The overall negative picture is smoothed by the Ecological Footprint Atlas rating, according to which Peru is among the environmental creditors.
References
[1] List of sovereign states and dependencies by area / Wikipedia / en.wikipedia.org/wiki/List_of_sovereign_states_and_dependencies_by_area
[2] List of countries and dependencies by population density / Wikipedia / en.wikipedia.org/wiki/List_of_countries_and_dependencies_by_population_density
[3] Peru / The world factbook / Library / Central Intelligence Agency / www.cia.gov
[4] GDP, PPP (constant 2011 international $) / World Bank, International Comparison Program database. License : CC BY-4.0 / Data / The World Bank / www.worldbank.org
[5] GDP per capita, PPP (current international $)/ World Bank, International Comparison Program database .License : CC BY-4.0 / Data / The World Bank / www.worldbank.org
[6] Libro Annual de Recursos de Hidrocarburos 2020 (PDF) / al 31 de diciembre del 2020 / Ministerio de Energia y Minas / www.minem.gob.pe
[7] BP Statistical Review of World Energy 2022 (PDF) / BP / www.bp.com
[8] 2010 Survey of Energy Resources (PDF) / World Energy Council / www.worldenergy.org
[9] International Energy Statistic / Geography / U.S. Energy Information Administration (Dec 2022) / www.eia.gov/beta/international/
[10] Solar resource data obtained from the Global Solar Atlas, owned by the World Bank Group and provided by Solargis / Global Solar Athlas / globalsolaratlas.info
[11] Wind Map / Global Wind Atlas 2.0, a free, web-based application developed, owned and operated by the Technical University of Denmark (DTU) in partnership with the World Bank Group, utilizing data provided by Vortex, with funding provided by the Energy Sector Management Assistance Program (ESMAP). For additional information: globalwindatlas.info
[12] Peru / Wikipedia / en.wikipedia.org/wiki/Peru
[13] Balance Nacional de Energia 2015 (PDF) / Ministerio de Energia y Minas / www.minem.gob.pe
[14] Anuario Ejecutivo de Electricidad 2014 (PDF) / Ministerio de Energia y Minas / www.minem.gob.pe
[15] Wave power / Wikipedia / en.wikipedia.org/wiki/Wave_power
[16] Agricultural land (% of land area) / Food and Agriculture Organization, electronic files and web site. Li-cense : CC BY-4.0 / Data / The World Bank / www.worldbank.org
[17] Forest area (% of land area) /Food and Agriculture Organization, electronic files and web site.License : CC BY-4.0 / Data / The World Bank / www.worldbank.org
[18] 2016 Annual US Global Geothermal Power Production (PDF) / Geothermal Energy Association / geo-energy.org
[19] World Bank What a Waste 2.0 / Data / The World Bank / www.worldbank.org
[20] Heat, but not light / June 2010 / The Economist / www.economist.com
[21] Aguaytia Energy / Maple Gas / www.maple.com.pe
[22] Corvina / SubseaIQ / www.subseaiq.com
[23] Refineria La Pampillla Lima / A Barrel Full / abarrelfull.wikidot.com
[24] Oiltanking Peru S.A.C / Oiltanking / www.oiltanking.com
[25]Terminal Bayovar / Petroperu S.A. / www.petroperu.com.pe
[26] Peru LNG Terminal / A Barrel Full / abarrelfull.wikidot.com
[27] Refineria La Pampillla Lima / El periodico de la energia / elperiodicodelaenergia.com
[28] EnerSur’s ChilcaUno: first thermoelectric power plant built to use gas from Camisea / Cuanta Energia Tienes / blog.cuantaenergiatienes.com
[29] Fundamentos / ENGIE Energia Peru S.A. / engie-energia.pe
[30] Kraftwerkskomplex Mantaro / Wikipedia / de.wikipedia.org/wiki/Kraftwerkskomplex_Mantaro
[31] Enel becomes Peru’s main renewable player after commissioning country’s largest wind farm / 4 June 2018 / enel green power / www.enelgreenpower.com
[32] Rubí Solar Plant: Peru’s Largest Solar Plant / enel Peru / www.enel.pe
[33] Peru / IRENA REsource / resourceirena.irena.org
[34] Industrial Development / Ethanol Project / Maple Energy / www.maple-energy.com
[35] Instalaciones / El Grupo / Grupo Palmas / www.palmas.com.pe
[36] Peru: Biofuels Annual 2012 (PDF) / USDA'S Global Agriculture Information Network (GAIN) / gain.fas.usda.gov
[37] Peru: Huaycoloro landfill gas capture and combustion / The World Bank’s Carbon Finance Unit / wbcarbonfinance.org
[38] Plan Energético Nacional 2014- 2025 (PDF) / Ministerio de Energia y Minas / www.minem.gob.pe
The sources of charts and curves are specified under the images.
For more information about the energy industry in Peru see here