
Contents
General State of the Economy
The Republic of Croatia is located in southern Europe and partly also on the Balkan Peninsula. Croatia borders with Slovenia and Hungary in the north, with Serbia in the east and Montenegro in the south. Croatia has the longest land border with Bosnia and Herzegovina, which is located in the south-west and north from the mainland. In the south and south-west, the country is washed by Adriatic Sea, with a coastline of slightly less than 1800 km. About 3.9 million people live in Croatia, with the country having a relatively low population density of 68.4/km2. Croatia is a parliamentary republic. The country gained independence in 1991 during the separation from Yugoslavia. The capital of Croatia is Zagreb, where more than 800,000 people live.
| Croatia | ||
|---|---|---|
| Capital: Zagreb | Density: 68.4/km2 | Currency: (€) (EUR) |
| Official languages: Croatian | Life expectancy at birth: 74.02 years | GDP (PPP): $172.781 billion (2024 est.) |
| National Day: 25 June | Area (land): 56,594 km2 | GDP - per capita (PPP): $45,087 (2024 est.) |
| Population: 3,855,64 (2022 est.) | Coastline: 1,777 km | Internet country code: .hr |
Source: [1,2,3,4,5]
Croatia's ranking positions relative to other countries have been determined for an extensive list of economic, energy, innovative and educational indices, as well as for metrics reflecting the state of the environment. The economic indices include, for example, GDP per capita, annual average GDP growth, high-technology exports, and others. The list of energy indices includes proven reserves of oil, gas and coal, production-consumption ratio combined, and energy use, etc. Each of the indices has a ranked list of included member countries. Since the number of countries in each rating is different for each index, the positioning of the country of interest is displayed on a special chart, where the vertical axis is a uniform relative scale from 0 to 1, whereas the horizontal axis denominates the various indices and respective numbers relating to the descriptions given underneath.
Thus, in such a relative “0-1” diagram, the country’s position is marked with a dot in proportion to its location in the original rating list. If the country is among the leaders regarding the selected indicator, it will be marked close to 1 in the upper green zone on the relevant chart “0-1”, if the country is an outsider in the rating list, then it will be marked in the lower red zone of the chart “0-1”, etc.
Ranking position of Croatia for list of economic indices:
| Sources: 1. GDP (purchasing power parity), 2020 est. / The World Factbook/Library/Central Intelligence Agency *228 2. GDP - per capita (PPP), 2020 / The World Factbook/Library/Central Intelligence Agency *229 3. Inflation rate (consumer prices), 2019 est. / The World Factbook/Library/Central Intelligence Agency *228 4. Charges for the use of intellectual property, receipts (BoP, current US$), 2020 / International Monetary Fund, Balance of Payments Statistics Yearbook, and data files. / License: CC BY-4.0 *88 5. The Global Competitiveness Index 2019 / Rankings / Reports / World Economic Forum *141 6. High-technology exports (current US$) 2019-2020 / United Nations, Comtrade database through the WITS platform / License: CCBY-4.0 / Data *134 7. 2021 Index of Economic Freedom / International Economies / The Heritage Foundation *178 8. Reserves of foreign exchange and gold, 2017 est. / The World Factbook / Library / Central Intelligence Agency *195 9. Annual average GDP growth in %, for the last 10 years (2011-2020) / World Bank national accounts data, and OECD National Accounts data files / License: CC BY-4.0*206 10. Public debt (% of GDP), 2017 est. / The World Factbook / Library / Central Intelligence Agency (from smallest to largest) *210 * Total number of countries participating in ranking Figure 1. Economic Indices of Croatia |
For most of the indices shown in the chart, Croatia is in the middle or slightly above the middle of the rankings. The weakest parts of Croatia's economic indicators are annual average GDP growth in % and public debt, where the country is represented at the bottom of the rankings. Of the indices presented, Croatia has the highest values for GDP, GDP per capita and reserves of foreign exchange and gold.
Energy Resources
Croatia has no significant fossil fuels reserves. For example, the share of oil reserves in Croatia relative to the world's reserves is 0.004%, and natural gas 0.0124%. In terms of tons of oil equivalent, according to 2024 data, conventional proved reserves by fuel type were: 30.1% – oil, and 69.9% – gas (Fig.5).
Table 1. Fossil energy resources of Croatia
| Resource /Explanations | Crude oil* | Natural gas* | Coal | Shale Gas | Tight Oil | Coalmine methane |
|---|---|---|---|---|---|---|
| Value | 71 (0.004%) | 24.919 (0.0124%) | - | - | - | - |
| Unit | million barrels | Tcf | - | - | - | - |
| Year | 2021 | 2020 | - | - | - | - |
| Source | [3] | [3] | - | - | - | - |
* share of the country’s reserves in world total is provided in brackets
The renewable resource matrix of Croatia shows no exceptional or extreme values. The country has several large rivers, including the Danube, the Sava and the Drava, which for large parts run along the borders of the country, making it difficult to use them for hydropower. There is a certain potential for the development of bioenergy, in particular for the production of pellets, biogas, biomass gasification. However, the total area of agricultural land and forests is relatively small, which means that it is impossible to provide feedstock everywhere in sufficient quantities.
On the other hand, the country has vast areas with sufficient solar activity to install solar plants with efficient power generation.
Table 2.Renewable energy resources of Croatia
| Resource/ Explanations | Solar Potential (GHI)* | Wind Potential (50 м)* | Bio Potential (agricultural area) | Bio Potential (forest area) | Municipal Solid Waste |
|---|---|---|---|---|---|
| Value | 3.5-4.1 | 5.0-7.0 | 26.9 | 34.7 | 446 |
| Unit | kWh/m2/day | m/s | % of land area | % of land area | kg per capita |
| Year | 2020 | 2020 | 2020 | 2020 | 2021 |
| Source | [7] | [8] | [9] | [10] | [11] |
*for the majority of the territory of the country
The wind resources situation is even better. In several areas of the country, wind speed reaches more than 7 m/s, some of which are located on the coastline and another In the inner of the country. Below is a graph of the average statistical wind speed in a reference calendar year over a ten-year observation period for the Sibenik area on the Adriatic coast (based on National Oceanic and Atmospheric Administration U.S. Department of Commerce).
SIBENIK: Latitude: 43.73, Longitude: 15.92, height of 10 m
Average speed: 3.26 m/s, Operational share: 56%
Wind speed, m/s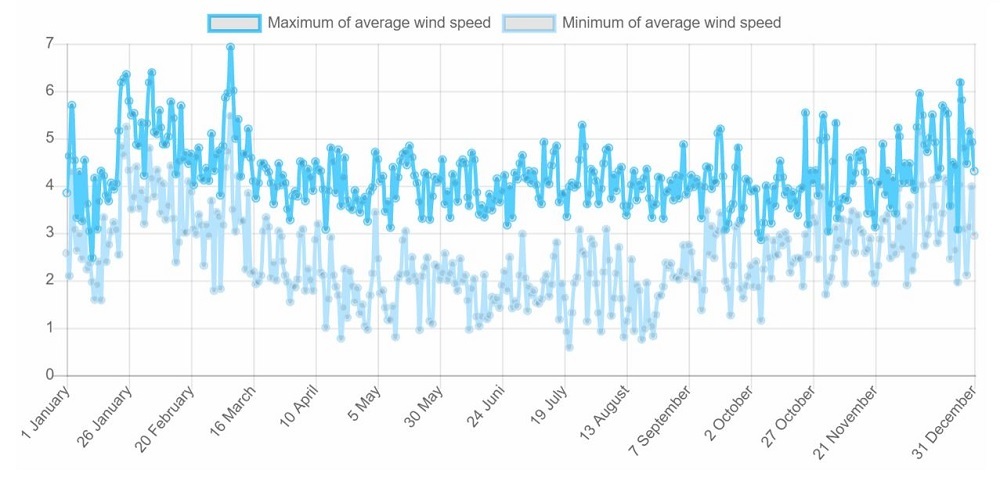
Energy Balance
According to [6], in 2022 in Croatia, the total primary energy production was 0.088 quadrillion Btu, while consumption was at 0.302 quadrillion Btu. Thus, the share of domestic production in primary energy consumption was 29.1%. This shows that Croatia is a country extremely dependent on energy imports. Primary energy consumption is dominated by oil – 38%, ahead of natural gas –29% and renewable resources – 28%. Coal accounts for the smallest share here – about 5% [6].
Source: U.S. Energy Information Administration (Mar 2024) / www.eia.gov
Figure 2. The production and consumption of fossil fuels in Croatia (coal – left, gas – in the center, oil – right)
Croatia's minor production of oil and natural gas has steadily declined over the past two decades, barring a few local spikes in production. Coal is consumed solely through imports, since there is no domestic resource base or production.
As Figure 3 shows, domestic electricity generation in Croatia lags far behind consumption. In the last decade, electricity consumption in the country was about 16 TWh, and production was about 10 to 14 TWh. However, in the last three years, there has been an annual increase in electricity generation, mainly from renewable sources.
Sources: U.S. Energy Information Administration (Mar 2024) / www.eia.gov | ||
| Figure 3. Electricity production in Croatia |
The chart of Croatia's energy indices is presented in the figure below.
Sources: 1. Crude oil proved reserves, 2021/International Energy Statistic/Geography/U.S. Energy Information Administration (Nov 2021)*98 2. Natural gas proved reserves 2021 / International Energy Statistic / Geography / U.S. Energy Information Administration (Nov 2021) *99 3. Total recoverable coal reserves 2019 / International Energy Statistic / Geography / U.S. Energy Information Administration (Nov 2021) *81 4. Combination production-consumption for Crude oil 2018 / International Energy Statistic / Geography / U.S. Energy Information Administration (Nov 2021) *219 5. Combination production-consumption for Natural gas 2019 / International Energy Statistic / Geography / U.S. Energy Information Administration (Nov 2021) *123 6. Combination production-consumption for Coal 2019 / International Energy Statistic / Geography / U.S. Energy Information Administration (Nov 2021) *128 7. Electricity – from other renewable sources (% of total installed capacity), 2017 est. / The World Factbook / Library / Central Intelligence Agency *170 8. GDP per unit of energy use (PPP per unit of oil equivalent), 2020 *66 Primary energy consumption - BP Statistical Review of World Energy 2021/BP;GDP (purchasing power parity) - The World Factbook/Library/Central Intelligence Agency 9. Energy use (primary energy use of oil equivalent per capita) 2020 *127 Primary energy consumption – BP Statistical Review of World Energy 2021; Population - United Nations, Department of Economic and Social Affairs, Population Division (2019). World Population Prospects 2019, custom data acquired via website. Retrieved 15 November 2021*66 10. The Global Energy Architecture Performance Index Report (EAPI) 2017 / Rankings / Reports / World Economic Forum 11. Electric power consumption (kWh per capita), 2016 *217 Electricity Consumption - The World Factbook/Library/Central Intelligence Agency; Population - United Nations, Department of Economic and Social Affairs, Population Division (2019). World Population Prospects 2019, custom data acquired via website. Retrieved 15 November 2021 12. Combination of electricity production-consumption (kWh)/The World Factbook/Library/Central Intelligence Agency *216 * Total number of countries participating in ranking | ||
| Figure 4. Energy indices of Croatia |
Due to the absence of coal deposits or limited fossil resources in the form of oil and gas, regarding the first six indices Croatia is positioned at the bottom of the chart. The indices for electricity – from other renewable sources, GDP per unit of energy use, The Global Energy Architecture Performance Index and Electric power consumption per capita look significantly better however. They have a value ranging from 0.7 to 0.8 in relation to the maximum value which equals one. As noted above, Croatia has a significant electricity deficit, which is reflected in the corresponding position in the diagram concerning combination of electricity production-consumption.
Energy Infrastructure
A territorial map showing distribution of the largest infrastructure projects of the fossil fuel sector in Croatia is displayed in Figure 5. As previously mentioned, oil reserves account for 30.1% of conventional proved reserves and natural gas for 69.9%. 
Figure 5. Basic infrastructure facilities of the fossil fuel sector in Croatia (click on the map to view a PDF version)
Natural gas production in Croatia is performed mainly in offshore areas in the southwest of the country. The gas reserves in the fields are small. For example, the reserves of the Annamaria Gas Field are estimated at 10 billion m3 and the Izabela Offshore Gas Field at 1.4 billion m3 [12]. A network of gas pipelines with a total length of about 2500 km connects the western, eastern and southern regions of the country. Not far from the port of Omišalj, a floating LNG terminal with a capacity of 2.9 billion m3 is located on the island of Krk [13].
The Croatian oil industry is represented by several small fields with total reserves of 71 million bbl, an oil terminal in Omisalj, a network of oil storage tanks, two refineries, and an oil pipeline originating in Omisalj and branching in Sisak to Szazhalombatta Refinery in Hungary and refineries in Serbia. Croatia's Rijeka Refinery and Sisak Refinery have a combined capacity of 90,000 bbl/d and are operated by INA [14].
In 2019 Croatia had 4.7 GW of electricity installed generating capacity. Croatia generated 14.19 TWh of electricity in 2022 [Figure 6]. Hydropower made the largest contribution to generation, almost 40%. The share of renewable energy was just over 25%. 
Figure 6. Electricity production in Croatia (click on the map to view a PDF version)
The largest hydro power plant in Croatia is the Zakučac Hydroelectric Power Plant with a capacity of about 0.5 GW [15]. The National electricity grid connects the southern and eastern regions of the country and is designed for 400 KV.
Renewable energy excluding hydroelectric power in Croatia is quite diverse and mainly represented by wind power. 
Figure 7. Renewable energy in Croatia (click on the map to view a PDF version)
In 2021, Croatia's wind farm park increased significantly as three large new wind farms were put into operation. Senj wind farm has a capacity of 156,000 kW and was built with the help of investments from the Chinese company Norinco [16]. Wind farm Padjene with a capacity of 129,600 kW has 36 turbines of 3,600 kW each, manufactured by the German company Nordex [17]. Another plant built this year is the Korlat wind farm with a capacity of 58 MW [18].
The solar energy industry in Croatia is much more limited. Only a few solar power plants have a capacity of more than 1 MW. The largest of them – solar power plant Vis has a capacity of 3.5 MW [19]. Several other plants are under construction, including Obrovac with a capacity of almost 7.5 MW.
In addition to wind and solar energy, various areas of bioenergy are developing quite dynamically in Croatia. Among them are electricity generation from biomass, production of pellets and biogas, gasification of biomass. Nevertheless, the contribution of bioenergy to the overall energy mix of the country is rather modest.
In February 2020, the Croatian government adopted a new Energy Strategy until 2030 including an outlook until 2050. The Strategy specifies that in the most optimistic scenario the share of renewable energy sources in total energy consumption should grow to 36.7% in 2030 and to 65.6% in 2050. At the same time, the share of electric and hybrid cars in total passenger traffic will be 4.5% in 2030 and up to 85% in 2050. The strategy includes a wide range of measures to improve energy efficiency, reduce dependence on fossil fuels, and modernize the electric grid [20]. The many scenarios independent experts for the period up to 2030 look more realistic, in which renewable energy sources, excluding hydropower, amount to 33-35%.
Education and Innovation
The following chart shows Croatia's positions in terms of education and innovation:
Sources: 1. The Global Innovation Index 2021, Rankings / Knowledge / World Intellectual Property Organization / Cornell University, INSEAD, and WIPO (2021): Energizing the World with Innovation. Ithaca, Fontainebleau, and Geneva *132 2. Patent Grants 2011-2020, resident & abroad / Statistical country profiles / World Intellectual Property Organization *185 3.Patents in Force 2020 / Statistical country profiles / World Intellectual Property Organization *109 4. QS World University Rankings 2022 *97 5. SCImago Country Rankings (1996-2020) / Country rankings / SCImago, (n.d.). SIR-SCImago Journal & Country Rank [Portal]. Retrieved 17 Nov 2021 *240 6. Internet users in 2018 / The World Factbook / Central Intelligence Agency *229 7. Internet users in 2018 (% Population) / The World Factbook / Central Intelligence Agency *229 8. Government expenditure on education, total (% of GDP), 2019 / United Nations Educational, Scientific, and Cultural Organization (UNESCO) Institute for Statistics. License: CCBY-4.0 / Data as of September 2021*177 9. Research and development expenditure (% of GDP), 2018 / UNESCO Institute for Statistics. License: CCBY-4.0 / Data *119 10. Scientific and technical journal articles, 2018 / National Science Foundation, Science and Engineering Indicators. License: CCBY-4.0 / Data *197 * Total number of countries participating in ranking | ||
| Figure 8. The indices of education and innovation in Croatia |
Most of Croatia's indexes describing the country's positioning in various international ranking lists related to education and innovation are above average. Croatia has the highest rankings in SCImago Country Rankings, The Global Innovation Index 2021 and Scientific and Technical Journal articles. Croatia is slightly below average in QS World University Rankings 2022 and Government expenditure on education, total % of GDP. In general, considering the relatively small population of the country, Croatia's position in this section looks more than convincing.
Ecology and Environment Protection
Indicators related to environmental issues are presented in the following diagram:
| Sources: 1. CO2 total emission by countries 2020 / European Commission / Joint Research Centre (JRC) / Emission Database for Global Atmospheric Research (EDGAR)*208 2. CO2 per capita emission 2020/European Commission/Joint Research Centre (JRC) / Emission Database for Global Atmospheric Research (EDGAR) *208 3. Forest area 2020 (% of land area) / The Global Forest Resources Assessment 2020 / Food and Agriculture Organization of the United Nations *234 4. Forest area change 2010-2020 (1000 ha/year) / The Global Forest Resources Assessment 2020 / Food and Agriculture Organization of the United Nations *234 5. The Environmental Performance Index (EPI) 2020 / Rankings / Yale Center for Environmental Law & Policy / Yale University *180 6. Annual freshwater withdrawals (m3 per capita), 2017 *179 Annual freshwater withdrawals, total (billion m3), 2017 – Food and Agriculture Organization, AQUASTAT data. /License: CC BY-4.0; Population – United Nations, Department of Economic and Social Affairs, Population Division (2019). World Population Prospects 2019, custom data acquired via website. Retrieved 15 November 2021 7. The National Footprint Accounts 2017 (Biocapacity Credit / Deficit) / Global Footprint Network *188 8. Methane emissions (kt of CO2 equivalent), 2018 / Data for up to 1990 are sourced from Carbon Dioxide Information Analysis Center, Environmental Sciences Division, Oak Ridge National Laboratory, Tennessee, United States. Data from 1990 are CAIT data: Climate Watch. 2020. GHG Emissions. Washington, DC: World Resources Institute. Available at: License : Attribution-NonCommercial 4.0 International (CC BY-NC 4.0) *191 9. The Climate Change Performance Index (CCPI) 2022 / Overall Results / Jan Burck, Thea Uhlich, Christoph Bals, Niklas Höhne, Leonardo Nascimento / Germanwatch, NewClimate Institute & Climate Action Network *60 * Total number of countries participating in ranking | ||
| Figure 9. Environmental Indices of Croatia |
Croatia's lack of significant fossil resources, especially coal, is reflected in the environmental index chart. For example, methane emissions in Croatia are low. The indicators of CO2 emissions are close to the average values. But on indicators like forest area change 2010-2020 and The Environmental Performance Index (EPI) 2020 Croatia is closely follows the world leaders. The worst values of Croatia are CO2 per capita emission and annual freshwater withdrawals, although they are in the middle of the chart. Thus, it should be noted that, according to the indicators presented in Figure 9, the environmental situation in Croatia is not of particular concern, although for some indicators it needs improvement.
References
[1] List of sovereign states and dependencies by area / Wikipedia / en.wikipedia.org/wiki/List_of_sovereign_states_and_dependencies_by_area
[2] List of countries and dependencies by population density / Wikipedia / en.wikipedia.org/wiki/List_of_countries_and_dependencies_by_population_density
[3] Croatia / The world factbook / Library / Central Intelligence Agency / www.cia.gov
[4] GDP, PPP (constant 2011 international $) / World Bank, International Comparison Program database. License: CC BY-4.0 / Data / The World Bank / www.worldbank.org
[5] GDP per capita, PPP (current international $) / World Bank, International Comparison Program database. License: CC BY-4.0 / Data / The World Bank / www.worldbank.org
[6] International Energy Statistic / Geography / Croatia /U.S. Energy Information Administration, 2021 / www.eia.gov/beta/international/
[7] Solar resource data obtained from the Global Solar Atlas, owned by the World Bank Group and provided by Solargis / Global Solar Atlas / globalsolaratlas.info
[8] Wind Map / Global Wind Atlas 2.0, a free, web-based application developed, owned and operated by the Technical University of Denmark (DTU) in partnership with the World Bank Group, utilizing data provided by Vortex, with funding provided by the Energy Sector Management Assistance Program (ESMAP). For additional information: globalwindatlas.info
[9] Agricultural land (% of land area) /Food and Agriculture Organization, electronic files and web site. License: CC BY-4.0 / Data / The World Bank / www.worldbank.org
[10] Forest area (% of land area) /Food and Agriculture Organization, electronic files and web site. License: CC BY-4.0 / Data / The World Bank / www.worldbank.org
[11] World Bank What a Waste / Data / The World Bank / www.worldbank.org
[12] abarrelfull.wikidot.com
[13] theodora.com/pipelines/index.html
[14] en.wikipedia.org/wiki/List_of_oil_refineries
[15] en.wikipedia.org/wiki/Energy_in_Croatia
[16] balkangreenenergynews.com/norinco-completes-senj-wind-farm-croatia-biggest-so-far/
vlada.gov.hr/news/senj-wind-farm-opened-for-trial-run-the-project-will-contribute-to-croatia-s-green-transition/33504
[17] www.thewindpower.net/windfarm_en_30509_padjene.php
[18] balkangreenenergynews.com/58-mw-korlat-heps-first-wind-farm-officially-starts-operation/
[19] The Solar Power Plant Vis, the largest solar plant in Croatia, put into Service - OIE
[20] Strategija energetskog razvitka Republike Hrvatske/ narodne-novine.nn.hr/clanci/sluzbeni/2020_03_25_602.html
The sources of charts and curves are specified under the images.
For more information about the energy industry in Croatia see here