

Contents
General State of the Economy
Georgia is a country located in the South Caucasus region at the crossroads of Western Asia and Eastern Europe. The country borders Russia to the north, Armenia and Turkey in the south and Azerbaijan to the southeast. Georgia is bounded on the west by the Black Sea, with a total coastline of 310 km.
According to 2023 statistics, Georgia is home to about 5 million people. In terms of population density the country is 166th in the world from 248 countries considered. The national capital and largest city is Tbilisi. The political form of government is a semi-presidential republic and the administrative map of the country is divided into 9 regions, 1 city, and 2 autonomous republics [1,2,3].
| Georgia | ||
|---|---|---|
| Capital: Tbilisi | Density: 57.6/km2 | Currency: Georgian lari (₾) (GEL) |
| Official languages: Georgian | Life expectancy at birth: 72.76 years | GDP (PPP): $80.611 billion (2023 est.) |
| National Day: 26 May | Area (land): 69,700 km2 | GDP - per capita (PPP): $21,922 (2023 est.) |
| Population: 4,927,228 (2023 est.) | Coastline: 310 km | Internet country code: .ge |
Source: [1,2,3,4,5]
Tbilisi, Georgia. Envato Elements. LW7GJ5V936
The rating positions of Georgia relative to other countries have been determined for an extensive list of economic, energy, innovative and educational indices, as well as for metrics reflecting the state of the environment. The economic indices include, for example, GDP per capita, annual average GDP growth, high-technology exports, and others. The list of energy indices includes proven reserves of oil, gas and coal, production-consumption ratio combined, and energy use, etc. Each of the indices has a ranked list of included member countries. Since the number of countries in each rating is different for each index, the positioning of the country of interest is displayed on a special chart, where the vertical axis is a uniform relative scale from 0 to 1, whereas the horizontal axis denominates the various indices and respective numbers relating to the descriptions given underneath.
Thus, in such a relative “0-1” diagram, the country’s position is marked with a dot in proportion to its location in the original rating list. If the country is among the leaders regarding the selected indicator, it will be marked close to 1 in the upper green zone on the relevant chart “0-1”, if the country is an outsider in the rating list, then it will be marked in the lower red zone of the chart “0-1”, etc.
Ranking position of Georgia for list of economic indices:
| Sources: 1. GDP (purchasing power parity), 2020 est. / The World Factbook/Library/Central Intelligence Agency *228 2. GDP - per capita (PPP), 2020 / The World Factbook/Library/Central Intelligence Agency *229 3. Inflation rate (consumer prices), 2019 est. / The World Factbook/Library/Central Intelligence Agency *228 4. Charges for the use of intellectual property, receipts (BoP, current US$), 2020 / International Monetary Fund, Balance of Payments Statistics Yearbook, and data files. / License: CC BY-4.0 *88 5. The Global Competitiveness Index 2019 / Rankings / Reports / World Economic Forum *141 6. High-technology exports (current US$) 2019-2020 / United Nations, Comtrade database through the WITS platform / License: CCBY-4.0 / Data *134 7. 2021 Index of Economic Freedom / International Economies / The Heritage Foundation *178 8. Reserves of foreign exchange and gold, 2017 est. / The World Factbook / Library / Central Intelligence Agency *195 9. Annual average GDP growth in %, for the last 10 years (2011-2020) / World Bank national accounts data, and OECD National Accounts data files / License: CC BY-4.0 *206 10. Public debt (% of GDP), 2017 est. / The World Factbook / Library / Central Intelligence Agency (from smallest to largest) *210 * Total number of countries participating in ranking Figure 1. Economic Indices of Georgia |
Half of Georgia's economic indices are below the world average, which indicates certain difficulties in the country's development. Of all the indices presented, Georgia has the highest values for the Index of Economic Freedom (0.93) and Average Annual GDP Growth in % (0.74). The weakest points in the Georgian economy are Charges for the use of intellectual property (0.16) and the Inflation rate (0.21).
Energy Resources
Georgia has no significant reserves of fossil fuels. For example, the share of oil reserves in the country relative to the world's reserves is 0.002%, the share of natural gas is 0.004%. The share of coal is slightly higher – 0.02%. In terms of tons of oil equivalent, according to 2024 data, conventional proved reserves by fuel type were: 3.1% – oil, 5% – gas, and 91.9% – coal (Fig.5).
Table 1. Fossil energy resources of Georgia
| Resource /Explanations | Crude oil* | Natural gas* | Coal | Tight Oil | Shale Gas |
|---|---|---|---|---|---|
| Value | 0.035 (0.002%) | 0.3 (0.004%) | 221.56 (0.02%) | - | - |
| Unit | billion barrels | Tcf | million short tons | - | - |
| Year | 2021 | 2020 | 2021 | - | - |
| Source | [6] | [6] | [6] | [-] | [-] |
* share of the country’s reserves in world total is provided in brackets
Of all renewable energy sources, hydropower has the greatest potential and the country relies heavily on it to meet its electricity needs. Thanks to its thousands of rivers, Georgia ranks among the highest in terms of water resources per capita, and hydropower provides about 80% of the country's electricity. According to the Ministry of Economy and Sustainable Development of Georgia, out of 26,000 rivers, 300 rivers can provide excellent opportunities for hydropower generation, yet only 22% of the total hydro potential has been utilized to date [7].
Table 2. Renewable energy resources of Georgia
| Resource/ explanations | Solar Potential (GHI)* | Wind Potential (50 м)* | Bio Potential (agricultural area) | Bio Potential (forest area) | Municipal Solid Waste |
|---|---|---|---|---|---|
| Value | 3.5 -4.1 | 4.0-7.0 | 34.2 | 40.6 | 0.60 |
| Unit | kWh/m2/day | m/s | % of land area | % of land area | kg/per capita/day |
| Year | 2020 | 2020 | 2020 | 2020 | 2018 |
| Source | [8] | [9] | [10] | [11] | [12] |
*for the majority of the territory of the country
In addition, Georgia has great potential for solar and wind energy resources, which remain largely untapped. Wind speeds can reach up to 7 m/s at a height of 50 m mainly in central part and along Georgia-Russia land border. During the year in most regions there are 250-280 sunny days and the annual average amount of sunshine hours is over 2000.The highest solar GHI intensity is 4.1-4.4 kWh/m2 per day, distributed in different parts of the country.
KUTAISI, GEORGIA
Latitüde: 42.27, Longitude: 42.63
Average speed: 4.61 m/s, Operational share: 61%
Average daily wind speed for 10 years of observations, m/s, 10 m above the ground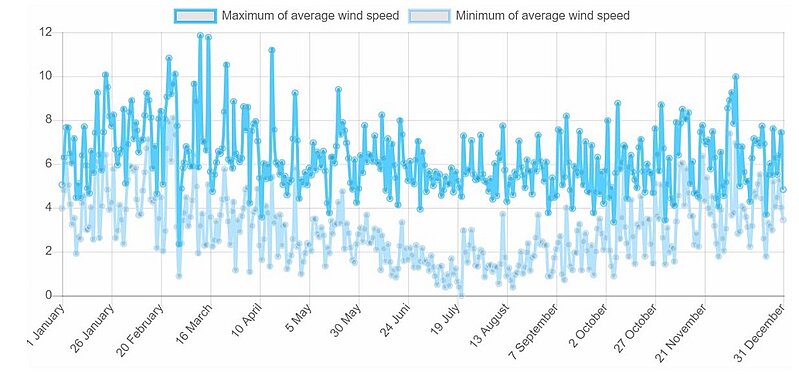
Source: based on NOAA U.S. Department of Commerce
Detailed information: Interactive map of wind resources
KUTAISI, GEORGIA
Latitüde: 42.27, Longitude: 42.63
Average daily sky coverage over 10 years of observations, %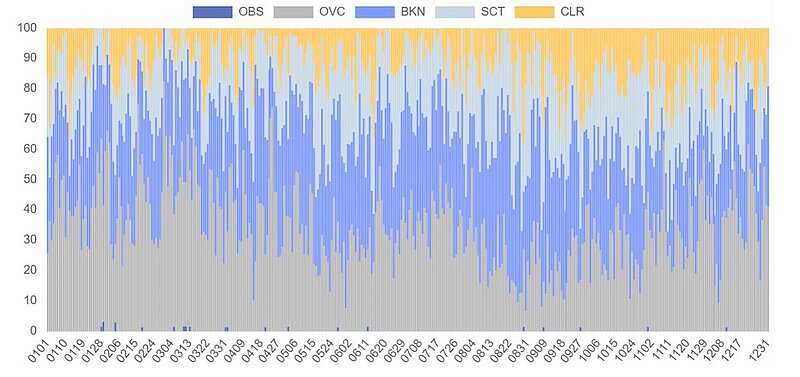
CLR - clear, SCT - scattered from 1/8 TO 4/8, BKN - broken from 5/8 TO 7/8, OVC - overcast, OBS - obscured, POB - partial obscuration
Source: based on NOAA U.S. Department of Commerce
Detailed information: Interactive map of solar resources
A rather extensive agricultural and forest area forms a decent resource base for the development of a number of bioenergy technologies, in particular, the production of biogas, bioethanol or biodiesel.
Energy Balance
According to [6], in 2022 in Georgia, the total production of primary energy was 0.043 quadrillion Btu, while consumption was at the level of 0.217 quadrillion Btu. Thus, the share of domestic production in primary energy consumption was about 19,8%. This makes Georgia a country heavily dependent on energy imports.
Source: U.S. Energy Information Administration (Mar 2024) / https://www.eia.gov
Figure 2. The Production and Consumption of fossil fuels in Georgia (left — coal, in the center — gas, right — oil)
As can be seen from the graph above, natural gas and crude oil consumption increased by a factor of about 2.5 between 2003 and 2022. Coal consumption has increased more than 30-fold in that time. Almost all fossil fuels are imported.
Sources: U.S. Energy Information Administration (Mar 2024) / https://www.eia.gov/ | ||
Figure 3. Electricity Generation in Georgia |
Total electricity consumption in Georgia almost doubled over the past ten years. In 2022, approximately 75.6% of electricity was produced by hydro power plants, 23.8% – by thermal power plants and 0.6% – by other renewables. The country has been experiencing a shortage of domestically produced electricity since 2019, and in 2021 about 15% of electricity was imported, the main reason for which was the partial stoppage of the Enguri hydroelectric dam. In 2022, the share of imports in the consumption decreased to 4.5% [13].
| Sources: 1. Crude oil proved reserves, 2021 / International Energy Statistic/Geography / U.S. Energy Information Administration (Nov 2021)*98 2. Natural gas proved reserves 2021 / International Energy Statistic / Geography / U.S. Energy Information Administration (Nov 2021) *99 3. Total recoverable coal reserves 2019 / International Energy Statistic / Geography / U.S. Energy Information Administration (Nov 2021) *81 4. Combination production-consumption for Crude oil 2018 / International Energy Statistic / Geography / U.S. Energy Information Administration (Nov 2021) *219 5. Combination production-consumption for Natural gas 2019 / International Energy Statistic / Geography / U.S. Energy Information Administration (Nov 2021) *123 6. Combination production-consumption for Coal 2019 / International Energy Statistic / Geography / U.S. Energy Information Administration (Nov 2021) *128 7. Electricity – from other renewable sources (% of total installed capacity), 2017 est. / The World Factbook / Library / Central Intelligence Agency *170 8. GDP per unit of energy use (PPP per unit of oil equivalent), 2020 *66 Primary energy consumption - BP Statistical Review of World Energy 2021/BP;GDP (purchasing power parity) - The World Factbook/Library/Central Intelligence Agency 9. Energy use (primary energy use of oil equivalent per capita) 2020 *127 Primary energy consumption – BP Statistical Review of World Energy 2021; Population - United Nations, Department of Economic and Social Affairs, Population Division (2019). World Population Prospects 2019, custom data acquired via website. Retrieved 15 November 2021*66 10. The Global Energy Architecture Performance Index Report (EAPI) 2017 / Rankings / Reports / World Economic Forum 11. Electric power consumption (kWh per capita), 2016 *217 Electricity Consumption - The World Factbook / Library / Central Intelligence Agency; Population - United Nations, Department of Economic and Social Affairs, Population Division (2019). World Population Prospects 2019, custom data acquired via website. Retrieved 15 November 2021 12. Combination of electricity production-consumption (kWh)/The World Factbook/Library/Central Intelligence Agency *216 * Total number of countries participating in ranking Figure 4. Energy indices of Georgia |
As Georgia does not have significant fossil fuel reserves, the country's positions for crude oil (0.18) and natural gas (0.21) reserves are the lowest of those shown in the chart above. Georgia is not included in the Electricity - from other renewable sources ranking, leaving this indicator blank. The country's strongest performance indicators are slightly above the world average and include, for example, Electricity consumption per capita (0.60) and the Combination of electricity production and consumption (0.55).
Energy Infrastructure
A territorial map showing distribution of the largest infrastructure projects of the fossil fuel sector in Georgia is displayed in Figure 5. Georgia is an important transit country for the region, with a number of major oil and gas pipelines running across its territory. Three terminals and storages located on the Black Sea coast provide a wide range of services for the storage and transportation of oil, oil products and natural gas. In addition, Vladikavkaz-Tbilisi Gas Pipeline includes Kvesheti compressor station in the north of the country.
The main international energy projects of Georgia are the Baku-Tbilisi-Supsa and Baku-Tbilisi-Ceyhan oil pipelines. The first of them was put into operation in 1999, the second in 2006. The volume of oil transportation through the Baku-Tbilisi-Supsa oil pipeline can reach 7 million tons per year, and through the Baku-Tbilisi-Ceyhan oil pipeline more than 50 million tons per year. However, the dependence of oil delivery on the conditions of the Bosphorus and Dardanelles straits and the insignificant capacity significantly reduced the competitiveness of the Baku-Tbilisi-Supsa oil pipeline. In this regard, pumping through this pipeline is often interrupted. On the other hand, the Baku–Tbilisi–Ceyhan oil pipeline provides direct access to the deep-water port of Ceyhan on the Mediterranean Sea. Therefore, the loading of this oil pipeline is 1.2 million barrels of oil daily.
Figure 5. Basic infrastructural facilities of the fossil fuel sector in Georgia
As already mentioned, up to 80% of the electricity produced in Georgia is generated by hydroelectric power plants. Hydro power plants are spread across the country with the main being the Enguri HPP, which generated the 26% of electricity produced in Georgia. According to the Transparency International Georgia report [13], by the end of 2022, Georgia had 109 hydropower plants, 5 thermal power plants and 1 wind power plant.
Figure 6. Electricity production and Renewable energy in Georgia
The 20.7 MW Qartli wind farm, located in Gori, about 90 km from Tbilisi, has been in operation since 2017 and is the first commercial wind farm built in Georgia. It accounts for about 0.6% of local electricity generation in Georgia.
Industrial cranes in sea port, Batumi, Georgia. Envato Elements. 2J3N6SLZ8K
Wind and solar technologies do not yet contribute significantly to electricity generation. The government plans to change the situation by introducing the potential of wind, solar, biomass and geothermal resources for the development of new energy capacities, which will reduce dependence on energy imports and increase the country's energy security. Georgia presented a draft National Energy and Climate Plan, one of the main objectives of which is to achieve a 27.4% share of renewable energy sources in gross final energy consumption by 2030, with 85% renewable energy sources for electricity, 10.45% – transportation, and 7% – heating and cooling [14].
Education and Innovation
The following chart shows Georgia’s positions in terms of education and innovation:
Sources: 1. The Global Innovation Index 2021, Rankings / Knowledge / World Intellectual Property Organization / Cornell University, INSEAD, and WIPO (2021): Energizing the World with Innovation. Ithaca, Fontainebleau, and Geneva *132 2. Patent Grants 2011-2020, resident & abroad / Statistical country profiles / World Intellectual Property Organization *185 3.Patents in Force 2020 / Statistical country profiles / World Intellectual Property Organization *109 4. QS World University Rankings 2022 *97 5. SCImago Country Rankings (1996-2020) / Country rankings / SCImago, (n.d.). SIR-SCImago Journal & Country Rank [Portal]. Retrieved 17 Nov 2021 *240 6. Internet users in 2018 / The World Factbook / Central Intelligence Agency *229 7. Internet users in 2018 (% Population) / The World Factbook / Central Intelligence Agency *229 8. Government expenditure on education, total (% of GDP), 2019 / United Nations Educational, Scientific, and Cultural Organization (UNESCO) Institute for Statistics. License: CCBY-4.0 / Data as of September 2021*177 9. Research and development expenditure (% of GDP), 2018 / UNESCO Institute for Statistics. License: CCBY-4.0 / Data *119 10. Scientific and technical journal articles, 2018 / National Science Foundation, Science and Engineering Indicators. License: CCBY-4.0 / Data *197 * Total number of countries participating in ranking | ||
Figure 7. The indices of education and innovation in Georgia |
The presented indices show that Georgia's performance in education and innovation is at average or below average level. The lowest spot in the country is the QS World University Rankings 2022 (0.11), which can be partly explained by relatively low government expenditure on education (0.21) and on research and development (0.27). Georgia has the highest position of those presented for SCImago Country Rankings (0.65) and Internet Users (0.58).
Ecology and Environment Protection
Indicators related to environmental issues are presented in the following diagram.
| Sources: 1. CO2 total emission by countries 2020 / European Commission / Joint Research Centre (JRC) / Emission Database for Global Atmospheric Research (EDGAR)*208 2. CO2 per capita emission 2020/European Commission/Joint Research Centre (JRC) / Emission Database for Global Atmospheric Research (EDGAR) *208 3. Forest area 2020 (% of land area) / The Global Forest Resources Assessment 2020 / Food and Agriculture Organization of the United Nations *234 4. Forest area change 2010-2020 (1000 ha/year) / The Global Forest Resources Assessment 2020 / Food and Agriculture Organization of the United Nations *234 5. The Environmental Performance Index (EPI) 2020 / Rankings / Yale Center for Environmental Law & Policy / Yale University *180 6. Annual freshwater withdrawals (m3 per capita), 2017 *179 Annual freshwater withdrawals, total (billion m3), 2017 – Food and Agriculture Organization, AQUASTAT data. /License: CC BY-4.0; Population – United Nations, Department of Economic and Social Affairs, Population Division (2019). World Population Prospects 2019, custom data acquired via website. Retrieved 15 November 2021 7. The National Footprint Accounts 2017 (Biocapacity Credit / Deficit) / Global Footprint Network *188 8. Methane emissions (kt of CO2 equivalent), 2018 / Data for up to 1990 are sourced from Carbon Dioxide Information Analysis Center, Environmental Sciences Division, Oak Ridge National Laboratory, Tennessee, United States. Data from 1990 are CAIT data: Climate Watch. 2020. GHG Emissions. Washington, DC: World Resources Institute. Available at: License : Attribution-NonCommercial 4.0 International (CC BY-NC 4.0) *191 9. The Climate Change Performance Index (CCPI) 2022 / Overall Results / Jan Burck, Thea Uhlich, Christoph Bals, Niklas Höhne, Leonardo Nascimento / Germanwatch, NewClimate Institute & Climate Action Network *60 * Total number of countries participating in ranking | ||
Figure 8. Environmental Indices of Georgia |
Most indices characterizing the country's position in various international rankings related to ecology and environmental protection are slightly above the world average level. Georgia has the highest positions in Annual freshwater withdrawals (0.65), Forest area (0.65) and Methane emissions (0.61).
Aerial view of Jvari Monastery, Mtskheta, Georgia. Envato Elements. VNY9DBJWM3
For two indicators – The Environmental Performance Index (0.43) and The National Footprint Accounts (0.47) – Georgia’s position is slightly below the world average. The country is not included into the Climate Change Performance Index leaving this indicator blank in the chart above.
References
[1] List of sovereign states and dependencies by area / Wikipedia / en.wikipedia.org/wiki/List_of_sovereign_states_and_dependencies_by_area
[2] List of countries and dependencies by population density / Wikipedia / en.wikipedia.org/wiki/List_of_countries_and_dependencies_by_population_density
[3] Georgia / The world factbook / Library / Central Intelligence Agency / www.cia.gov
[4] GDP, PPP (constant 2011 international $) / World Bank, International Comparison Program database. License: CC BY-4.0 / Data / The World Bank / www.worldbank.org
[5] GDP per capita, PPP (current international $) / World Bank, International Comparison Program database. License: CC BY-4.0 / Data / The World Bank / www.worldbank.org
[6] International Energy Statistic / Geography / U.S. Energy Information Administration / www.eia.gov/beta/international/
[7] Renewable Energy in Georgia Challenges and opportunities /October 2019 / PDF / https://unece.org/fileadmin/DAM/energy/se/pp/gere/GERE.6_Oct.2019/2_RE_Auctions/2_M.Arabidze_Georgia.6th.GERE.pdf
[8] Solar resource data obtained from the Global Solar Atlas, owned by the World Bank Group and provided by Solargis / Global Solar Atlas / globalsolaratlas.info
[9] Wind Map / Global Wind Atlas 2.0, a free, web-based application developed, owned and operated by the Technical University of Denmark (DTU) in partnership with the World Bank Group, utilizing data provided by Vortex, with funding provided by the Energy Sector Management Assistance Program (ESMAP). For additional information: globalwindatlas.info
[10] Agricultural land (% of land area) /Food and Agriculture Organization, electronic files and web site. License: CC BY-4.0 / Data / The World Bank / www.worldbank.org
[11] Forest area (% of land area) /Food and Agriculture Organization, electronic files and web site. License: CC BY-4.0 / Data / The World Bank / www.worldbank.org
[12] What a Waste 2.0 (PDF) / Resources / The World Bank / www.worldbank.org
[13] The Georgian Electricity Sector in the Years 2010-2022 / 11 April, 2023 / PDF / https://transparency.ge/en/post/georgian-electricity-sector-years-2010-2022
[14] Implementation Report Georgia / Energy Communication / https://www.energy-community.org/implementation/report/Georgia.html
The sources of charts and curves are specified under the images.
For more information about the energy industry in Georgia see here