

格鲁吉亚是一个位于南高加索地区、西亚和东欧交汇处的国家。该国北部与俄罗斯接壤,南部与亚美尼亚和土耳其接壤,东南部与阿塞拜疆接壤。格鲁吉亚西临黑海,海岸线总长310公里。
据2023年统计,佐治亚州约有500万人口。就人口密度而言,该国在 248 个国家中排名世界第 166位。国家首都和最大城市是第比利斯。政府的政治形式是半总统制共和国,国家行政版图分为9个地区、1个城市和2个自治共和国[1,2,3]。
| Georgia | ||
|---|---|---|
| Capital: Tbilisi | Density: 57.6/km2 | Currency: Georgian lari (₾) (GEL) |
| Official languages: Georgian | Life expectancy at birth: 72.76 years | GDP (PPP): $80.611 billion (2023 est.) |
| National Day: 26 May | Area (land): 69,700 km2 | GDP - per capita (PPP): $21,922 (2023 est.) |
| Population: 4,927,228 (2023 est.) | Coastline: 310 km | Internet country code: .ge |
Source: [1,2,3,4,5]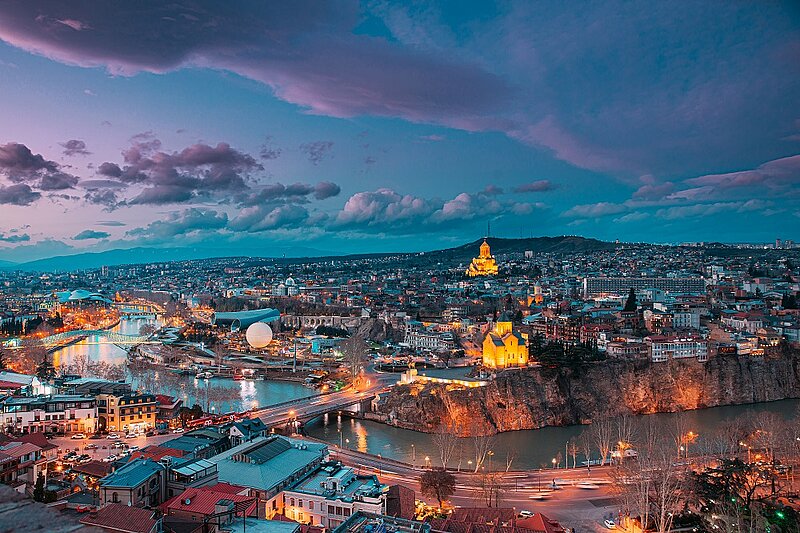
Tbilisi, Georgia. Envato Elements. LW7GJ5V936
格鲁吉亚相对于其他国家的评级位置是根据一系列广泛的经济、能源、创新和教育指数以及反映环境状况的指标确定的。经济指标包括人均GDP、年均GDP增长率、高新技术出口等。能源指数列表包括石油、天然气和煤炭的探明储量、产耗比以及能源使用量等。每个指数都有一个包含的成员国排名列表。由于每个指数的每个评级的国家数量不同,因此将感兴趣的国家的定位显示在一个特殊的图表上,其中纵轴是从0到1的统一相对刻度,而横轴表示各个指数以及与下面给出的描述相关的相应编号。
因此,在这样一个相对的“0-1”图中,该国家的位置按照其在原始评级列表中的位置成比例地用点来标记。如果该国在所选指标方面处于领先地位,则将在相关图表“0-1”的上部绿色区域中标记为接近 1,如果该国在评级列表中属于局外人,则将标记为接近 1在图表下方的红色区域“0-1”等。
格鲁吉亚经济指数列表排名:
| Sources: 1. GDP (purchasing power parity), 2020 est. / The World Factbook/Library/Central Intelligence Agency *228 2. GDP - per capita (PPP), 2020 / The World Factbook/Library/Central Intelligence Agency *229 3. Inflation rate (consumer prices), 2019 est. / The World Factbook/Library/Central Intelligence Agency *228 4. Charges for the use of intellectual property, receipts (BoP, current US$), 2020 / International Monetary Fund, Balance of Payments Statistics Yearbook, and data files. / License: CC BY-4.0 *88 5. The Global Competitiveness Index 2019 / Rankings / Reports / World Economic Forum *141 6. High-technology exports (current US$) 2019-2020 / United Nations, Comtrade database through the WITS platform / License: CCBY-4.0 / Data *134 7. 2021 Index of Economic Freedom / International Economies / The Heritage Foundation *178 8. Reserves of foreign exchange and gold, 2017 est. / The World Factbook / Library / Central Intelligence Agency *195 9. Annual average GDP growth in %, for the last 10 years (2011-2020) / World Bank national accounts data, and OECD National Accounts data files / License: CC BY-4.0 *206 10. Public debt (% of GDP), 2017 est. / The World Factbook / Library / Central Intelligence Agency (from smallest to largest) *210 * Total number of countries participating in ranking 图 1. 格鲁吉亚经济指数 |
格鲁吉亚一半经济指标低于世界平均水平,发展面临一定困难。在所有列出的指数中,格鲁吉亚的经济自由度指数 (0.93) 和年均 GDP 增长率 (0.74) 最高。格鲁吉亚经济的最弱点是知识产权使用费(0.16)和通货膨胀率(0.21)。
格鲁吉亚没有大量化石燃料储备。例如,该国石油储量相对于世界储量的份额为0.002%,天然气的份额为0.004%。煤炭的份额略高——0.02%。以吨油当量计算,根据2022年数据,按燃料类型划分的常规探明储量为:石油3.1%,天然气5%,煤炭91.9%(图5)。
表1.格鲁吉亚化石能源资源
| Resource /Explanations | Crude oil* | Natural gas* | Coal | Tight Oil | Shale Gas |
|---|---|---|---|---|---|
| Value | 0.035 (0.002%) | 0.3 (0.004%) | 221.56 (0.02%) | - | - |
| Unit | billion barrels | Tcf | million short tons | - | - |
| Year | 2021 | 2020 | 2021 | - | - |
| Source | [6] | [6] | [6] | [-] | [-] |
* 括号内提供了该国储量占世界总储量的比例 在
所有可再生能源中,水力发电潜力最大,该国严重依赖它来满足电力需求。格鲁吉亚拥有数千条河流,人均水资源占有量名列前茅,水力发电提供了全国约80%的电力。据格鲁吉亚经济和可持续发展部称,在26,000条河流中,有300条河流可以提供绝佳的水力发电机会,但迄今为止仅利用了总水力潜力的22%[7]。
表2.格鲁吉亚可再生能源资源
| Resource/ explanations | Solar Potential (GHI)* | Wind Potential (50 м)* | Bio Potential (agricultural area) | Bio Potential (forest area) | Municipal Solid Waste |
|---|---|---|---|---|---|
| Value | 3.5 -4.1 | 4.0-7.0 | 34.2 | 40.6 | 0.60 |
| Unit | kWh/m2/day | m/s | % of land area | % of land area | kg/per capita/day |
| Year | 2020 | 2020 | 2020 | 2020 | 2018 |
| Source | [8] | [9] | [10] | [11] | [12] |
*该国大部分领土
此外,格鲁吉亚的太阳能和风能资源潜力巨大,但大部分尚未开发。主要在中部地区和格鲁吉亚-俄罗斯陆地边界沿线,50 m 高度处的风速可达 7 m/s。大部分地区全年晴天数为250-280天,年平均日照时数在2000小时以上。太阳能GHI强度最高为4.1-4.4kWh/m 2每天,分布在全国不同地区。
KUTAISI, GEORGIA
Latitüde: 42.27, Longitude: 42.63
Average speed: 4.61 m/s, Operational share: 61%
Average daily wind speed for 10 years of observations, m/s, 10 m above the ground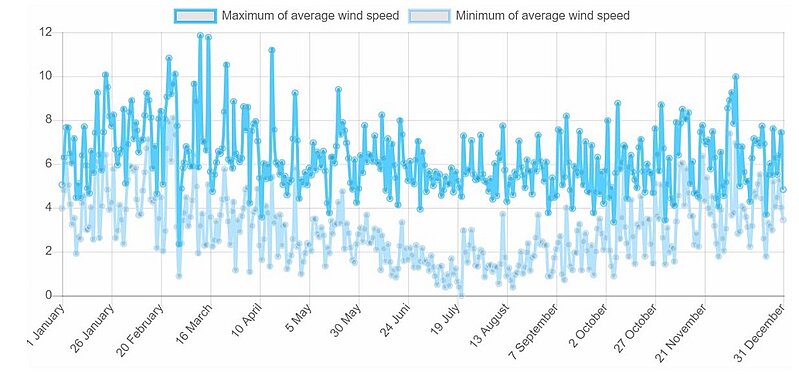
Source: based on NOAA U.S. Department of Commerce
Detailed information: Interactive map of wind resources
KUTAISI, GEORGIA
Latitüde: 42.27, Longitude: 42.63
Average daily sky coverage over 10 years of observations, %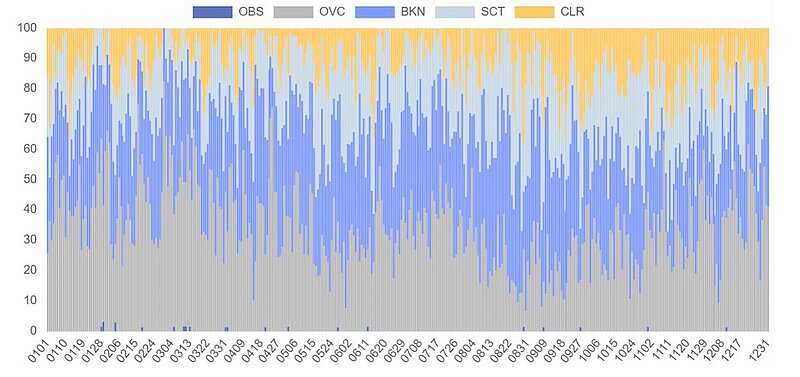
CLR - clear, SCT - scattered from 1/8 TO 4/8, BKN - broken from 5/8 TO 7/8, OVC - overcast, OBS - obscured, POB - partial obscuration
Source: based on NOAA U.S. Department of Commerce
Detailed information: Interactive map of solar resources
相当广阔的农业和森林面积为开发许多生物能源技术,特别是沼气、生物乙醇或生物柴油的生产提供了良好的资源基础。
根据[6],2022年格鲁吉亚一次能源总产量为0.043quadrillion Btu,而消费量为0.217 quadrillion Btu。因此,国内生产在一次能源消费中的份额约为19.8%。这使得格鲁吉亚成为一个严重依赖能源进口的国家。
Source: U.S. Energy Information Administration (Mar 2024) / https://www.eia.gov
图 2. 格鲁吉亚化石燃料的生产和消费(左 — 煤炭,中 — 天然气,右 — 石油)
从上图可以看出,2003年至2022年间,天然气和原油消耗量增加了约2.5倍。同期煤炭消耗量增加了30倍以上。几乎所有化石燃料都是进口的。
| Sources: U.S. Energy Information Administration (Mar 2024) / https://www.eia.gov/ | ||
图 3. 乔治亚州的发电量 |
过去十年,格鲁吉亚的总用电量几乎翻了一番。2022年,约75.6%的电力由水力发电厂生产,23.8%由火力发电厂生产,0.6%由其他可再生能源生产。该国自2019年以来一直出现国内电力短缺的情况,2021年约15%的电力依赖进口,主要原因是恩古里水电站大坝的部分停工。2022年,进口占消费的比重下降至4.5%[13]。
| Sources: 1. Crude oil proved reserves, 2021 / International Energy Statistic/Geography / U.S. Energy Information Administration (Nov 2021)*98 2. Natural gas proved reserves 2021 / International Energy Statistic / Geography / U.S. Energy Information Administration (Nov 2021) *99 3. Total recoverable coal reserves 2019 / International Energy Statistic / Geography / U.S. Energy Information Administration (Nov 2021) *81 4. Combination production-consumption for Crude oil 2018 / International Energy Statistic / Geography / U.S. Energy Information Administration (Nov 2021) *219 5. Combination production-consumption for Natural gas 2019 / International Energy Statistic / Geography / U.S. Energy Information Administration (Nov 2021) *123 6. Combination production-consumption for Coal 2019 / International Energy Statistic / Geography / U.S. Energy Information Administration (Nov 2021) *128 7. Electricity – from other renewable sources (% of total installed capacity), 2017 est. / The World Factbook / Library / Central Intelligence Agency *170 8. GDP per unit of energy use (PPP per unit of oil equivalent), 2020 *66 Primary energy consumption - BP Statistical Review of World Energy 2021/BP;GDP (purchasing power parity) - The World Factbook/Library/Central Intelligence Agency 9. Energy use (primary energy use of oil equivalent per capita) 2020 *127 Primary energy consumption – BP Statistical Review of World Energy 2021; Population - United Nations, Department of Economic and Social Affairs, Population Division (2019). World Population Prospects 2019, custom data acquired via website. Retrieved 15 November 2021*66 10. The Global Energy Architecture Performance Index Report (EAPI) 2017 / Rankings / Reports / World Economic Forum 11. Electric power consumption (kWh per capita), 2016 *217 Electricity Consumption - The World Factbook / Library / Central Intelligence Agency; Population - United Nations, Department of Economic and Social Affairs, Population Division (2019). World Population Prospects 2019, custom data acquired via website. Retrieved 15 November 2021 12. Combination of electricity production-consumption (kWh)/The World Factbook/Library/Central Intelligence Agency *216 * Total number of countries participating in ranking 图 4. 格鲁吉亚能源指数 |
由于格鲁吉亚没有大量化石燃料储量,因此该国的原油 (0.18) 和天然气 (0.21) 储量是上图中最低的。格鲁吉亚未包含在电力 - 来自其他可再生能源的排名中,因此该指标为空白。该国最强的绩效指标略高于世界平均水平,包括人均用电量 (0.60) 以及电力生产和消费组合 (0.55)。
图5显示了格鲁吉亚化石燃料行业最大基础设施项目分布的领土地图。格鲁吉亚是该地区重要的过境国,有多条主要石油和天然气管道穿过其领土。 位于黑海沿岸的三个码头和仓库为石油、石油产品和天然气的储存和运输提供广泛的服务。 此外,符拉迪克奥克兹-第比利斯天然气管道还包括位于该国北部的Kvesheti压缩机站。
格鲁吉亚的主要国际能源项目是巴库-第比利斯-苏萨和巴库-第比利斯-杰伊汉石油管道。 第一条于1999年投产,第二条于2006年投产。巴库-第比利斯-苏普萨石油管道的石油运输量可达每年700万吨,通过巴库-第比利斯-杰伊汉石油管道的石油运输量可达每年700万吨。 年产量5000万吨。 然而,石油输送对博斯普鲁斯海峡和达达尼尔海峡条件的依赖以及输送能力的微不足道使得巴库-第比利斯-苏萨石油管道的竞争力大幅下降。 在这方面,通过该管道的泵送经常被中断。 另一方面,巴库-第比利斯-杰伊汉石油管道可直接通往地中海杰伊汉深水港。 因此,这条石油管道的装载量为每天120万桶石油。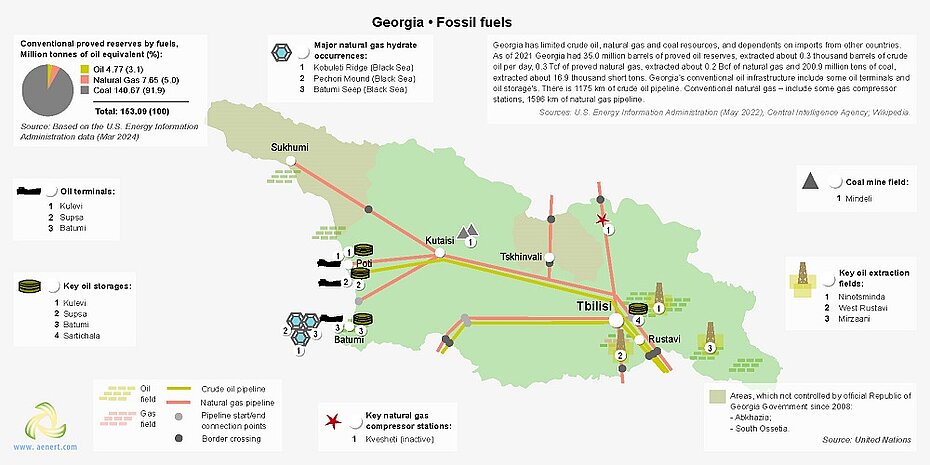
图5 格鲁吉亚化石燃料行业基础设施
如前所述,格鲁吉亚 80% 的电力是由水力发电厂生产的。 水力发电厂遍布全国各地,其中最主要的是 Enguri 水电站,该水力发电厂提供了格鲁吉亚 26% 的电力。 根据透明国际格鲁吉亚报告[13],截至2022年底,格鲁吉亚拥有109座水力发电厂、5座火力发电厂和1座风力发电厂。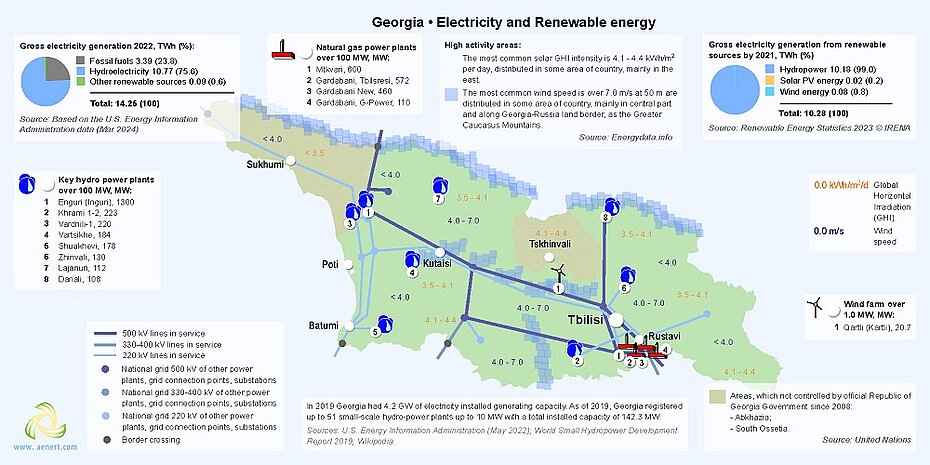
图 6. 格鲁吉亚的电力生产和可再生能源
20.7兆瓦的Qartli风电场位于距离第比利斯约90公里的哥里,自2017年开始运营,是格鲁吉亚建设的第一个商业风电场。 它约占格鲁吉亚当地发电量的0.6%。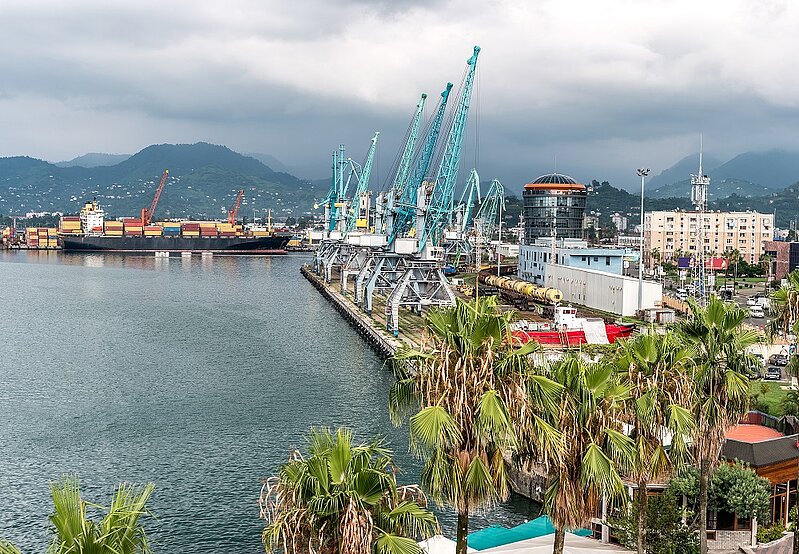
Industrial cranes in sea port, Batumi, Georgia. Envato Elements. 2J3N6SLZ8K
风能和太阳能技术尚未对发电做出重大贡献。 政府计划通过引入风能、太阳能、生物质能和地热资源的潜力来发展新能源产能,从而改变这种状况,这将减少对能源进口的依赖,增加国家的能源安全。 格鲁吉亚提出了国家能源和气候计划草案,其中主要目标之一是到2030年实现可再生能源占最终能源消费总量的27.4%,其中可再生能源85%用于电力,10.45%用于交通、 7% – 加热和冷却[14]。
Sources: 1. The Global Innovation Index 2021, Rankings / Knowledge / World Intellectual Property Organization / Cornell University, INSEAD, and WIPO (2021): Energizing the World with Innovation. Ithaca, Fontainebleau, and Geneva *132 2. Patent Grants 2011-2020, resident & abroad / Statistical country profiles / World Intellectual Property Organization *185 3.Patents in Force 2020 / Statistical country profiles / World Intellectual Property Organization *109 4. QS World University Rankings 2022 *97 5. SCImago Country Rankings (1996-2020) / Country rankings / SCImago, (n.d.). SIR-SCImago Journal & Country Rank [Portal]. Retrieved 17 Nov 2021 *240 6. Internet users in 2018 / The World Factbook / Central Intelligence Agency *229 7. Internet users in 2018 (% Population) / The World Factbook / Central Intelligence Agency *229 8. Government expenditure on education, total (% of GDP), 2019 / United Nations Educational, Scientific, and Cultural Organization (UNESCO) Institute for Statistics. License: CCBY-4.0 / Data as of September 2021*177 9. Research and development expenditure (% of GDP), 2018 / UNESCO Institute for Statistics. License: CCBY-4.0 / Data *119 10. Scientific and technical journal articles, 2018 / National Science Foundation, Science and Engineering Indicators. License: CCBY-4.0 / Data *197 * Total number of countries participating in ranking | ||
图 7. 格鲁吉亚的教育和创新指数 |
所提出的指数表明,格鲁吉亚在教育和创新方面的表现处于平均或低于平均水平。 该国排名最低的是 2022 年 QS 世界大学排名(0.11),部分原因是政府在教育(0.21)和研发(0.27)方面的支出相对较低。 格鲁吉亚在 SCImago 国家/地区排名 (0.65) 和互联网用户排名 (0.58) 中排名最高。
| Sources: 1. CO2 total emission by countries 2020 / European Commission / Joint Research Centre (JRC) / Emission Database for Global Atmospheric Research (EDGAR)*208 2. CO2 per capita emission 2020/European Commission/Joint Research Centre (JRC) / Emission Database for Global Atmospheric Research (EDGAR) *208 3. Forest area 2020 (% of land area) / The Global Forest Resources Assessment 2020 / Food and Agriculture Organization of the United Nations *234 4. Forest area change 2010-2020 (1000 ha/year) / The Global Forest Resources Assessment 2020 / Food and Agriculture Organization of the United Nations *234 5. The Environmental Performance Index (EPI) 2020 / Rankings / Yale Center for Environmental Law & Policy / Yale University *180 6. Annual freshwater withdrawals (m3 per capita), 2017 *179 Annual freshwater withdrawals, total (billion m3), 2017 – Food and Agriculture Organization, AQUASTAT data. /License: CC BY-4.0; Population – United Nations, Department of Economic and Social Affairs, Population Division (2019). World Population Prospects 2019, custom data acquired via website. Retrieved 15 November 2021 7. The National Footprint Accounts 2017 (Biocapacity Credit / Deficit) / Global Footprint Network *188 8. Methane emissions (kt of CO2 equivalent), 2018 / Data for up to 1990 are sourced from Carbon Dioxide Information Analysis Center, Environmental Sciences Division, Oak Ridge National Laboratory, Tennessee, United States. Data from 1990 are CAIT data: Climate Watch. 2020. GHG Emissions. Washington, DC: World Resources Institute. Available at: License : Attribution-NonCommercial 4.0 International (CC BY-NC 4.0) *191 9. The Climate Change Performance Index (CCPI) 2022 / Overall Results / Jan Burck, Thea Uhlich, Christoph Bals, Niklas Höhne, Leonardo Nascimento / Germanwatch, NewClimate Institute & Climate Action Network *60 * Total number of countries participating in ranking | ||
图 8. 格鲁吉亚的环境指数 |
我国在生态环保相关国际排名中的大部分指标略高于世界平均水平。 格鲁吉亚在年度淡水抽取量(0.65)、森林面积(0.65)和甲烷排放量(0.61)方面排名最高。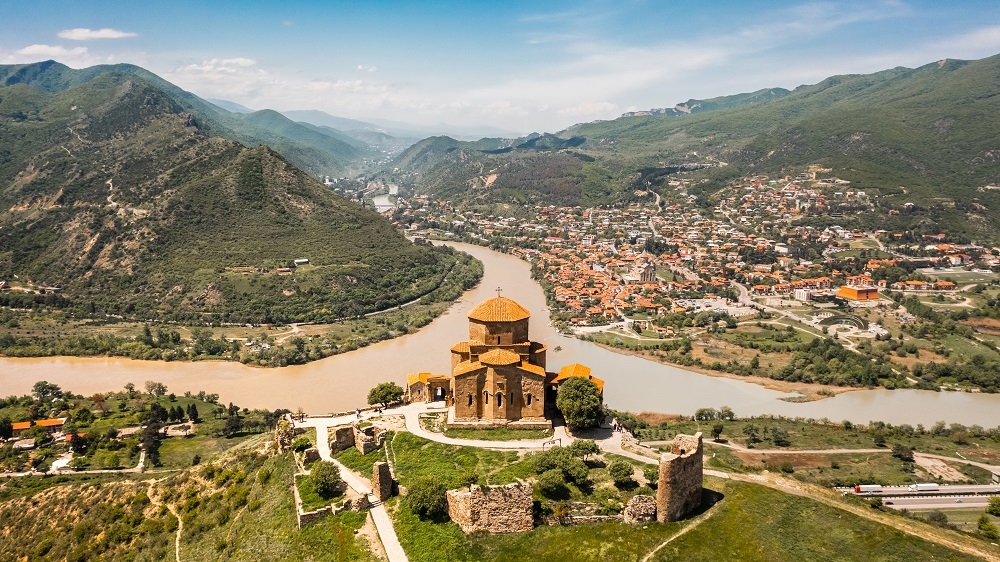
Aerial view of Jvari Monastery, Mtskheta, Georgia. Envato Elements. VNY9DBJWM3
对于两项指标——环境绩效指数(0.43)和国家足迹账户(0.47)——格鲁吉亚的排名略低于世界平均水平。 该国未纳入气候变化绩效指数,因此上图中该指标为空白。
[1] List of sovereign states and dependencies by area / Wikipedia / en.wikipedia.org/wiki/List_of_sovereign_states_and_dependencies_by_area
[2] List of countries and dependencies by population density / Wikipedia / en.wikipedia.org/wiki/List_of_countries_and_dependencies_by_population_density
[3] Georgia / The world factbook / Library / Central Intelligence Agency / www.cia.gov
[4] GDP, PPP (constant 2011 international $) / World Bank, International Comparison Program database. License: CC BY-4.0 / Data / The World Bank / www.worldbank.org
[5] GDP per capita, PPP (current international $) / World Bank, International Comparison Program database. License: CC BY-4.0 / Data / The World Bank / www.worldbank.org
[6] International Energy Statistic / Geography / U.S. Energy Information Administration / www.eia.gov/beta/international/
[7] Renewable Energy in Georgia Challenges and opportunities /October 2019 / PDF / https://unece.org/fileadmin/DAM/energy/se/pp/gere/GERE.6_Oct.2019/2_RE_Auctions/2_M.Arabidze_Georgia.6th.GERE.pdf
[8] Solar resource data obtained from the Global Solar Atlas, owned by the World Bank Group and provided by Solargis / Global Solar Atlas / globalsolaratlas.info
[9] Wind Map / Global Wind Atlas 2.0, a free, web-based application developed, owned and operated by the Technical University of Denmark (DTU) in partnership with the World Bank Group, utilizing data provided by Vortex, with funding provided by the Energy Sector Management Assistance Program (ESMAP). For additional information: globalwindatlas.info
[10] Agricultural land (% of land area) /Food and Agriculture Organization, electronic files and web site. License: CC BY-4.0 / Data / The World Bank / www.worldbank.org
[11] Forest area (% of land area) /Food and Agriculture Organization, electronic files and web site. License: CC BY-4.0 / Data / The World Bank / www.worldbank.org
[12] What a Waste 2.0 (PDF) / Resources / The World Bank / www.worldbank.org
[13] The Georgian Electricity Sector in the Years 2010-2022 / 11 April, 2023 / PDF / https://transparency.ge/en/post/georgian-electricity-sector-years-2010-2022
[14] Implementation Report Georgia / Energy Communication / https://www.energy-community.org/implementation/report/Georgia.html
图表和曲线的来源在图像下方指定。
有关佐治亚州能源工业的更多信息,请参见此处