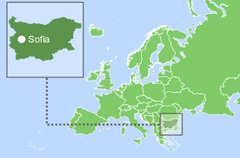

保加利亚,正式名称保加利亚共和国,是东南欧的一个国家,占据巴尔干半岛东部。该国北部与罗马尼亚接壤,南部与希腊和土耳其接壤,西部与塞尔维亚和北马其顿接壤。该国海岸线总长度为354公里[3]。
据2023年统计,保加利亚约有700万人口。就人口密度而言,该国在 248 个国家中排名世界第 158位。国家首都和最大城市是索非亚。政府的政治形式是议会共和制,国家行政版图分为28个省[1,2,3]。
| Bulgaria / Republic of Bulgaria | ||
|---|---|---|
| Capital: Sofia | Density: 63/km2 | Currency: Lev (BGN) |
| Official languages: Bulgarian | Life expectancy at birth: 73.61 years | GDP (PPP): $216.499 billion (2023 est.) |
| National Day: 03 March | Area (land): 110,993.6 km2 | GDP - per capita (PPP): $33,780 (2023 est.) |
| Population: 6,827,736 (2023 est.) | Coastline: 354 km | Internet country code: .bg |
Source: [1,2,3,4,5]
A beautiful aerial view from drone to the coastline, Black sea near Varna, Bulgaria. Envato. RZLB2QXP4M
保加利亚相对于其他国家的排名是根据一系列经济、能源、创新和教育指数以及反映环境状况的指标确定的。经济指标包括人均GDP、年均GDP增长率、高新技术出口等。能源指数列表包括石油、天然气和煤炭的探明储量、产耗比以及能源使用量等。每个指数都有一个包含的成员国排名列表。由于每个指数的每个评级的国家数量不同,因此将感兴趣的国家的定位显示在一个特殊的图表上,其中纵轴是从0到1的统一相对刻度,而横轴表示各个指数以及与下面给出的描述相关的相应编号。
因此,在这样一个相对的“0-1”图中,该国家的位置按照其在原始评级列表中的位置成比例地用点来标记。如果该国在所选指标方面处于领先地位,则将在相关图表“0-1”的上部绿色区域中标记为接近 1,如果该国在评级列表中属于局外人,则将标记为接近 1图表下方的红色区域为“0-1”等。所有国家均使用单一指数列表。如果某个国家/地区不在任何指数的排名列表中,则不会显示图表上的相应位置。
保加利亚经济指数排名:
| Sources: 1. GDP (purchasing power parity), 2020 est. / The World Factbook/Library/Central Intelligence Agency *228 2. GDP - per capita (PPP), 2020 / The World Factbook/Library/Central Intelligence Agency *229 3. Inflation rate (consumer prices), 2019 est. / The World Factbook/Library/Central Intelligence Agency *228 4. Charges for the use of intellectual property, receipts (BoP, current US$), 2020 / International Monetary Fund, Balance of Payments Statistics Yearbook, and data files. / License: CC BY-4.0 *88 5. The Global Competitiveness Index 2019 / Rankings / Reports / World Economic Forum *141 6. High-technology exports (current US$) 2019-2020 / United Nations, Comtrade database through the WITS platform / License: CCBY-4.0 / Data *134 7. 2021 Index of Economic Freedom / International Economies / The Heritage Foundation *178 8. Reserves of foreign exchange and gold, 2017 est. / The World Factbook / Library / Central Intelligence Agency *195 9. Annual average GDP growth in %, for the last 10 years (2011-2020) / World Bank national accounts data, and OECD National Accounts data files / License: CC BY-4.0 *206 10. Public debt (% of GDP), 2017 est. / The World Factbook / Library / Central Intelligence Agency (from smallest to largest) *210 * Total number of countries participating in ranking 图 1. 保加利亚经济指数 |
对于图表中显示的大部分经济指标,保加利亚都位于排名中位以上。保加利亚经济指标中最薄弱的部分是通货膨胀率(0.35)和年平均GDP增长率(0.42)。保加利亚的公共债务占 GDP 百分比 (0.86)、2021 年经济自由指数 (0.80) 以及外汇和黄金储备 (0.74) 的指数最好。
保加利亚没有大量化石燃料储备。在该国北部普列文地区和黑海大陆架蕴藏着少量石油和天然气,分别占世界总储量的0.001%和0.003%。此外,保加利亚还有一定的煤炭储量,占世界煤炭总储量的0.23%。
以吨油当量计算,根据2024年数据,常规探明储量中煤炭占99.6%,其次是天然气占0.3%,原油占0.1%(图5)
表1保加利亚 化石能源资源
| Resource /Explanations | Crude oil* | Natural gas* | Coal* | Shale Gas** | Tight Oil** | Oil Shale | Coalmine methane |
|---|---|---|---|---|---|---|---|
| Value | 0.02 (0.001%) | 0.2 (0.003%) | 2608 (0.23%) | 16.6 | 0.2 | 0.125 | 2.57 - 9.15 |
| Unit | billion barrels | Tcf | million short tons | Tcf | billion barrels | billion barrels | bcm |
| Year | 2021 | 2020 | 2021 | 2015 | 2015 | 2008 | 2020 |
| Source | [6] | [6] | [6] | [7] | [7] | [8] | [9] |
*括号内提供了该国在世界总储量中所占的份额
**技术上可采性未经证实
保加利亚估计拥有 5000 亿立方米页岩气,但现行立法不允许开采。在当地社区和环保人士的抗议之后,保加利亚于 2012 年禁止使用水力压裂技术勘探和生产页岩气。鉴于近期事态发展,为了减少保加利亚对俄罗斯能源资源的严重依赖,有专家呼吁解除页岩气开采禁令[10]。
表2保加利亚可再生能源资源
| Resource/ explanations | Solar Potential (GHI)* | Wind Potential (50 м)* | Bio Potential (agricultural area) | Bio Potential (forest area) | Hydro energy Potential** | Geothermal Potenial | Municipal Solid Waste |
|---|---|---|---|---|---|---|---|
| Value | 3.8-4.1 | 5.0-6.0 | 46.5 | 35.9 | 26 540 | 164 | 408 |
| Unit | kWh/m2/day | m/s | % of land area | % of land area | GWh/year | MWe | kg per capita |
| Year | 2020 | 2020 | 2020 | 2020 | 2013 | 2016 | 2021 |
| Source | [11] | [12] | [13] | [14] | [15] | [16] | [17] |
*适用于该国大部分领土
**总理论能力
保加利亚各类可再生能源发展潜力较大。这主要涉及陆上和海上风能,在该国东部黑海海岸线50 m高度处的风速高达6.5 m/s。黑海地区还有更重要的近海资源。
MOURGASH. BULGARIA
Latitüde: 42.83, Longitude: 23.67
Average speed: 8.74 m/s Operational share: 85%
Average daily wind speed for 10 years of observations, m/s, 10 m above the ground
Source: based on NOAA U.S. Department of Commerce
Detailed information: Interactive map of wind resources
MOURGASH. BULGARIA
Latitüde: 42.83, Longitude: 23.67
Average daily sky coverage over 10 years of observations, %
CLR - clear, SCT - scattered from 1/8 TO 4/8, BKN - broken from 5/8 TO 7/8, OVC - overcast, OBS - obscured, POB - partial obscuration
Source: based on NOAA U.S. Department of Commerce
Detailed information: Interactive map of solar resources
根据欧洲气候基金会委托最近进行的一项研究,保加利亚在技术上可以比目前的水平生产更多的风电占全国总用电量。多布里奇、瓦尔纳、舒门、拉兹格勒和锡利斯特拉这五个领先地区的风电总技术潜力非常高,总计 14.7 吉瓦。这几乎相当于目前整个保加利亚的用电量。然而,风电扩张的主要障碍是现有的电网基础设施,远未准备好接收如此巨量的电力[18]。
保加利亚具有很高的太阳辐射潜力,特别是在该国南部地区。太阳辐射强度GHI最高为4.1-4.4 kWh/m 2每天,分布在该国西南部的布拉戈耶夫格勒地区。如今,太阳能尚未得到充分利用,但无论是在家庭、机构层面还是大规模,都在高速发展。
水电在保加利亚的能源平衡中发挥着重要作用,具有很大的进一步开发潜力,例如在多瑙河上,罗马尼亚和保加利亚已就建设和未来联合运营两个水电项目达成一致。第一个容量为 840 MW 的发电厂将位于罗马尼亚的图尔努马古雷莱和保加利亚的尼科波尔之间[19]。
根据[6],2022年保加利亚一次能源总产量为0.473万亿英热单位,而消费量为0.737万亿英热单位。 因此,国内生产占一次能源消费的比重约为58.4%。 这使得保加利亚成为一个依赖能源进口的国家。
根据《BP 2022年世界能源统计年鉴》,2021年保加利亚一次能源消费总量为0.78艾焦耳[20]。
Source: U.S. Energy Information Administration (Sep 2023) / www.eia.gov
2. 保加利亚化石燃料的生产和消费(煤炭 – 左,天然气 – 中间,石油 – 右)
从图中可以看出综上所述,保加利亚的天然气和原油消耗量远远超过其低产量。因此,到2022年,石油消耗量将是国内产量的15倍,天然气需求量将是国内产能的100倍。如果我们看一下煤炭数据,煤炭产量略高于消费量。
Source: U.S. Energy Information Administration (Mar 2024) / www.eia.gov
3.保加利亚的电力生产
保加利亚电力完全自给自足,并出口部分国内生产的电力。上图所示的 10 年来,该国的发电量和消耗电量大致保持在同一水平。从发电来源分布来看,可再生能源比重略有上升,化石燃料比重有所下降。
根据保加利亚共和国输电系统运营商提供的统计数据[21],约41%的电力由核电厂产生,其次是火电厂——30.31%,水力发电——16%,太阳能发电——11% ,火力发电厂 – 10%,风能 – 5%,生物能源 – 0.46%。这些数据表明可再生能源在该国电力生产中的份额正在快速增长。
| Sources: 1. Crude oil proved reserves, 2021 / International Energy Statistic/Geography / U.S. Energy Information Administration (Nov 2021)*98 2. Natural gas proved reserves 2021 / International Energy Statistic / Geography / U.S. Energy Information Administration (Nov 2021) *99 3. Total recoverable coal reserves 2019 / International Energy Statistic / Geography / U.S. Energy Information Administration (Nov 2021) *81 4. Combination production-consumption for Crude oil 2018 / International Energy Statistic / Geography / U.S. Energy Information Administration (Nov 2021) *219 5. Combination production-consumption for Natural gas 2019 / International Energy Statistic / Geography / U.S. Energy Information Administration (Nov 2021) *123 6. Combination production-consumption for Coal 2019 / International Energy Statistic / Geography / U.S. Energy Information Administration (Nov 2021) *128 7. Electricity – from other renewable sources (% of total installed capacity), 2017 est. / The World Factbook / Library / Central Intelligence Agency *170 8. GDP per unit of energy use (PPP per unit of oil equivalent), 2020 *66 Primary energy consumption - BP Statistical Review of World Energy 2021/BP;GDP (purchasing power parity) - The World Factbook/Library/Central Intelligence Agency 9. Energy use (primary energy use of oil equivalent per capita) 2020 *127 Primary energy consumption – BP Statistical Review of World Energy 2021; Population - United Nations, Department of Economic and Social Affairs, Population Division (2019). World Population Prospects 2019, custom data acquired via website. Retrieved 15 November 2021*66 10. The Global Energy Architecture Performance Index Report (EAPI) 2017 / Rankings / Reports / World Economic Forum 11. Electric power consumption (kWh per capita), 2016 *217 Electricity Consumption - The World Factbook / Library / Central Intelligence Agency; Population - United Nations, Department of Economic and Social Affairs, Population Division (2019). World Population Prospects 2019, custom data acquired via website. Retrieved 15 November 2021 12. Combination of electricity production-consumption (kWh)/The World Factbook/Library/Central Intelligence Agency *216 * Total number of countries participating in ranking 图 4. 保加利亚能源指数 |
由于保加利亚没有大量化石燃料储量,因此该国在原油(0.15)和天然气(0.14)方面的地位是上图中最低的。因此,保加利亚石油(0.25)和天然气(0.30)的综合生产消费比率相对较低。图表中反映的最强指标是电力生产-消费组合(0.84)和其他可再生能源电力占总装机容量的百分比(0.76)。除此之外,该国在人均电力消耗方面处于有利地位(0.71)。
保加利亚有两个化石燃料生产区。第一个位于该国东部黑海大陆架,主要气田是加拉塔天然气田,位于瓦尔纳东南约25公里处。它的北面是保加利亚第一个发现的油田Tulenovo,也位于近海。其他基础设施,如天然气和炼油厂以及储存和码头也位于该国东部,用于处理该地区生产的石油和天然气以及进口产品。此外,保加利亚西北部普列文地区有一个陆上地区,正在开采天然气和石油。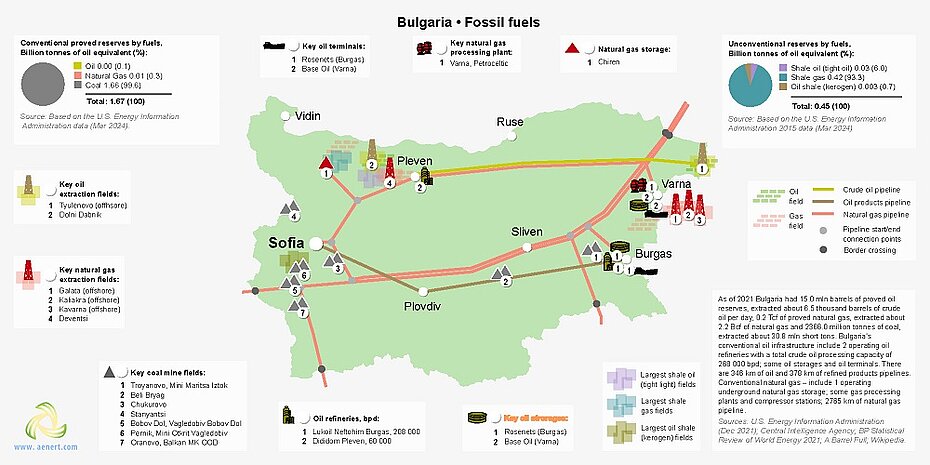
图5.保加利亚化石燃料行业的基本基础设施
尽管保加利亚国内天然气市场规模较小,但该国拥有广泛的天然气管道网络,通过向邻国土耳其、希腊和马其顿供应进口天然气,满足保加利亚及其邻国的需求。
保加利亚的煤炭矿藏主要位于该国西部地区和黑海附近。作为气候变化承诺的一部分,保加利亚宣布到 2040 年逐步淘汰煤炭,考虑到保加利亚煤炭工业的糟糕状况,这将是一个比使其符合排放标准更明智的解决方案,后者需要巨额资金投资[22]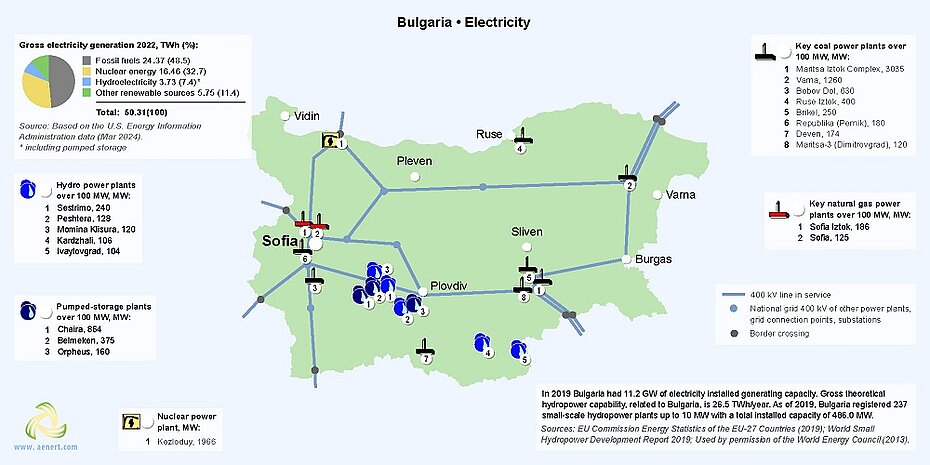
图 6. 保加利亚的发电量
如前所述,保加利亚电力的很大一部分(约 33%)是核电。该国目前在索非亚以北 200 公里的科兹洛杜伊运营着两座核电机组。2023年初,保加利亚政府宣布了到2053年的国家能源战略。能源部门发展的战略目标包括在科兹洛杜伊建设两座新反应堆和在贝莱尼建设两座新反应堆,提供4,000兆瓦的新增核电容量[23] 。
根据能源信息管理局数据,2022年,保加利亚约7.4%的电力由水力发电厂发电。塞斯特里莫位于里拉山脉东部的克里瓦河上,是该国最重要的水电项目,装机容量为 240 兆瓦。
图 7. 保加利亚的可再生能源
保加利亚大部分风电场位于该国东北部,其中位于多布里奇的 156 兆瓦圣尼古拉陆上发电厂是保加利亚最大的风电项目。
保加利亚连接国家电网的最大太阳能园区之一是 66 兆瓦的 Dalgo Pole,位于首都索非亚东南约 120 公里处,靠近普罗夫迪夫市 [24]。
根据保加利亚能源战略[23],该国的目标是到2030年太阳能发电量达到7吉瓦,风电发电量达到2吉瓦,到2050年太阳能发电量达到12吉瓦,风电发电量达到4吉瓦。此外,还有总计870兆瓦的太阳能发电和风电发电。计划到2030年新建水电项目,到2050年规划1,270兆瓦。此外,该行业未来发展的一个重要因素将是氢气生产,预计将减少和取代保加利亚对天然气进口的依赖。
| Sources: 1. The Global Innovation Index 2021, Rankings / Knowledge / World Intellectual Property Organization / Cornell University, INSEAD, and WIPO (2021): Energizing the World with Innovation. Ithaca, Fontainebleau, and Geneva *132 2. Patent Grants 2011-2020, resident & abroad / Statistical country profiles / World Intellectual Property Organization *185 3.Patents in Force 2020 / Statistical country profiles / World Intellectual Property Organization *109 4. QS World University Rankings 2022 *97 5. SCImago Country Rankings (1996-2020) / Country rankings / SCImago, (n.d.). SIR-SCImago Journal & Country Rank [Portal]. Retrieved 17 Nov 2021 *240 6. Internet users in 2018 / The World Factbook / Central Intelligence Agency *229 7. Internet users in 2018 (% Population) / The World Factbook / Central Intelligence Agency *229 8. Government expenditure on education, total (% of GDP), 2019 / United Nations Educational, Scientific, and Cultural Organization (UNESCO) Institute for Statistics. License: CCBY-4.0 / Data as of September 2021*177 9. Research and development expenditure (% of GDP), 2018 / UNESCO Institute for Statistics. License: CCBY-4.0 / Data *119 10. Scientific and technical journal articles, 2018 / National Science Foundation, Science and Engineering Indicators. License: CCBY-4.0 / Data *197 * Total number of countries participating in ranking 图 8. 保加利亚的教育和创新指数 |
描述该国在教育和创新相关的各种国际排名中的定位的大多数指数都高于平均水平。该国排名最低的是 2022 年 QS 世界大学排名(0.13),部分原因是政府教育支出相对较低(0.41)。保加利亚在 SCImago 国家排名 (0.77) 和 2021 年全球创新指数 (0.73) 中排名最高。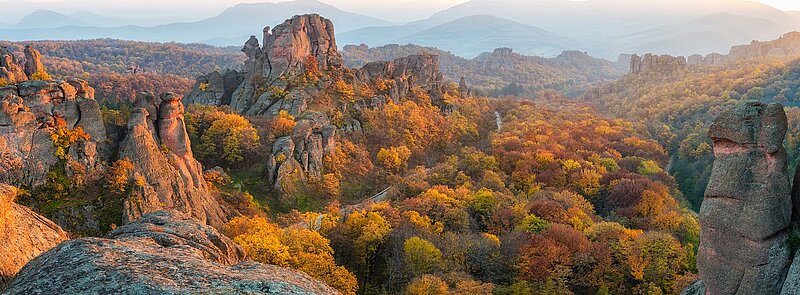
The Belogradchik rocks in Bulgaria. Envato. M976YKQ8C4
| Sources: 1. CO2 total emission by countries 2020 / European Commission / Joint Research Centre (JRC) / Emission Database for Global Atmospheric Research (EDGAR)*208 2. CO2 per capita emission 2020/European Commission/Joint Research Centre (JRC) / Emission Database for Global Atmospheric Research (EDGAR) *208 3. Forest area 2020 (% of land area) / The Global Forest Resources Assessment 2020 / Food and Agriculture Organization of the United Nations *234 4. Forest area change 2010-2020 (1000 ha/year) / The Global Forest Resources Assessment 2020 / Food and Agriculture Organization of the United Nations *234 5. The Environmental Performance Index (EPI) 2020 / Rankings / Yale Center for Environmental Law & Policy / Yale University *180 6. Annual freshwater withdrawals (m3 per capita), 2017 *179 Annual freshwater withdrawals, total (billion m3), 2017 – Food and Agriculture Organization, AQUASTAT data. /License: CC BY-4.0; Population – United Nations, Department of Economic and Social Affairs, Population Division (2019). World Population Prospects 2019, custom data acquired via website. Retrieved 15 November 2021 7. The National Footprint Accounts 2017 (Biocapacity Credit / Deficit) / Global Footprint Network *188 8. Methane emissions (kt of CO2 equivalent), 2018 / Data for up to 1990 are sourced from Carbon Dioxide Information Analysis Center, Environmental Sciences Division, Oak Ridge National Laboratory, Tennessee, United States. Data from 1990 are CAIT data: Climate Watch. 2020. GHG Emissions. Washington, DC: World Resources Institute. Available at: License : Attribution-NonCommercial 4.0 International (CC BY-NC 4.0) *191 9. The Climate Change Performance Index (CCPI) 2022 / Overall Results / Jan Burck, Thea Uhlich, Christoph Bals, Niklas Höhne, Leonardo Nascimento / Germanwatch, NewClimate Institute & Climate Action Network *60 * Total number of countries participating in ranking 图9. 保加利亚环境指数 |
保加利亚属于二氧化碳排放量较高的国家之一——二氧化碳排放总量(0.31)和人均排放量(0.26)。这一事实是其在 2022 年气候变化绩效指数 (0.31) 中排名较低的部分原因。另一方面,在积极指标中,森林面积(0.91)呈明显上升趋势,年淡水取水量(0.81)相对较高。
[1] List of sovereign states and dependencies by area / Wikipedia / en.wikipedia.org/wiki/List_of_sovereign_states_and_dependencies_by_area
[2] List of countries and dependencies by population density / Wikipedia / en.wikipedia.org/wiki/List_of_countries_and_dependencies_by_population_density
[3] Bulgaria / The world factbook / Library / Central Intelligence Agency / www.cia.gov
[4] GDP, PPP (constant 2011 international $) / World Bank, International Comparison Program database. License: CC BY-4.0 / Data / The World Bank / www.worldbank.org
[5] GDP per capita, PPP (current international $) / World Bank, International Comparison Program database. License: CC BY-4.0 / Data / The World Bank / www.worldbank.org
[6] International Energy Statistic / Geography / Bulgaria / U.S. Energy Information Administration / www.eia.gov/beta/international/
[7] World Shale Resource Assessments / U.S. Energy Information Administration (September 24, 2015) / https://www.eia.gov/
[8] 2010 Survey of Energy Resources (PDF) / 2010 / Uploads / World Energy Council / https://www.worldenergy.org/
[9] Potential for the utilization of coal methane/ aenert.com/technologies/fossil-fuel/unconventional-gas/coal-seam-methane/
[10] Bulgaria is rich with shale gas, but lacks political will to exploit it / 10. Juni 2022 / EURAKTIV / www.euractiv.com/section/energy/news/bulgaria-is-rich-with-shale-gas-but-has-no-political-will-to-exploit-it/
[11] Solar resource data obtained from the Global Solar Atlas, owned by the World Bank Group and provided by Solargis / Global Solar Atlas / globalsolaratlas.info
[12] Bulgaria Wind Map / Global Wind Atlas 2.0, a free, web-based application developed, owned and operated by the Technical University of Denmark (DTU) in partnership with the World Bank Group, utilizing data provided by Vortex, with funding provided by the Energy Sector Management Assistance Program (ESMAP). For additional information: globalwindatlas.info
[13] Agricultural land (% of land area) /Food and Agriculture Organization, electronic files and web site. License: CC BY-4.0 / Data / The World Bank / www.worldbank.org
[14] Forest area (% of land area) /Food and Agriculture Organization, electronic files and web site. License: CC BY-4.0 / Data / The World Bank / www.worldbank.org
[15] Hydro (PDF) / World Energy Council / https://www.worldenergy.org/
[16] 2016 Annual U.S. & Global Geothermal Power Production Report (PDF) / Geothermal Energy Association / http://geo-energy.org/
[17] Municipal waste statistics Updated / Statistics Explained / Eurostat / https://ec.europa.eu/eurostat/statistics-explained/index.php?title=Municipal_waste_statistics
[18] STUDY ON THE WIND POWER POTENTIAL IN BULGARIA, HUNGARY, AND ROMANIA. Countrz Report Bulfaria / 30 NOVEMBER 2023 / PDF / www.ait.ac.at/fileadmin/mc/energy/downloads/IES/Projekte/ECF_Study_on_the_Assessment_of_Wind_Potentials_-_Country_Report_Bulgaria__AIT__REKK__2023-11-30_.pdf
[19] Romania and Bulgaria agree to build two hydropower plants on Danube / January 23, 2023 / www.balkangreenenergynews.com/romania-and-bulgaria-agree-to-build-two-hydropower-plants-on-danube/
[20] BP Statistical Review of World Energy 2020-2022 (PDF) / BP / www.bp.com
[21] ESO.BG - Електроенергиен Системен Оператор / www.eso.bg
[22] Europe's coal exit / beyondfossilfuels.org/europes-coal-exit/
[23] Стратегическа визия за развитие на електроенергийния сектор на Република България / www.me.government.bg/uploads/manager/source/NRRP/%D0%B2%D0%B8%D0%B7%D0%B8%D1%8F_2023-2053_1.pdf
[24] Dalgo Pole, Bulgaria, 66 MWp / www.mounting-systems.com/en/solar-parks-large-scale-projects/referenzen-solarparks-grossprojekte/dalgo-pole-bulgaria-66-mwp/
图表和曲线的来源在图像下指定。
有关保加利亚能源行业的更多信息,请参见此处