
Contents
General State of the Economy
Iran, the official name – the Islamic Republic of Iran, is one of the largest countries in the Middle East with its capital in Tehran. Neighbouring countries are Iraq (in the west), Azerbaijan, Armenia, Turkey, Turkmenistan (in the north), Afghanistan and Pakistan (in the east). Iran has access to the Caspian Sea, the Persian and Oman Gulfs.
According to 2018 statistics, the country, which is 17th in the world in terms of area, is home to more than 86 million people. In terms of population density the country is 157th in the world [1,2,3]. The total length of the country's coastline is 2 440 km, and 740 km along the Caspian Sea [3].
The administrative map of Iran is divided into 31 provinces and the political form of government – Islamic republic. The official language is Persian [3].
The country's economy is based on its energy, agrarian, and industrial sectors, as well as its service sector.
| Sources: 1. GDP (purchasing power parity), 2020 est. / The World Factbook/Library/Central Intelligence Agency *228 2. GDP - per capita (PPP), 2020 / The World Factbook/Library/Central Intelligence Agency *229 3. Inflation rate (consumer prices), 2019 est. / The World Factbook/Library/Central Intelligence Agency *228 4. Charges for the use of intellectual property, receipts (BoP, current US$), 2020 / International Monetary Fund, Balance of Payments Statistics Yearbook, and data files. / License: CC BY-4.0 *88 5. The Global Competitiveness Index 2019 / Rankings / Reports / World Economic Forum *141 6. High-technology exports (current US$) 2019-2020 / United Nations, Comtrade database through the WITS platform / License: CCBY-4.0 / Data *134 7. 2021 Index of Economic Freedom / International Economies / The Heritage Foundation *178 8. Reserves of foreign exchange and gold, 2017 est. / The World Factbook / Library / Central Intelligence Agency *195 9. Annual average GDP growth in %, for the last 10 years (2011-2020) / World Bank national accounts data, and OECD National Accounts data files / License: CC BY-4.0 *206 10. Public debt (% of GDP), 2017 est. / The World Factbook / Library / Central Intelligence Agency(from smallest to largest) *210 * Total number of countries participating in ranking Figure 1. Economic Indices of Iran |
The expansion of international sanctions and the reduction of oil exports in 2012, which constitute a significant part of the country's GDP; an inefficient domestic policy, a high level of dependence on oil and gas exports; all this negatively affects the economic performance of the country, which is reflected in the diagram (Fig.1).
For five out of ten indicators, the country is either not represented, or is significantly below the world average.
Between the early 1990s the country experienced sustained GDP growth at purchasing power parity, both in general and per capita [4,5]. GDP at purchasing power parity increased from $666.2 billion in 2001 to $1.045 trillion in 2011 [3]. Then the dynamics of GDP was changeable and amounted to 1.062 trillion in 2020 [4]. GDP per capita at purchasing power parity was $10.5 in 2001, $18.0 in 2011 and $13.3 in 2020 [5], but according to [3] - $12.4 in 2020 (120th in the world). The inflation rate rose from 9.1% in 2016 to 9.6% in 2017. According to this indicator the country is 210th in the world [3]. In terms of the market value of publicly traded shares in 2015, the country was 43rd in the world, behind neighboring Qatar and Kuwait. According to The Global Competitiveness Report 2019, presented by the World Economic Forum, Iran is 99th from an estimated total of 137 countries. This rating reflects the effectiveness of the use of the country’s own resources for sustainable development. In addition to a number of economic indicators this index also takes into account such variables as education, health, level of innovation, etc.
According to the Index of Economic Freedom in 2021, which takes into account business freedom, freedom from government action, protection of property, and freedom from corruption, Iran was 168th out of 178 countries and is included in the group “mostly unfree”. In terms of reserves of foreign exchange and gold, Iran was 22nd in 2017, behind only Saudi Arabia among the Arab countries.
According to the indicator for the average GDP growth in percentage over the last 10 years, in 2020 the country was 174th out of 206 countries, ahead of Egypt. In terms of public debt, calculated as a percentage of the country's GDP, Iran was ranked 132nd out of 210 countries considered in 2017.
Energy Resources
Iran has one of the largest reserves of proved oil and natural gas reserves (see Table 1). In terms of tons of oil equivalent, in 2015-2018 proved reserves of conventional hydrocarbons in Iran were: natural gas – 57.7%, oil – 40.7%, coal – 1.6% (Fig.5).
According to the U.S. Energy Information Administration [6], as of 2021, the proven oil reserves were 209 billion barrels, and according to [3,7] at the beginning of 2018, they were estimated at between 157.2 – 157.8 billion barrels.
Table 1. Fossil energy resources of Iran
| Resource /Explanations | Crude oil | Natural gas | Coal | Shale Gas | Tight Oil |
|---|---|---|---|---|---|
| Value | 157.2 | 33.72 | 1 203 | no data | no data |
| Unit | million bbl | Tcm | million tonnes | - | - |
| Year | 2018 | 2018 | 2015 | - | - |
| Source | [3] | [3] | [9] | - | - |
Proved natural gas reserves in Iran at the end of 2017, according to the Oil and Gas Journal [6], were estimated at 1,191 Tcf, and at the beginning of 2018 were 33.72 trillion m3 [3]. According to BP the natural gas reserves in the country at the end of 2020 were 32.1 trillion m3 [7]. According to the National Iranian Oil Company, in 2016 oil reserves in the country are estimated at 711.53 billion barrels, of which 102.44 billion barrels are recoverable, gas resources are estimated at 55.33 trillion m3, of which about 33.72 trillion m3 can be extracted [8]. Coal reserves in 2015 were estimated at 1 203 million tons [9].
Iran has a variety of renewable resources for energy production. The sample of key indicators of this type of resource is presented in Table 2.
The level of global horizontal irradiation for the majority of the country is low – 5.5-6.0 kWh/m2/day, the maximum level of solar radiation of 6.0-6.3 kWh/m2/day can be registered in the south-eastern part of the country [10]. The distribution of wind resources is as follows: for the majority of the country the wind speed does not exceed 6.0-7.5 m/s, and in the eastern part of the country, in the provinces of South Khorasan as well as along the borderline with Afghanistan at a height of 50 m, wind speed can reach over 7.5 m/s [11].
Table 2. Renewable energy resources of Iran
| Resource/ Explanations | Solar Potential (GHI)* | Wind Potential (50 м)* | Hydro energy Potential** | Bio Potential (agricultural area) | Bio Potential (forest area) | Geothermal Potential | Municipal Solid Waste |
|---|---|---|---|---|---|---|---|
| Value | 5.5-6.0 | 6.0-7.5 | 50 000 | 28.2 | 6.6 | 800 | 0.16 |
| Unit | kWh/m2/day | m/s | GWh/year | % of land area | % of land area | GWe | kg/per capita/day |
| Year | 2018 | 2018 | 2013 | 2016 | 2016 | 2015 | 2012 |
| Source | [10] | [11] | [12] | [13] | [14] | [15] | [16] |
*for most of the territory of the country
**technically exploitable capability
Technically exploitable hydropower capability was estimated at 50 000 GWh/year in 2013 [12], which theoretically allows intensive use of hydro resources for electricity generation.
About 28.2% of Iran is covered by agricultural land, and 6.6% is forested [13,14]. Iran also has potential for geothermal energy, estimated by [15] in 2015 at 800 GWe.
The level of generation of municipal waste in Iran (0.16 kg per person per day) is significantly lower than in other countries of the region, for example, Saudi Arabia (1.3 kg per person per day). A small increase of up to 0.6 kg per person per day is predicted by 2025 [16]. This resource can be a valuable raw material for secondary use or energy production.
Energy Balance
According to BP's report, total primary energy consumption in 2020 amounted to 12.03 Exajoules, about 69.8% of which was natural gas, 27.5% – oil, 0.65% – coal, 0.6% – nuclear energy, 1.6% – hydroelectricity [7].
Iran is one of the top ten largest oil producers in the world [6]. The production of oil in Iran decreased slightly between 2011 and 2013 (Fig.2.), then again showed a slight increase and reached 4 695 000 barrels/day in 2017, consumption remained fairly stable with small annual fluctuations. In 2019 this figure was 3 332 thousand barrels/day [17]. The BP review presents next figures: the production and consumption of oil in Iran in 2020 – 3 084 000 barrels/day and 1 715 000 barrels/day, respectively [7].
Source: U.S. Energy Information Administration (Dec 2021) / www.eia.gov
Figure 2. The Production and Consumption of fossil fuels in Iran (left — coal, in the center – gas, right — oil )
Due to international sanctions, the production and export of crude oil and condensate from Iran fell in 2018-2019, in 2017 the country exported about 363 000 barrels/day [6]. The main importers of Iranian oil and condensate are China (51%), Malaysia, Syria, UAE [6].
Iran is the third largest gas producer in the world after the US and Russia [6]. The production of natural gas in the country has grown since 2000, and in 2019 it was 8 389 Bcf [17]. According to BP gas production in the country at the end of 2020 amounted to 250.8 Bcm [7]. Natural gas consumption, as well as production in the country since 2000 grew rapidly (Fig.2), reaching 7 794 Bcf in 2019 [17]. According to BP Statistical Review of World Energy June 2021 [7], gas consumption was estimated at 233.1 Bcm in 2020.
The import of natural gas to Iran in 2017 was 3.993 bcm, with exports of 11.64 bcm [3]. Imports and exports of natural gas are carried through pipelines, imports come from Turkmenistan, the largest share of exports (73%) was sent to Turkey [6].
Coal production in the period from 2014 remained stable, not exceeding 1.88 million short tons [17]. Consumption of coal in the country between 2007 and 2014 decreased (allowing the export of this resource since 2011) and in 2020 reached a level of 1.6 million short tons [17], and according to BP's report in 2020, amounted to 0.07 Exajoules [7].
Historically, Iran mainly relies on fossil resources for electricity production (Fig. 3).
Sources: U.S. Energy Information Administration (Dec 2021) / www.eia.gov | ||
| Figure 3. Electricity production in Iran |
Electricity production in Iran in 2020 was 304 TWh, dominated by fossil fuels – 89%; the share of hydropower was 9.1%, nuclear power – 1.9%, renewable resources – 0.3% (Fig.6).
Iran’s position in the comparative diagram of energy index is shown in Figure 4. As already mentioned, Iran has significant reserves of fossil resources, so the first six indexes are mostly in the top quarter of the chart, therefore, among the top 25% of the best countries in the world included in the rating.
The share of renewable energy in electricity production in Iran is about 0.1%, and in 2015 the country was 159th out of 166 countries selected for consideration.
| Sources: 1. Crude oil proved reserves, 2021 / International Energy Statistic/Geography / U.S. Energy Information Administration (Nov 2021)*98 2. Natural gas proved reserves 2021 / International Energy Statistic / Geography / U.S. Energy Information Administration (Nov 2021) *99 3. Total recoverable coal reserves 2019 / International Energy Statistic / Geography / U.S. Energy Information Administration (Nov 2021) *81 4. Combination production-consumption for Crude oil 2018 / International Energy Statistic / Geography / U.S. Energy Information Administration (Nov 2021) *219 5. Combination production-consumption for Natural gas 2019 / International Energy Statistic / Geography / U.S. Energy Information Administration (Nov 2021) *123 6. Combination production-consumption for Coal 2019 / International Energy Statistic / Geography / U.S. Energy Information Administration (Nov 2021) *128 7. Electricity – from other renewable sources (% of total installed capacity), 2017 est. / The World Factbook / Library / Central Intelligence Agency *170 8. GDP per unit of energy use (PPP per unit of oil equivalent), 2020 *66 Primary energy consumption - BP Statistical Review of World Energy 2021/BP;GDP (purchasing power parity) - The World Factbook/Library/Central Intelligence Agency 9. Energy use (primary energy use of oil equivalent per capita) 2020 *127 Primary energy consumption – BP Statistical Review of World Energy 2021; Population - United Nations, Department of Economic and Social Affairs, Population Division (2019). World Population Prospects 2019, custom data acquired via website. Retrieved 15 November 2021*66 10. The Global Energy Architecture Performance Index Report (EAPI) 2017 / Rankings / Reports / World Economic Forum 11. Electric power consumption (kWh per capita), 2016 *217 Electricity Consumption - The World Factbook / Library / Central Intelligence Agency; Population - United Nations, Department of Economic and Social Affairs, Population Division (2019). World Population Prospects 2019, custom data acquired via website. Retrieved 15 November 2021 12. Combination of electricity production-consumption (kWh)/The World Factbook/Library/Central Intelligence Agency *216 * Total number of countries participating in ranking Figure 4. Energy indices of Iran |
In the Energy Architecture Performance Index 2017, which is based first on the level economic growth, environmental safety, and energy independence of the country, including access to energy, Iran lost 14 ranking positions over the previous year, and is 120th in the world, ahead of Saudi Arabia, Oman and Lebanon. Iran is in the bottom half of the ranked list of countries for such indicators as GDP per unit of energy use in 2017 – 58th out of 66 countries considered, while energy consumption per capita is much lower – 28th out of 66 countries.
In terms of electricity consumption per capita, the country is 89th in the world, however, for the indicator of combination of electricity production-consumption, Iran is 14th in the ranked list of 216 countries.
Energy Infrastructure
A territorial map of the distribution of the largest infrastructure projects of the fossil fuel sector in Iran is shown in Figure 5.
As mentioned above, the proven reserves of natural gas account for 57.7% of the total energy potential of the country's mineral resources, crude oil reserves– 40.7%, coal 1.6% (Fig.5).
The main oil and gas fields are located in the west and south-west of the country in coastal areas. The South Pars gas field, which is located on the border between Iran and Qatar in the Persian Gulf, contains about 14 trillion m3 of natural gas and 18 billion barrels of gas condensate, which is about half of the gas reserves in Iran. South Pars field daily produces 790 million m3 of natural gas [18]. The largest oil field – Ahvaz, owned by the National Iranian South Oil Company, potentially possesses 65.5 billion barrels, and production is carried out at the level of 750 000 barrels/day [19].
Iran's refineries have a total installed capacity of 1 901 million barrels/day (Fig.5). The country's largest refinery is Abadan, owned by NIORDC, with an installed capacity of 399 000 barrels/day [20]. The main oil terminal of Iran is Khark Oil Terminal, which can ship up to 8 million barrels a day, and the largest oil storage is Kharg Island (28 million barrels) [21]. Crude oil is transported through pipelines with a total length of 8 625 km. The total length of oil product pipelines is 7 937 km, and transportation of liquefied hydrocarbon gas is carried through pipelines with a total length of 570 km (Fig.5).

Figure 5. Basic infrastructural facilities of the fossil fuel sector in Iran
The natural gas processing infrastructure in Iran is represented by 8 large, and several smaller plants (Fig.5). The most powerful of these is Kangan-Nar with an installed capacity of 80 mcm/d [22]. The country's first LNG-terminal, Iran LNG, which is currently under construction, will have an installed capacity of 10.8 million tons per year and will be located in an area of 200 hectares on the western coast of the Islamic Republic of Iran in Tombaka [23]. Natural gas is transported through pipelines with a total length of 20 794 km; transportation of gas condensate is carried through pipelines with total lengths of 973 km and 7 km (Fig.5).
In 2014, GTL QESHM was established in Iran to build the first GTL plant in the country. In the free zone QESHM, with a area of 40 hectares, the company is continuing to build a plant with an installed capacity of 3 000 barrels of various petroleum products per day, with the possibility of expanding to 12 000 barrels per day [24]. Zagros Petrochemical Company methanol plant with an installed capacity of 3 300 000 tons/year is located in the economic zone of South Pars in the city of Assaluyeh [25].
The annual production of uranium from the Saghand mine located in Yazd in the central part of Iran is about 50 tons per year. The reserves of this field are estimated by experts of the IAEA to be at 1 000 tons [26]. Coal production from the country's largest field, Eshkli, is maintained at the level of 360 000 tons per year [27].
The map of the territorial distribution of Iran's largest infrastructure facilities for electricity generation is presented in Figure 6.
According to U.S. Energy Information Administration the share of fossil fuels in electricity production in Iran in 2020 was 89% (Fig.6).
The country has a significant number of stations for the production of electricity from fossil fuels, including six oil stations with a capacity of more than 500 MW, ten gas-fired power plants with more than 1 000 MW, nine combined-type power plants with a capacity of more than 500 MW, and one nuclear power plant (Fig.6). The largest gas power plant is Damavand, with an installed capacity that has been estimated at 2 862 MW [28], oil – Shahid Montazeri, with an installed capacity of 1 600 MW [29], combined type – Shahid Salimi with an installed capacity of 2 195 MW [30,31], Nuvlear – Bushehr-1 with a capacity of 915 MW [32].
As mentioned above, the hydropower industry in Iran does not have a significant share in the generation of electricity, it is represented by several hydro and pumped storage power plants, that altogether produced 15.3 TWh in 2017 (Fig.6). The generation leader among the hydroelectric power stations is Karun-3 with an installed capacity of 2 280 MW [33]; among the pumped storage power plants – Siabisheh, with an installed capacity of 1 040 MW [34]. In addition, in the country, as of early 2016, there are about 20 small hydropower stations with a total capacity of 50 MW (Fig.6).
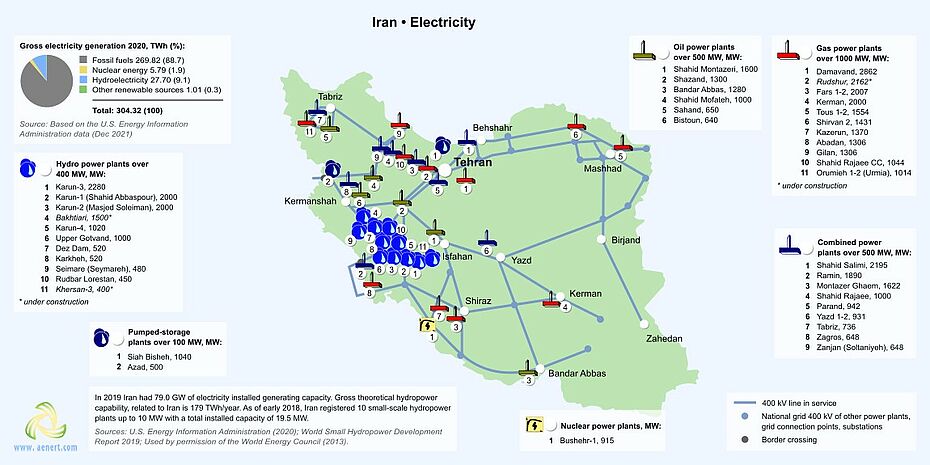
Figure 6. Electricity production in Iran
Figure 7 shows the main infrastructure facilities of Iran for the production of renewable energy.
Renewable energy, excluding hydropower, has a minimal share in electricity production in Iran, the total electricity production from renewable sources was 1.01 - 1.15 TWh in 2019-2020 (Fig.6 and 7).
In the coastal areas and in the north-east of the country, in the zones of relatively high wind activity, there are 6 large wind farms with a capacity of more than 1 MW each. In 2018, Iranian wind farms had a total installed capacity of 203 MW [35]. The largest is Manjil with an installed capacity of 90.2 MW [36].
As mentioned earlier, the level of global horizontal solar irradiation in some regions of the country can reach 6.3 kWh/m2/day, which is a significant resource for the production of energy through photovoltaics [10].

Figure 7. Renewable energy in Iran
As a result, there is a number of solar energy facilities including 4 photovoltaic stations with a capacity of more than 1 MW each and CSP parabolic type plants (Fig.7). The largest photovoltaic station is the Mokran PV Solar Power Plant, opened in 2017, with an installed capacity of 20 MW [37], and the largest parabolic type station is Yazd CSP with an installed capacity of 17 MW [38].
As previously mentioned, Iran possesses no significant geothermal potential. In 2017, Moshanir plans to launch the first geothermal power plant in the country at the Meshkin-Shahr Single Flash Geothermal Power Plant on the slope of Mount Sabalan in northwestern Iran, which has an installed capacity of 5 MW with a possible increase in power to 25 MW [39].
Bioenergy has not received active development in the country to date, and in 2019, only 0.01 TWh was generated from biomass (Fig.8). The country has biogas and biodiesel plants. The Qeshm Island plant, owned by Iran Biodiesel Kish Co in 2009 uses CVR technology (Cavitation Reactor) and can produce 350 000 million tons of biodiesel [40]. Tehran Wastewater biogas power plant, which produces biogas from wastewater and waste to generate electricity, has an installed capacity of 5 MW [41].
According to the Ministry of Energy of Iran it is planned to produce 5 000 MW of electricity using renewable energy in the next 5 years [42]. This figure will also be achieved through the introduction of new capacities, so by the end of 2016 it is planned to put into operation 14 renewable energy facilities with a total capacity of 100 MW, which is 700% higher compared to previous year. In 2017, it is planned to increase the capacity of the entire renewable energy complex by another 300 MW. Iran also took part in the Paris Agreement on Climate Conservation and pledged to increase the capacity of the renewable energy sector to 7 500 MW by 2030 [43].
The country is actively engaged in attracting foreign investment, so in 2016 Germany invested about 170 million euros for the development of solar energy in Iran [44]. Also in the field of solar energy, it is worth noting the planned construction of a 20 MW solar park in the Kurdistan Province [45] and the commissioning of a 5 000 W Karoon Oil and Gas Solar Power Plant by the oil company for its own needs [46].
In the field of hydropower, it is worth noting the opening of the 450 MW Rudbar Lorestan hydroelectric power station and the construction of 130 MW Chamshir hydroelectric power stations in the province of Kohgiluyeh-Boyer Ahmad and the Bakhtiari station with a capacity of 750 MW in Lorestan province [47].
Also under construction is the Bushehr Petrochemical Complex, which will produce methanol and will occupy an area of 10 000 hectares in the Bushehr petrochemical complex. The launch will take place approximately at the end of 2017 [48].
Municipal waste utilization is a new direction for Iran. In Tehran province, the methane emission potential from landfills, which amounts to 438 million cubic meters per year, can generate about 2 400 MW of electricity. Soon the provincial municipality plans to launch a municipal waste utilization pilot project [49].
There are several areas of development in the field of fossil resources. One of the main undertakings is the extraction of shale oil. The National Iranian Oil Company stated that shale oil deposits were discovered in the province of Lorestan, and the potential was estimated at 2 billion barrels. The research will be completed in 2017 [50].
Diversification of export destinations is also one of the main priorities of the country's energy agenda. To this end, negotiations continue between Iran and Pakistan on the construction of a gas pipeline from Gwadar to Nawabshah [51]. In addition, in 2016, the National Oil Company of the South signed a contract for the supply of associated gas to the private sector to the amount of 42 million cubic feet per day, which could reduce the flaring of gas [52].
Education and Innovation
The set of indices reflecting the position of Iran among other countries in the field of education and innovation can be seen in Figure 8.
According to the Global Innovation Index 2021, Iran is ranked 60th out of 132 countries (see diagram for links). According to the second and third index, the country can be grouped in the number of countries with a sufficiently high level of patent activity.
According to the number of patents granted to Iranian residents, both inside the country and abroad, the country ranks 23rd in the world, however in terms of patents in force, the country is 34th out of 109 countries considered. Iran is very well positioned when considering the number of publications of specialists in scientific and technological journals — 15th place out of 197 countries considered. It is also regarded highly by the Scimago Journal and Country Rank (21st place).
In terms of government expenditure on education as a percentage of the country's GDP, the country demonstrates a low result – 127th out of 177 countries selected for consideration.
| Sources: 1. The Global Innovation Index 2021, Rankings / Knowledge / World Intellectual Property Organization / Cornell University, INSEAD, and WIPO (2021): Energizing the World with Innovation. Ithaca, Fontainebleau, and Geneva *132 2. Patent Grants 2011-2020, resident & abroad / Statistical country profiles / World Intellectual Property Organization *185 3.Patents in Force 2020 / Statistical country profiles / World Intellectual Property Organization *109 4. QS World University Rankings 2022 *97 5. SCImago Country Rankings (1996-2020) / Country rankings / SCImago, (n.d.). SIR-SCImago Journal & Country Rank [Portal]. Retrieved 17 Nov 2021 *240 6. Internet users in 2018 / The World Factbook / Central Intelligence Agency *229 7. Internet users in 2018 (% Population) / The World Factbook / Central Intelligence Agency *229 8. Government expenditure on education, total (% of GDP), 2019 / United Nations Educational, Scientific, and Cultural Organization (UNESCO) Institute for Statistics. License: CCBY-4.0 / Data as of September 2021*177 9. Research and development expenditure (% of GDP), 2018 / UNESCO Institute for Statistics. License: CCBY-4.0 / Data *119 10. Scientific and technical journal articles, 2018 / National Science Foundation, Science and Engineering Indicators. License: CCBY-4.0 / Data *197 * Total number of countries participating in ranking Figure 8. The indices of education and innovation in Iran |
Nevertheless, 6 Iranian universities are included in the QS University Rating. It is also worth noting that the country's GDP is high enough, therefore, in absolute terms, government expenditure on education are nevertheless significant.
In terms of research and development expenditure as a percentage of GDP, the country is 67th – slightly below the global average.
Iranian universities, such as the University of Tehran, Sharif University of Technology, Iran University of Science & Technology Tehran, K. N. Toosi University of Technology, Tarbiat Modares University, Shiraz University of Technology, and Isfahan University оf Technology Leoben train specialists in various fields of energy, including Petroleum Engineering, Materials Science and Engineering, Energy Systems Engineering, and Mechanical Engineering, etc.
In the fields of synthetic fuel production and extraction and processing of unconventional oil, the leader in patenting among Iranian companies are the Research Institute of Petroleum Industry (RIPI) and Sensiran. Research and development in this field is carried out by Shiraz University, Islamic Azad University, the University of Sistan and Baluchestan, the University of Teheran etc.
In the field of extraction and processing of unconventional oil, one can note the research activities of such universities as the Petroleum University of Technology (PUT), Sharif University of Technology, Islamic Azad University, University of Teheran.
The leaders among the Iranian companies in fields such as the study of gas hydrates, are the National Iranian Oil Company (NIOC), Amirkabir University of Technology, Researh Institute of Petroleum Industry (RIPI); and in the field of research of hydrocarbon production from reservoirs with low permeability – Islamic Azad University, Amirkabir University of Technology, and the Petroleum University of Technology (PUT).
Leading research organizations in this field of associated gas are Islamic Azad University, Petroleum University of Technology (PUT), Sharif University of Technology.
University of Teheran, Islamic Azad University, Isfahan University of Technology, have the highest number of publications in the field of bioenergy.
A large number of Iranian companies conduct research in the field of energy production from renewable sources. In the field of solar energy University of Teheran, Islamic Azad University, Ferdowsi University of Mashhad, Tarbiat Modares University, Sharif University of Technology should be mentioned.
In the field of wind energy – University of Teheran, Islamic Azad University, Sharif University of Technology, Amirkabir University of Technology.
Ecology and Environment Protection
The environmental index diagram presented in Figure 9 reflects to some extent the ecological situation in the country.
First of all, the country demonstrates a relatively high level of CO2 emissions in general, and per capita. At the same time, the situation is aggravated by the fact that Iran is 62nd out of 64 countries responsible for more than 90% of global CO2 emissions related to energy in the Climate Change Performance Index (CCPI) 2022.
The situation is brightened, however, by a relatively high valuation of Iran in the Environmental Performance Index rankings (EPI) 2018, which focuses primarily on assessing the environmental performance of national governments. In this rating Iran is above of Algeria, Egypt, Morocco, and Qatar and is 67th out of 180 member countries.
| Sources: 1. CO2 total emission by countries 2020 / European Commission / Joint Research Centre (JRC) / Emission Database for Global Atmospheric Research (EDGAR)*208 2. CO2 per capita emission 2020/European Commission/Joint Research Centre (JRC) / Emission Database for Global Atmospheric Research (EDGAR) *208 3. Forest area 2020 (% of land area) / The Global Forest Resources Assessment 2020 / Food and Agriculture Organization of the United Nations *234 4. Forest area change 2010-2020 (1000 ha/year) / The Global Forest Resources Assessment 2020 / Food and Agriculture Organization of the United Nations *234 5. The Environmental Performance Index (EPI) 2020 / Rankings / Yale Center for Environmental Law & Policy / Yale University *180 6. Annual freshwater withdrawals (m3 per capita), 2017 *179 Annual freshwater withdrawals, total (billion m3), 2017 – Food and Agriculture Organization, AQUASTAT data. /License: CC BY-4.0; Population – United Nations, Department of Economic and Social Affairs, Population Division (2019). World Population Prospects 2019, custom data acquired via website. Retrieved 15 November 2021 7. The National Footprint Accounts 2017 (Biocapacity Credit / Deficit) / Global Footprint Network *188 8. Methane emissions (kt of CO2 equivalent), 2018 / Data for up to 1990 are sourced from Carbon Dioxide Information Analysis Center, Environmental Sciences Division, Oak Ridge National Laboratory, Tennessee, United States. Data from 1990 are CAIT data: Climate Watch. 2020. GHG Emissions. Washington, DC: World Resources Institute. Available at: License : Attribution-NonCommercial 4.0 International (CC BY-NC 4.0) *191 9. The Climate Change Performance Index (CCPI) 2022 / Overall Results / Jan Burck, Thea Uhlich, Christoph Bals, Niklas Höhne, Leonardo Nascimento / Germanwatch, NewClimate Institute & Climate Action Network *60 * Total number of countries participating in ranking Figure 9. Environmental Indices of Iran |
The overall negative picture is worsened by the Ecological Footprint Atlas rating, according to which Iran is among a number of ecological debtors.
In terms of forest area as a percentage of the country, Iran is 188th in the world; however, the trend associated with its change looks much better. According to this indicator the country is 36th in the world.
References
[1] List of sovereign states and dependencies by area / Wikipedia / https://en.wikipedia.org/wiki/List_of_sovereign_states_and_dependencies_by_area
[2] List of countries and dependencies by population density / Wikipedia / https://en.wikipedia.org/wiki/List_of_countries_and_dependencies_by_population_density
[3] Iran/ The world factbook / Library / Central Intelligence Agency / https://www.cia.gov/
[4] GDP, PPP (constant 2011 international $) / World Bank, International Comparison Program database. License: CC BY-4.0 / Data / The World Bank / http://www.worldbank.org/
[5] GDP per capita, PPP (current international $)/ World Bank, International Comparison Program database. License: CC BY-4.0 / Data / The World Bank / http://www.worldbank.org/
[6] Iran / U.S. Energy Information Administration (July 20, 2021) /http://www.eia.gov/
[7] BP Statistical Review of World Energy June 2021 (PDF) / BP / https://www.bp.com/
[8] Iran Proven Oil Reserves beyond 711bb as of 2016 / SHANA/ شبکهاطلاعرسانینفت / http://www.shana.ir/
[9] Coal / Survey of Energy Resources 2016 (PDF) / World Energy Council / https://www.worldenergy.org
[10] Solar resource data obtained from the Global Solar Atlas, owned by the World Bank Group and provided by Solargis / Global Solar Atlas / http://globalsolaratlas.info/
[11] Wind Map / Global Wind Atlas 2.0, a free, web-based application developed, owned and operated by the Technical University of Denmark (DTU) in partnership with the World Bank Group, utilizing data provided by Vortex, with funding provided by the Energy Sector Management Assistance Program (ESMAP). For additional information: https://globalwindatlas.info
[12] Survey of Energy Resources 2013 (PDF) / World Energy Council / www.worldenergy.org/
[13] Agricultural land (% of land area) / Food and Agriculture Organization, electronic files and web site. License: CC BY-4.0 / Data / The World Bank / http://www.worldbank.org
[14] Forest area (% of land area) /Food and Agriculture Organization, electronic files and web site. License: CC BY-4.0 / Data / The World Bank / http://www.worldbank.org/
[15] Annual U.S. & Global Geothermal Power Production Report (PDF) / Geothermal Energy Association / http://geo-energy.org/
[16] World Bank What a Waste (PDF) / Data / The World Bank / http://www.worldbank.org
[17] International Energy Statistic / Geography / U.S. Energy Information Administration (Jan 2020) /http://www.eia.gov/beta/international/
[18] South Pars gas field / SubSeaIQ / http://www.subseaiq.com/
[19] Ahvaz Field / Wikipedia / https://en.wikipedia.org/wiki/Ahvaz_Field
[20] OPEC Annual Statistical Bulletin 2017 (PDF) / Organization of the Petroleum Exporting Countries (OPEC) / http://www.opec.org/
[21] Four New Oil Storage Facilities to Come on Stream in Iran / September 30, 2013 / TankTerminals / https://www.tankterminals.com/
[22] Iran – Gas Processing & Export Projects / The Free Library / http://www.thefreelibrary.com/
[23] Project / Projects / Overview / Iran Liquified Natural Gas Co. / http://www.iranlng.ir/
[24] Iran to inaugurate 1st GTL Plant by 2018 / Aug 06, 2014 / Fars News Agency / http://en.farsnews.com/
[25] International DME Projects (PDF) / Global Dimethyl Ether Emerging Markets. April 20, 2007 / Google / http://www.google.com
[26] The Saghand Mine & Gchine Mine and Mill / Uranium Mining / ISIS Nuclear Iran / http://www.isisnucleariran.org/
[27] Eshkli Coal / Iran Mining / http://www.iranmining.com/
[28] Damavand Gas Power Plant / Industry About / http://www.industryabout.com/
[29] Shahid Montazeri Oil-fried plant / Industry About / http://www.industryabout.com/
[30] Shahid Salimi Oil Power Plant / Industry About / http://www.industryabout.com/
[31] Shahid Salimi Gas Power Plant / Industry About / http://www.industryabout.com/
[32] Electric Power Industry in Iran 2014-2015 / Tavanir Org. / http://amar.tavanir.org.ir/en/
[33] Karun-3 Dam / Wikipedia / https://en.wikipedia.org/wiki/Karun-3_Dam
[34] D-Large Hydro Power Plants / Electric Power Industry in Iran 2014-2015 / Electric Power Industry in Iran / Tavanir Org. / http://amar.tavanir.org.ir/en/
[35] Iran's largest wind farm commissioned / 31 August 2018 by Craig Richard / Wind Power Monthly / https://www.windpowermonthly.com
[36] Wind Farms erected throughout the country / Deputy for Executive and Technical / Ministry of Energy: Renewable Energy and Energy Efficiency Organisation (SATBA) / http://www.satba.gov.ir/en/
[37] Largest solar power plant in Iran opens / 31/07/2017 / Euronews / http://www.euronews.com/
[38] Yazd ISCC / CSP World Map / CSP World / http://cspworld.org/
[39] Meshkinshahr Geothermal Power Plant / Geothermal Energy / Industry About / http://www.industryabout.com/
[40] About Us / Iran Biodiesel Kish Co. / http://www.biodiesel.ir/
[41] Power plants constructed by private sector / Deputy for Executive and Technical / Ministry of Energy: Renewable Energy and Energy Efficiency Organisation (SATBA) / http://www.satba.gov.ir/en/
[42] تولید ٥ هزار مگاوات برق تجدیدپذیر در ٥ سال آینده / Jul 20 2016/5 thousand megawatts of renewable electricity production in the next 5 years SHANA شبکه اطلاع رسانی نفت Shana / http://www.shana.ir/
[43] افزایش ١٠٠ مگاواتی ظرفیت نیروگاه های تجدیدپذیر کشور/Oct 03 2016/An increase of 100 MW of renewable energy capacity of the country SHANA شبکه اطلاع رسانی نفت / Shana / http://www.shana.ir/
[44] سرمایه گذاری ۱۷۰ میلیون یورویی آلمان برای تولید پنل خورشیدی در ایران / Germany's investment of 170 million euros for solar panels in Iran / Shana / http://www.shana.ir/
[45] نیروگاه خورشیدی نفت و گاز کارون به بهرهبرداری رسید Karoun Oil and Gas Solar Power Plant was launched SHANA/ شبکه اطلاع رسانی نفت / /Shana / http://www.shana.ir/
[46] ٢٠ مگاوات نیروگاه خورشیدی در استان کردستان احداث میشود/ Aug 14 2016/20 MW solar power plant to be built in the province SHANA شبکه اطلاع رسانی نفت / Shana / http://www.shana.ir/
[47] 450-MW Rudbar Lorestan hydroelectric plant opens in Iran / Hydroworld.com / http://www.hydroworld.com
[48] واحد متانول پتروشیمی بوشهر تابستان ٩٦ راه اندازی میشود/Methanol petrochemical plant in Bushehr to be launched in summer 2017 شبکه اطلاع رسانی نفت / Shana / http://www.shana.ir/
[49] قابلیت تولید ٢٤٠٠ مگاوات انرژی در سال از گاز متان در استان تهران/Jul 13 2016/The ability to produce 2400 MW of energy per year of methane in Tehran / Shana / http://www.shana.ir/
[50] Iran Finds 2 Billion Barrels Shale Oil Reserves in Western Province / Gulf Oil and Gas / http://www.gulfoilandgas.com/
[51] ایران و پاکستان برای پیشبرد طرح خط لوله گاز در تماس هستند / Iran and Pakistan are in contact with the gas pipeline project / Shana / http://www.shana.ir/
[52] قراردادفروش۴۲میلیونفوتمکعبگازهایهمراهنفتامضاشد/ The contract for the sale of 42 million cubic feet of gas was signed / Shana / http://www.shana.ir/
The sources of charts and curves are specified under the images.
For more information about the energy industry in Iran see here