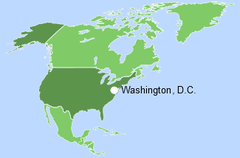

美利坚合众国,是北美洲的一个国家。它的首都是华盛顿特区。该国与加拿大(北部)和墨西哥(南部)接壤,并与俄罗斯有海上边界。美国可以通往太平洋、大西洋和北冰洋。
美国是世界第四大国家,截至 2022 年拥有超过 3.37 亿人口。就人口密度而言,美国在 248 个国家中排名第 185位[1,2,3] 。该国海岸线总长度为19 924公里[3]。
| the United States | ||
|---|---|---|
| Capital: Washington, D.C. | Density: 33.6/km2 | Currency: United States ($) |
| Official languages: English | Life expectancy at birth: 77.28 years | GDP (PPP): $26.855 trillion (2023 est.) |
| National Day: 04 July | Area: 9,833,520 km2 | GDP - per capita (PPP): $80,035 (2023 est.) |
| Population: 333,287,557 (2022 est.) | Coastline: 20,083 km | Internet country code: .us |
Source: [1,2,3,4,5]
美国是世界上最大的高度发达的经济体 [3],如图 1 所示。从几乎所有指数来看,美国都位于图表的前四分之一,在全球排名前 25% 的国家中评分。在近一半的指标中,美国占据首位。
| Sources: 1. GDP (purchasing power parity), 2020 est. / The World Factbook/Library/Central Intelligence Agency *228 2. GDP - per capita (PPP), 2020 / The World Factbook/Library/Central Intelligence Agency *229 3. Inflation rate (consumer prices), 2019 est. / The World Factbook/Library/Central Intelligence Agency *228 4. Charges for the use of intellectual property, receipts (BoP, current US$), 2020 / International Monetary Fund, Balance of Payments Statistics Yearbook, and data files. / License: CC BY-4.0 *88 5. The Global Competitiveness Index 2019 / Rankings / Reports / World Economic Forum *141 6. High-technology exports (current US$) 2019-2020 / United Nations, Comtrade database through the WITS platform / License: CCBY-4.0 / Data *134 7. 2021 Index of Economic Freedom / International Economies / The Heritage Foundation *178 8. Reserves of foreign exchange and gold, 2017 est. / The World Factbook / Library / Central Intelligence Agency *195 9. Annual average GDP growth in %, for the last 10 years (2011-2020) / World Bank national accounts data, and OECD National Accounts data files / License: CC BY-4.0 *206 10. Public debt (% of GDP), 2017 est. / The World Factbook / Library / Central Intelligence Agency(from smallest to largest) *210 * Total number of countries participating in ranking 图 1. 美利坚合众国经济指数 |
自 1990 年代初以来(除了 2008 年略有下降),该国的 GDP 总体和人均购买力平价都持续增长,到 2020 年达到 19.84 万亿美元(世界第二位)[3,4 , 5]。该国按人均购买力平价计算的 GDP 较低(位居世界第 17位),但也呈现出积极的动态:从 2015 年的 58,400 美元增至 2017 年的 59,800 美元,再到 2020 年的 60,200 美元[3]。通货膨胀水平从2016年的1.3%变为2017年的2.1%和2019年的1.8%[3]。
根据世界经济论坛发布的《2019 年全球竞争力报告》,美国排名第二,仅次于新加坡(在总共 141 个国家中)。该评级衡量该国利用自身资源实现可持续发展的有效性。除了一些经济指标外,该指数还考虑了教育、健康、创新水平等变量。
根据经济自由指数,该指数基于商业自由、不受政府干预的自由、财产保护和反腐败方面,2021 年,该国在 178 个参与调查的国家中排名第 20位。2017年,美国的黄金储备和外汇储备排名第21位,落后于韩国、俄罗斯和中国。
根据过去10年(2011-2020年)平均GDP增长率指标,2017年该国在206个国家中排名第131位。以公共债务占国内生产总值的百分比计算,美国在2017年考虑的210个国家中排名第36位。世界500强企业包括埃克森美孚、雪佛龙、瓦莱罗能源等美国石油和天然气企业,马拉松石油公司、斯伦贝谢公司、康菲石油公司和杜克能源公司,以及大型能源公司通用电气。在 S & P Global Platts 2017 年最大能源公司 250 强排名中,数十家美国公司上榜,其中包括已经提到的公司,以及 NextEra Energy, Inc.、Phillips 66、The Southern Co、Dominion Energy、Xcel Energy Inc.。 ,以及许多其他人。
美国拥有大量化石和非常规能源资源储量(表1)。石油和天然气储量分别居世界第9位和第5位;就煤炭储量而言,该国绝对领先[6,7]。
根据2021年数据,按吨油当量计算,煤炭探明储量为89.7%,天然气为6.7%;石油 – 3.6%(图 5)。2021 年非常规资源矩阵看起来有些不同:油页岩(干酪根)占 95.1%,页岩气 – 2.7%,页岩(致密)油 – 1.7%,伴生气 – 0.4%,煤矿甲烷利用潜力 – 0.1%(图7)。
根据美国能源情报署的数据,2020 年美国探明石油储量估计为 358 亿桶[7]。
表1. 美国化石能源资源
| Resource /Explanations | Crude oil* | Natural gas* | Coal* | Shale Gas** | Tight Oil** | Coal mine methane | Extra Heavy Oil*** | Oil Shale*** |
|---|---|---|---|---|---|---|---|---|
| Value | 44.4(2.61%) | 465(6.41%) | 252(21.66%) | 317.7 | 78.2 | 11,878 | 19 | 3 706 825 |
| Unit | billion barrels | Tcf | billion short tons | Bcf | billion barrels | Bcf | million barrels | million barrels |
| Year | 2021 | 2020 | 2021 | 2020 | 2015 | 2020 | 2008 | 2008 |
| Source | [7] | [7] | [7] | [13] | [14] | [12] | [16] | [16] |
* 括号内提供了该国储量占世界总储量的份额
** 未经证实的技术可采
*** 现有资源
BP 的年度报告提供了 2020 年底的更高数字–688 亿桶 [6]。根据[6],2020 年美国探明天然气储量为 12.6 Tcm。根据美国能源信息管理局的数据,它们总计 495 Tcf [7]。2017 年伴生气和溶解天然气探明储量增长了 38%,估计为 99.4 Tcf [8]。
根据美国能源情报署的数据,煤炭可采储量估计为 2520 亿短吨,其中约 58% 是地下开采的煤炭 [8]。根据 BP 报告,截至 2020 年,煤炭储量为 2,489.41 亿吨,[6];根据 Bundesanstalt für Geowissenschaften und Rohstoffe (BGR) 的数据,2018 年硬煤产量估计为 2,195.34 亿吨[10]。
根据Advanced Energy Technologies测算,甲烷利用潜力(根据2017年煤炭开采甲烷排放量[11]及其储量[6]计算)为2 210-5 564 Bcm。根据美国能源信息署[12]的数据,2017年底煤层气探明储量估计为11.878 Bcf;资料来源[10]估计 2016 年煤层气储量为 4,470 Bcm。
美国拥有最大的页岩气储量,截至2020年底探明储量为317,756 Bcf [13]。2015 年页岩气和页岩油未经探明的技术可采储量估计分别为 622.5 Tcf 和 782 亿桶[14]。该国拥有世界上最大的干酪根油(油页岩)储量——6万亿桶,主要集中在格林河矿床(犹他州、科罗拉多州和怀俄明州),约占世界总储量的80%[15]。2008年干酪根石油保有量估计为37068.25亿桶,超重油储量为1900万桶[16]。
美利坚合众国由于其地理位置,拥有多种可再生能源用于能源生产。表 2 列出了此类资源的一些基本指标。
表 2. 美利坚合众国的可再生能源资源
| Resource/ Explanations | Solar Potential (DNI)* | Wind Potential (50 м)* | Hydro energy Potential** | Bio Potential (agricultural area) | Bio Potential (forest area) | Geothermal Potenial | Municipal Solid Waste |
|---|---|---|---|---|---|---|---|
| Value | 4.1-5.5 | 5.5-7.7 | 528, 923 | 44.5 | 33.3 | 9 057 | 2.58 |
| Unit | kWh/m2/day | m/s | GWh/year | % of land area | % of land area | MWe | kg/per capita/day |
| Year | 2018 | 2018 | 2016 | 2018 | 2018 | 2008 | 2012 |
| Source | [17] | [19] | [22] | [23] | [24] | [25] | [26] |
* 该国大部分地区
** 经济可开发能力
该国大部分地区的直接太阳辐射水平在 4.1-5.5 kWh/m 2 /天之间 [17]。在该国东南部以及加利福尼亚州、内华达州、亚利桑那州、新墨西哥州和夏威夷州,该数字可以达到最大值 6.8 - 8.2 kWh/m 2 /天 [17]。据美国能源部称,这些州的太阳能潜力超过 600 瓦时/英尺2 /天 [18]。再加上无云天数较多,该地区是世界上最有希望开发各类太阳能的地区之一。
风资源分布情况:全国大部分地区风速为5.5-7.7 m/sec;在该国的西北部和东北部可以达到8.7-9.7 m/sec;在阿留申群岛和夏威夷群岛,50 米处的速度超过 9.7 m/s [19]。根据[20],80米处的风能总潜力为10,640,080兆瓦,其中德克萨斯州的潜力最高,为130万兆瓦。据 NREL 称,2012 年陆上风电潜力(不包括海上风电)估计为 22,195 TWh [21]。
根据2016年世界能源资源水电报告,美国水电总潜力为528,923吉瓦时/年;其中只有 52% 得到利用 [22]。橡树岭国家实验室 2012 年估计总水力潜力为 278 TWh [21]。
根据2018年的数据,该国44.5%的领土被农业用地占据,而在过去的半个世纪里,农业用地的面积一直在稳步减少[23],森林面积略有下降,至33.3%。 2018年该国领土面积[24]。2011 年生物能源的总潜力估计为 445 TWh [21]。2008年该国的地热潜力为9,057兆瓦[25]。
2012年美国城市垃圾产生量为人均每天2.58公斤,高于许多发达国家,例如德国(人均每天2.11公斤)和法国(人均每天1.92公斤)每天)。到 2025 年,这一数字预计将增至人均每天 2.3 公斤 [26]。这种资源是回收或能源生产的宝贵原材料,其技术在美国已达到较高的发展水平
根据《BP 2021年世界能源统计年鉴》,2020年美国一次能源消费量为87.79艾焦耳,其中石油占主导地位 - 37%,其次是天然气 - 29.9%,煤炭 -9.2%,核能 - 8.4% ,可再生能源 - 7%,水力发电 2.9% [6]。根据[3,6]的数据,考虑到 2011 年每单位能源消耗的购买力平价(购买力平价)价格(相当于一公斤能源中所含的能源),2016 年美国 GDP 能源效率的估计值为 8.7 美元。石油),低于世界平均水平。2001年至2020年间,美国石油和凝析油产量显着增加,达到18,609千桶/日,而2001年为8,957千桶/日[8,27]。同期液态烃消费量没有显着变化:最低水平为18,487千桶/日,2019年达到20,542千桶/日[27]。BP 显示 2020 年美国石油和凝析油产量较低,为 11,315 万桶/天,消费量为 18,12 万桶/天 [6]。尽管如此,根据[3],美国是 2017 年第一大原油生产国。根据[3],2017年美国石油进口总量为796.9万桶/天,使该国成为世界上最大的石油进口国;出口量为115.8万桶/天。美国是世界上最大的石油产品生产国、消费国和出口国。
Source: U.S. Energy Information Administration (Sep 2023) / www.eia.gov
2. 美国化石燃料的生产和消费(煤炭 – 左,天然气 – 中,石油 – 右)
在石油产品进口方面,美国位居世界第二,综合指标落后于欧盟[28]。
美国也是世界上最大的天然气消费国和生产国[3]。自 2006 年以来,美国天然气消费量略有增长,2020 年达到 30,482 Bcf,产量在此期间也有所增长,2020 年达到 33,436 Bcf [27]。根据《BP 2021年世界能源统计年鉴》[6],2020年中国天然气消费总量为8320亿立方米,产量为9140亿立方米。根据[3],天然气出口量为897亿立方米,天然气进口量为861.5亿立方米。就天然气进口量而言,该国位居世界第四[3] 。
自2008年以来,该国煤炭产量和消费量有所下降,2020年总量分别为1171.8和7.063亿短吨[27]。据BP称,2020年煤炭消耗量为9.20艾焦耳,而产量则达到10.71艾焦耳[6]。2017年煤矿瓦斯抽采量为980 Bcf;比 2013 年减少约 35% – 1,466 Bcf [8]。
在美国,化石能源在电力生产中占主导地位,尽管近年来可再生能源的份额逐渐增加,化石燃料的份额逐渐下降(图3)。
Sources: U.S. Energy Information Administration (Sep 2023) / www.eia.gov | ||
图 3.美国的发电量 |
根据美国能源情报署的数据,2020 年发电量总计 4050.83 TWh,其中化石燃料占主导地位– 59.7%,其次是核电– 19.5%,可再生能源– 13.7%,水电– 7.1%(图 9) )。
美国在能源指数对比图中的位置如图4所示。
| Sources: 1. Crude oil proved reserves, 2021 / International Energy Statistic/Geography / U.S. Energy Information Administration (Nov 2021)*98 2. Natural gas proved reserves 2021 / International Energy Statistic / Geography / U.S. Energy Information Administration (Nov 2021) *99 3. Total recoverable coal reserves 2019 / International Energy Statistic / Geography / U.S. Energy Information Administration (Nov 2021) *81 4. Combination production-consumption for Crude oil 2018 / International Energy Statistic / Geography / U.S. Energy Information Administration (Nov 2021) *219 5. Combination production-consumption for Natural gas 2019 / International Energy Statistic / Geography / U.S. Energy Information Administration (Nov 2021) *123 6. Combination production-consumption for Coal 2019 / International Energy Statistic / Geography / U.S. Energy Information Administration (Nov 2021) *128 7. Electricity – from other renewable sources (% of total installed capacity), 2017 est. / The World Factbook / Library / Central Intelligence Agency *170 8. GDP per unit of energy use (PPP per unit of oil equivalent), 2020 *66 Primary energy consumption - BP Statistical Review of World Energy 2021/BP;GDP (purchasing power parity) - The World Factbook/Library/Central Intelligence Agency 9. Energy use (primary energy use of oil equivalent per capita) 2020 *127 Primary energy consumption – BP Statistical Review of World Energy 2021; Population - United Nations, Department of Economic and Social Affairs, Population Division (2019). World Population Prospects 2019, custom data acquired via website. Retrieved 15 November 2021*66 10. The Global Energy Architecture Performance Index Report (EAPI) 2017 / Rankings / Reports / World Economic Forum 11. Electric power consumption (kWh per capita), 2016 *217 Electricity Consumption - The World Factbook / Library / Central Intelligence Agency; Population - United Nations, Department of Economic and Social Affairs, Population Division (2019). World Population Prospects 2019, custom data acquired via website. Retrieved 15 November 2021 12. Combination of electricity production-consumption (kWh)/The World Factbook/Library/Central Intelligence Agency *216 * Total number of countries participating in ranking 图 4. 美利坚合众国的能源指数 |
如前所述,美国拥有异常丰富的各类化石燃料储量。从煤炭生产和消费比例来看,美国位居前25%领先国家之列;但石油、天然气的生产与消费比例低于世界平均水平。
就可再生能源(不包括水电)发电份额而言,美国在 2017 年入选的 170 个国家中排名第64位。美国在 2017 年 EAPI(能源架构绩效指数)中排名第 52位,主要基于国家的经济增长水平、环境安全和能源独立性,包括能源的获取。在过去 8 年里,该国的评级上升了两个位置。
2017 年,美国单位能源消耗 GDP 低于世界平均水平,在 66 个国家中排名第 40位,但人均这一指标较高,位居世界第 10位。
就人均用电量而言,美国排名世界第10位,但就电力生产与消费综合指标而言,美国在216个国家中排名第三,仅次于印度和中国。
图 5 显示了美国化石燃料行业最大基础设施项目分布的领土地图。
煤炭探明储量占化石燃料资源总量的89.7%,其次是天然气(6.7%)、石油(3.6%)(图5)。 最大的原油和凝析油储量集中在德克萨斯州,达156亿桶; 2021年产量为17.41亿桶[8]。 生产能力和石油储量排名前五的州依次为北达科他州、加利福尼亚州、新墨西哥州和俄克拉荷马州(图 5)。 2017年,141家美国炼油厂的总装机能力为1862万桶/天[29],2022年第一季度的可运营能力为17.9兆桶/天[8]。 该国最大的炼油厂亚瑟港位于德克萨斯州,装机容量为60.3万桶/天; 它由 TX Motiva Enterprises 运营[30](图 5)。 石油和石油产品的进口通过8个主要石油码头进行,最大的石油产品储存库是Bryan Mound(2.374亿桶)。 全国石油储存设施总装机容量为7.135亿桶[31]。 成品油通过管道运输,总长度为240,711公里(图5)。
除了石油储量外,德克萨斯州还拥有大量天然气储量。 根据美国专家 2020 年的数据,德克萨斯州油田蕴藏 102.4 Tcf,其中 10.5 Tcf 于同年开采 [8]。 sector in USA")
图5. 美国化石燃料行业基础设施:常规石油
宾夕法尼亚州、俄克拉荷马州和怀俄明州也跻身天然气储量和产量前五名之列(图6)。
美国天然气系统由 1,400 个天然气压缩机站、500 个天然气加工厂和 415 个地下天然气储存设施组成。 天然气通过总长度为 1,984,321 公里的管道网络在国内运输(图 6)。
 sector in USA")
图6. 美国化石燃料行业基础设施:常规天然气
天然气通过 11 个液化天然气终端进口,其中最大的终端位于路易斯安那州萨宾,吞吐量为 4.0 Bcfd [32]。 过去十年,中国页岩气产量大幅增加,为出口码头带来了新的需求。 三个出口码头,包括路易斯安那州萨宾帕斯,装机容量为2.8 Buff,船用液化天然气[32]; 另有4个出口码头正在建设中(图6)。 领先的天然气处理厂是 Aux Sable Grundy,装机容量为 2,100 Mccfd [33]。 数量最多的地下储气库位于宾夕法尼亚州,其中 49 个,总容量超过 7600 亿立方英尺[34]。
2015-2017 年非常规资源矩阵以油页岩(干酪根)为主 - 95%; 页岩气占2.7%,页岩(致密)油占1.7%; 伴生气0.4%; 煤矿瓦斯利用潜力为0.1%(图7)。
主要的油页岩田之一是犹他州的 Red Leaf Resources Seep Ridge [35]。 美国在非常规石油开采和提高采收率技术开发方面无可争议地处于世界领先地位。 这体现在页岩油生产的快速发展、老油田的复苏、北极石油生产的发展、稠油和高粘度石油生产的扩大等方面。 该国最大的油田 - Eagle Ford - 位于德克萨斯州,产量为 117 万桶/天 [36]。
美国境内还拥有大量重油田,其中大部分位于加利福尼亚州。 Aera Energy South Belridge (Tulare) 每天生产约 80,000 桶石油当量 [37]。 犹他州有许多正在进行的油砂开采项目(图 7)。 非常规石油基础设施以多个立式油页岩干馏厂为代表(图7)。
页岩气约占中国非常规自然资源潜力的2.7%。 最大的页岩气田是 Marcellus(123.8 Tcf),产量约为 7.0 Tcf [8]。
 in USA")
图7. 美国化石燃料行业基础设施:非常规石油
煤层气潜在储量分布于全国各地,但主要盆地位于西部落基山脉、阿巴拉契亚地区和东部地区[38](图8)。 领先的开采油田位于科罗拉多州,截至 2017 年,其储量为 3,257 Bcf,产量为 338 Bcf [8]。 值得注意的是,近年来煤矿瓦斯储量和产量明显下降。 近海地区发现了天然气水合物簇(图8),这可能是未来非常有前途的能源资源。
 in USA")
图8. 美国化石燃料行业基础设施:非常规天然气
美国的合成燃料生产发展有些缓慢; 此类企业规模较小。 例如,在俄克拉荷马州和阿拉斯加州,有少量的天然气液化工厂,例如康菲石油公司旗下的庞卡城工厂,其装机容量为 300 桶/天[39]。 加利福尼亚州的 Oberon Fuels Brawley 每天使用沼气或天然气作为原材料生产约 10,000 加仑 DME [40]。 煤炭气化基础设施以多个站为代表,包括北达科他州的 Great Plains Synfuels Plant,日产煤量为 1.6 万吨[41],以及 CIRI Stone Horn Ridge 地下站,装机容量为 100 MW [42]。
图 9 显示了美国最大的发电基础设施的领土分布图。
 in USA")
图 9. 美国的发电量:火力发电厂
正如已经指出的,煤炭在化石资源潜力中所占的份额是巨大的。 全国共有煤矿680多个,年产量超过7亿短吨(图9)。 煤矿主要集中在东部和中部地区。 怀俄明州拥有最丰富的煤炭资源基础; 2021年该州煤炭开采产量为2.39亿短吨[43]。 大多数出口码头位于该国南部和东部; 最大的是弗吉尼亚州兰伯特角,产能为 4800 万吨[44]。
据美国能源信息署统计,2020年美国化石资源发电量占比为59.7%(图9)。 该国拥有大量碳氢化合物发电站,其中包括容量超过 1000 兆瓦的发电厂:4 个油站、11 个天然气站、11 个煤站和 6 个联合型发电站(图 9)。 美国最大的火力发电厂是: FPL 的马丁县天然气发电厂,容量为 3,750 MW [45]; 海牛石油发电厂,装机容量为2.485兆瓦[46]; Robert W. Scherer燃煤电厂,装机容量3.564兆瓦; James M. Barry 联合电厂,装机容量为 2,671 MW [47,48]。
美国水力发电量约占总发电量的7.1%,以抽水蓄能电站、大小水电站为代表(图10)。 最大的抽水蓄能电站是巴斯县抽水蓄能电站,装机容量为3,003兆瓦[49]; 最大的水力发电厂是大古力大坝,装机容量为 6,809 兆瓦[50]。 2017年,美国注册小水电站超过1,646座,装机容量为3,612兆瓦(图10)。
主要铀矿位于该国西北部; 最大的是 Smith Ranch-Highland,2016 年产量约为 358 吨 [51]。 领先的核电站是 Palo Verde,装机容量为 3,937 MW [52]。 还有大量用于锂生产的原材料储备,目前主要用于生产电子和汽车行业的电池。 内华达州克莱顿谷的银峰矿,2017 年开采了 3,500 吨锂,有可能将产量扩大到 6,000 吨[53]。 in USA")
图 10. 美国的电力生产:水力发电厂和核电厂
在图 11 中,您可以看到美国用于生产可再生能源能源的主要设施。
美国可再生能源(不包括水力发电)仅占发电量的 13.7%(图 10)。 2017年可再生能源发电总量(不包括水电)为555.89太瓦时(图10)。
在风力活动频繁的地区,大约有 10 个大型风电场,每个发电容量超过 550 兆瓦。 2020年美国风电总发电量约为13.5万兆瓦[54]。 加利福尼亚州阿尔塔风能中心,也称为莫哈韦风电场,装机容量为 1,547 兆瓦,是美国最大、世界第三大[55]。 美国风力发电机的主要生产商有GE Energy、Urban Green Energy、REpower USA Corp.、Northwind、Suzion 和Harvistor LLC(图11)。
")
图 11. 美国的可再生能源:海洋、太阳能、风能
近年来,两家美国公司实施了引人注目的大型风能项目:2017年12月,风力涡轮机制造商维斯塔斯获得了建设总容量为190兆瓦的风电场的订单; 2018年歌美飒宣布实施两个总容量为330兆瓦的风电场项目[56, 57]。 如前所述,该国某些地区的太阳辐射水平可达8.2kWh/m2,这是一种巨大的能源生产资源[19]。 因此,这些地区安装了许多太阳能设施,包括光伏电站、CPV 和 CSP 电站(图 11)。 最大的光伏电站是 Solar Star,容量为 747.3 MWp,最大的 CPV 电站是 Alamosa,容量为 35.2 MWp [58,59]。 美国约 0.5% 的可再生能源电力由光热发电站发电。 在抛物线型光热发电站中,最大的是 SEGS California Complex,容量为 393.8 MW [60]。 Solana 发电站(280 MW)是最大的抛物线型蓄热电站[61]。 最大的塔式电站是Ivanpah(392 MW),最大的蓄热塔式电站是Crescent Dunes(110.0 MW)[62,63]。 Kimberlina STEP CSP 线性菲涅耳型电站的容量为 5 MW,Tooele Army Depot CSP Dish-Stirling 型电站的容量为 1.5 MW [64,65]。 波浪能的潜力估计在 20-40 kWh 之间。 在一些地区,主要是夏威夷群岛,海洋技术的开发正在进行中。 因此,沿海地区安装了许多发电厂:夏威夷阿祖拉波浪能项目发电厂(40 kW)[66]、RITE 项目、纽约 Verdant Power 潮汐发电厂(1.05 MW)和 MOE / NELHA 夏威夷 OTEC 发电厂(100 kW)[67,68]。
美国是世界上最大的地热能发电国和热能生产国。 目前美国地热发电装机容量为 3,673 MW,来自 93 个不同类型的发电厂[95](图 12),然而,在大多数情况下,地热蒸汽特性允许使用干蒸汽技术。
图 12. 美国的可再生能源:地热能和氢能
二元型地热发电厂已得到显着发展,其中最大的是Steamboat Hills,装机容量为135.8 MW。 Steamboat Hills Single Flash 地热发电厂位于内华达州,装机容量为 14.4 MW [69,70]。 帝王谷综合体是一个利用双闪技术的强大企业,由多个电站组成,总容量为 327 MW [71]。 在该国西部和夏威夷有联合类型的地热站 - Heber Complex 的总容量为 217.7 MW [72]。 位于加利福尼亚州的 Geysers Complex 干蒸汽地热发电厂装机容量为 1,000 MW [73]。
美国正在积极发展氢能,在商业氢气产量、燃料电池发电量、氢气管道长度、加氢站数量等指标上无可争议地处于世界领先地位。 截至2018年3月,全国运营中的加氢站超过50座(图12)。 该国拥有氢气生产设施,其中最大的是德克萨斯城,装机容量为 372,856 标准立方米/小时,由 TX Praxair [74] 拥有,以及氢燃料电池工厂,包括由 Delmarva Power 拥有的纽瓦克,已安装 容量为30兆瓦[75]。 氢气通过总长2,320公里的管道输送(图12)。
图 13 显示了该国用于能源生产的主要生物能源设施。

图 13. 美国的可再生能源:生物能源
美国正在积极发展生物能源。2021年装机容量为13.57吉瓦(4.2%)(图13)。 该国拥有生物质和城市垃圾加工厂、生物柴油和颗粒生产厂等(图 13)。
FL 管理着最大的生物质发电厂 - Okeelanta 1-2 - 装机容量为 120.0 MW [76]。 美国生物质燃料生产领域的主要企业是RBF Port Neches Biodiesel Plant,装机容量为180 MW [77]。
美国积极从事生物乙醇生产,在该能源领域处于世界领先地位; ADM Cedar Rapids 的装机容量为每年 5.4 亿加仑 (MGY) [78]。 第二代纤维素生物乙醇在杜邦内华达工厂生产,该工厂的装机容量为每年 3000 万加仑 (MGY) [79]。 Hometown BioEnergy 位于La Sueur,容量为8 MW,使用通过厌氧发酵获得的沼气[80]。
其他著名企业包括: Plainfield 可再生能源生物质气化厂,年燃烧约 35 万吨木材 [81]; Enerkem Pontotoc 废物气化厂,每年可生产 1000 万加仑乙醇[82]; GM Defiance 等离子工厂废物气化,产能为 50 吨/天 [83]; 和 Georgia Biomass Waycross,每年生产 80 万吨颗粒[84]。
Palm Beach 2 是利用城市垃圾发电的领先者,每天处理约 3,000 吨垃圾 [85]。 美国拥有最发达的利用垃圾填埋气发电的企业网络之一。 Fairless Hills 就是这样的企业之一,利用垃圾填埋气生产和利用的城市废物发电约 60 兆瓦[86]。 UOP Kapolei 快速热解示范工厂的装机容量为 168 克/天 [87],最大的 BTL-FT 工厂 GTI Des Plaines 的装机容量为 5 MWth [88]。 烘焙厂主要位于该国东南部,最大的是 Zilkha Biomass Energy Selma,每年生产 275,000 吨[89]。
在唐纳德·特朗普总统在竞选和担任总统期间提出的“能源统治”计划的框架内,已经确定了一些改革方向。 首先,改革将影响煤炭行业——特朗普总统承诺消除生产“清洁煤炭”的立法障碍,并修改联邦各州暂停租赁燃煤电厂的禁令。 尽管如此,安永会计师事务所的分析师认为,即使在联邦没有削减开支的情况下,公用事业公司或金融投资者转向廉价天然气也不会从根本上调整其最近的商业模式以支持投资煤炭生产[90]。 特朗普在竞选过程中还多次强调,他将取消联邦各州对页岩气和干酪根油开采的限制[91]。 石油公司现在可以自由获取地下资源,例如在阿拉斯加[92]。 2017年3月,总统颁布法令,修订所有可能损害国内消费能源开发或使用的现有规则、命令和指南,特别关注石油、天然气、煤炭和核能资源[91]。
能源政策的另一个方面是增加从加拿大和墨西哥进口石油的份额,并减少对中东供应商的依赖。
在可再生能源领域,转折点是特朗普决定终止美国参与《2015年巴黎协定》,该协定旨在减轻气候变化的影响,据总统称,气候变化损害了美国的经济。 美国并使该国处于永久不利的地位[93]。 然而,拜登总统从上任第一天起就表示美国将重新加入《巴黎协定》,并于2021年2月19日这样做了。拜登的新气候计划是美国总统有史以来通过的最全面的计划[94]。
| Sources: 1. The Global Innovation Index 2021, Rankings / Knowledge / World Intellectual Property Organization / Cornell University, INSEAD, and WIPO (2021): Energizing the World with Innovation. Ithaca, Fontainebleau, and Geneva *132 2. Patent Grants 2011-2020, resident & abroad / Statistical country profiles / World Intellectual Property Organization *185 3.Patents in Force 2020 / Statistical country profiles / World Intellectual Property Organization *109 4. QS World University Rankings 2022 *97 5. SCImago Country Rankings (1996-2020) / Country rankings / SCImago, (n.d.). SIR-SCImago Journal & Country Rank [Portal]. Retrieved 17 Nov 2021 *240 6. Internet users in 2018 / The World Factbook / Central Intelligence Agency *229 7. Internet users in 2018 (% Population) / The World Factbook / Central Intelligence Agency *229 8. Government expenditure on education, total (% of GDP), 2019 / United Nations Educational, Scientific, and Cultural Organization (UNESCO) Institute for Statistics. License: CCBY-4.0 / Data as of September 2021*177 9. Research and development expenditure (% of GDP), 2018 / UNESCO Institute for Statistics. License: CCBY-4.0 / Data *119 10. Scientific and technical journal articles, 2018 / National Science Foundation, Science and Engineering Indicators. License: CCBY-4.0 / Data *197 * Total number of countries participating in ranking 图 14. 美国教育和创新指数 |
美国在 2021 年全球创新指数国家排名中的 132 个国家中排名第三(见图)。根据美国国民在国内和国外获得的专利数量,该国排名世界第三,仅次于日本和中国。然而,从有效专利数量来看,美国排名第一,这表明该国具有良好的创新条件。
尽管如此,仍有177所美国大学被纳入世界领先大学评级——“QS大学评级”。还值得注意的是,该国GDP较高,因此,从绝对值来看,政府的教育支出水平仍然相当可观。就研发公共支出占GDP的比例而言,该国在119个国家中排名第10 ,落后于韩国和一些欧盟国家。考虑到科技期刊和专利活动专家的出版物数量,美国处于非常有利的位置。在 Scimago 排名中,该国在 240 个参与国家中排名第一,在科学技术期刊活动中,在 197 个国家中排名第二。就互联网用户数量而言,该国也是该地区的领先者之一。
美国麻省理工学院、斯坦福大学、加州理工学院、耶鲁大学、哈佛大学、普林斯顿大学、加州大学、伯克利分校等大学培养能源工程、环境工程科学、在合成燃料技术
领域,埃克森美孚研究与工程公司、雪佛龙美国公司、埃克森研究与工程公司、通用电气、康菲公司、壳牌石油公司积极为其发明申请专利。该领域的研究由肯塔基大学国家技术实验室(NETL)、普林斯顿大学、德克萨斯农工大学、太平洋西北国家实验室(PNNL)进行。
在非常规石油领域,哈里伯顿能源服务公司、壳牌石油公司、埃克森美孚上游研究公司、MI LLC、哈里斯公司、贝克休斯公司和康菲公司在专利数量上处于领先地位。该领域的研究由德克萨斯农工大学、美国地质调查局 (USGS)、斯伦贝谢公司、斯坦福大学和科罗拉多矿业学院进行。
在伴生石油气领域,注册发明数量最多的是 Velocys Inc.、埃克森美孚上游研究公司、埃克森美孚研究与工程公司、Siluria Technologies Inc.、Velocys Inc.、北达科他大学、北达科他大学德克萨斯州和奥斯汀积极发表该领域的科学著作。
埃克森美孚上游研究公司、哈里伯顿能源服务公司、CDX Gas LLC、贝克休斯公司在煤层气开采技术专利数量方面处于领先地位,宾夕法尼亚州立大学、德克萨斯农工大学、斯伦贝谢公司进行了研究和哈里伯顿。在低渗透油藏油气开采领域,专利申请方面绝对领先的是哈里伯顿能源服务公司、贝克休斯公司、斯伦贝谢技术公司、罗门哈斯公司,德克萨斯大学和奥斯汀分校也进行了研究、斯伦贝谢公司、德克萨斯农工大学和俄克拉荷马大学。
雪佛龙美国公司、埃克森美孚上游研究公司、KJT Enterprises, Inc.、哈里伯顿能源服务公司、斯伦贝谢技术公司为其在天然气水合物生产技术领域的开发成果申请了专利。美国地质调查局(USGS)、劳伦斯伯克利国家实验室、国家能源技术实验室(NETL)、德克萨斯农工大学在这一领域开展研究。
生物能技术专利由 Xyleco Inc、Celanese International Corporation、Solyzame, Inc.、Heliae Development LLC、UOP LLC 拥有。同一领域的科学研究由国家可再生能源实验室(NREL)、加州大学、爱荷华州立大学和普渡大学进行。
许多公司在可再生能源技术领域申请发明专利并开展研究。在太阳能领域——SunPower公司、3M创新地产公司、波音公司、俄亥俄州PPG工业公司在发明数量方面处于领先地位。大多数出版物来自国家可再生能源实验室 (NREL)、桑迪亚国家实验室、加州大学和麻省理工学院 (MIT)。风能领域的发明已获得通用电气、Frontier Wind, LLC.、Clipper Windpower LLC、Modular Wind Energy Inc. 的专利,并由国家可再生能源实验室 (NREL)、马萨诸塞大学、德克萨斯农工大学进行大学和桑迪亚国家实验室。
| Sources: 1. CO2 total emission by countries 2020 / European Commission / Joint Research Centre (JRC) / Emission Database for Global Atmospheric Research (EDGAR)*208 2. CO2 per capita emission 2020/European Commission/Joint Research Centre (JRC) / Emission Database for Global Atmospheric Research (EDGAR) *208 3. Forest area 2020 (% of land area) / The Global Forest Resources Assessment 2020 / Food and Agriculture Organization of the United Nations *234 4. Forest area change 2010-2020 (1000 ha/year) / The Global Forest Resources Assessment 2020 / Food and Agriculture Organization of the United Nations *234 5. The Environmental Performance Index (EPI) 2020 / Rankings / Yale Center for Environmental Law & Policy / Yale University *180 6. Annual freshwater withdrawals (m3 per capita), 2017 *179 Annual freshwater withdrawals, total (billion m3), 2017 – Food and Agriculture Organization, AQUASTAT data. /License: CC BY-4.0; Population – United Nations, Department of Economic and Social Affairs, Population Division (2019). World Population Prospects 2019, custom data acquired via website. Retrieved 15 November 2021 7. The National Footprint Accounts 2017 (Biocapacity Credit / Deficit) / Global Footprint Network *188 8. Methane emissions (kt of CO2 equivalent), 2018 / Data for up to 1990 are sourced from Carbon Dioxide Information Analysis Center, Environmental Sciences Division, Oak Ridge National Laboratory, Tennessee, United States. Data from 1990 are CAIT data: Climate Watch. 2020. GHG Emissions. Washington, DC: World Resources Institute. Available at: License : Attribution-NonCommercial 4.0 International (CC BY-NC 4.0) *191 9. The Climate Change Performance Index (CCPI) 2022 / Overall Results / Jan Burck, Thea Uhlich, Christoph Bals, Niklas Höhne, Leonardo Nascimento / Germanwatch, NewClimate Institute & Climate Action Network *60 * Total number of countries participating in ranking 图 15. 美国环境指数 |
美国在2022年气候变化绩效指数(CCPI)中排名第28位,该指数包括64个国家,其排放量占全球能源相关CO 2 排放量的90 %以上;美国被认为是表现“中等”的国家,在过去三年中其地位显着提高。
就森林面积占全国的百分比而言,2020年美国在234个国家中排名第106位;然而,2010-2020 年的变化趋势看起来非常积极;按照这个标准,该国排名世界第七,落后于中国、澳大利亚和智利。
在主要评估各国政府环境绩效的环境绩效指数 (EPI) 排名中,2020 年,该国在 180 个国家中排名第 24位
。生态足迹图谱评级加剧了总体负面情况。美国是许多主要的生态债务国之一。
[1] List of sovereign states and dependencies by area / Wikipedia / https://en.wikipedia.org/wiki/List_of_sovereign_states_and_dependencies_by_area
[2] List of countries and dependencies by population density / Wikipedia / https://en.wikipedia.org/wiki/List_of_countries_and_dependencies_by_population_density
[3] United States / The world factbook / Library / Central Intelligence Agency / https://www.cia.gov/
[4] GDP, PPP (constant 2011 international $) / World Bank, International Comparison Program database. License: CC BY-4.0 / Data / The World Bank / http://www.worldbank.org/
[5] GDP per capita, PPP (current international $)/ World Bank, International Comparison Program database. License: CC BY-4.0 / Data / The World Bank / http://www.worldbank.org/
[6] BP Statistical Review of World Energy 2021 (PDF) / BP / https://www.bp.com/
[7] Reserves and Capacity / International Energy Statistics / Geography / U.S. Energy Information Administration / http://www.eia.gov/beta/international/
[8] Sources and Uses/ U.S. Energy Information Administration (2020 – Jan. 13, 2022) / https://www.eia.gov/
[9] How much coal is in the United States? / Coal / Energy Explained / U.S. Energy Information Administration (November 15, 2018 ) / https://www.eia.gov/
[10] BGR (2019) : Energiestusdie 2019. Daten und Entwicklungen der deutschen und globalen Energieversorgung (21).—202S., Hannover. (PDF) / Bundesanstalt für Geowissenschaften und Rohstoffe (BGR) / http://www.bgr.bund.de/
[11] 2006 IPCC Guidelines for National Greenhouse Gas Inventories, Volume 2, Energy, Fugitive Emissions (PDF) / The Intergovernmental Panel on Climate Change (IPCC) / www.ipcc-nggip.iges.or.jp
[12] Coalbed Methane / Data / U.S. Energy Information Administration (Jan. 13, 2022) / https://www.eia.gov/
[13] Shale Gas / U.S. Energy Information Administration (Jan. 13, 2022)/ https://www.eia.gov/
[14] World Shale Resource Assessments / Analysis / U.S. Energy Information Administration (September 24, 2015) / https://www.eia.gov/
[15] 2016 Survey of Energy Resources (PDF) / 2016 / Uploads / World Energy Council / https://www.worldenergy.org/
[16] 2010 Survey of Energy Resources (PDF) / 2010 / Uploads / World Energy Council / https://www.worldenergy.org/
[17] Solar resource data obtained from the Global Solar Atlas, owned by the World Bank Group and provided by Solargis / Global Solar Athlas / http://globalsolaratlas.info/
[18] Solar Energy Potential / Maps / U.S. Department of Energy / https://www.energy.gov/
[19] Wind Map / Global Wind Atlas 2.0, a free, web-based application developed, owned and operated by the Technical University of Denmark (DTU) in partnership with the World Bank Group, utilizing data provided by Vortex, with funding provided by the Energy Sector Management Assistance Program (ESMAP). For additional information: https://globalwindatlas.info
[20] U.S. Potential Wind Capacity in Megawatts at 80 M / U.S. Department of Energy / https://windexchange.energy.gov/
[21] Estimating Renewable Energy Economic Potential in the United States (PDF) / NREL / https://www.nrel.gov/
[22] Hydro (PDF) / World Energy Council / https://www.worldenergy.org/
[23] Agricultural land (% of land area) / Food and Agriculture Organization, electronic files and web site. License: CC BY-4.0 / Data / The World Bank / http://www.worldbank.org
[24] Forest area (% of land area) /Food and Agriculture Organization, electronic files and web site. License: CC BY-4.0 / Data / The World Bank / http://www.worldbank.org/
[25] 2016 Annual U.S. & Global Geothermal Power Production Report (PDF) / Geothermal Energy Association / http://geo-energy.org/
[26] What a Waste 2012 / Food and Agriculture Organization, electronic files and web site. License: CC BY-4.0 / Data / The World Bank / http://www.worldbank.org
[27] International Energy Statistic / Geography / U.S. Energy Information Administration (Jan. 13, 2022) /https://www.eia.gov/
[28] COUNTRY COMPARISON :: REFINED PETROLEUM PRODUCTS - IMPORTS / The world factbook / Library / Central Intelligence Agency / https://www.cia.gov/
[29] AFPM United States Refining and Storage Capacity report (PDF) / American Fuel & Petrochemical Manufacturers (AFPM) / https://www.afpm.org/
[30] Top 10 U.S. refineries* operable capacity / Energy Explained / U.S. Energy Information Administration (September 28, 2018) / https://www.eia.gov/
[31] SPR Quick Facts and FAQs / Strategic Petroleum Reserve / U.S. Department of Energy / https://www.energy.gov/
[32] North American LNG Import – Existing – As of January 24, 2018 (PDF) / Export Terminals / Federal Energy Regulatory Commission (FERC) / https://www.ferc.gov/
[33] Our Business / Aux Sable / http://www.auxsable.com/
[34] Table 14: Underground natural gas storage capacity by state (PDF) / U.S. Energy Information Administration (December 31, 2016) / http://www.eia.gov/
[35] Red Leaf Resources / Wikipedia / https://en.wikipedia.org/wiki/Red_Leaf_Resources
[36] U.S. Tight Oil Production 2017 / All about Shale / http://www.allaboutshale.com/
[37] Belridge Producing Complex / Aera / https://www.aeraenergy.com/
[38] Coal Mine Methane (CMM) Recovery Opportunities Map / United States Environmental Protection Agency / https://www.epa.gov/
[39] GAS -to liquid (GTL): is it an attractive route for gas monetization? Part III / Egypt Oil and Gas / http://egyptoil-gas.com/
[40] Three Options for Output, Feedstock, and Footprint / Oberon Fules / http://oberonfuels.com/
[41] Dakota Gasification Company / Wikipedia / https://en.wikipedia.org/wiki/Dakota_Gasification_Company
[42] Underground Coal Gasification: Test drilling confirms large commercial coal resource / CIRI / http://www.ciri.com/
[43] Wyoming State Geological Survey / https://www.wsgs.wyo.gov/
[44] Lamberts Point Coal Terminal, Norfolk, VA / Norfolk Southern / http://www.nscorp.com/content/nscorp/en.html
[45] Florida Power & Light / Wikipedia / http://en.wikipedia.org/wiki/Florida_Power_&_Light#Gas_plants
[46] Manatee Oil Power Plant / Industry About / https://www.industryabout.com/
[47] Scherer Steam Generating Station / Source Watch / http://www.sourcewatch.org/
[48] James M. Barry Electric Generating Plant / Wikipedia / http://en.wikipedia.org/wiki/James_M._Barry_Electric_Generating_Plant
[49] Bath County Pumped Storage Station / DOE Global Energy Storage Database / http://www.energystorageexchange.org/
[50] Projects & Facilities / U.S. Department of the Interior | Bureau of Reclamation / http://www.usbr.gov/
[51] US Uranium Mining and Exploration / World Nuclear Association / http://www.world-nuclear.org/
[52] 5 Largest Nuclear Power Plants in America / Maxx Chatsko / Jan 15, 2014 / The Motley Fool / http://www.fool.com/
[53] Nevada's Silver Peak Lithium Mine Prepares To Ramp Up Production / Wednesday, February 1st 2017, 4:28 PM PST by Paul Nelson / 2News / http://www.ktvn.com/
[54] Wind power in the United States / Wikipedia / https://en.wikipedia.org/wiki/Wind_power_in_the_United_States
[55] Alta Wind Energy Center / Wikipedia / http://en.wikipedia.org/wiki/Alta_Wind_Energy_Center
[56] Vestas’ receives 190 MW order in the U.S. and passes 10.5 GW in global order intake for 2017 / 30 Dec 2017 / Vestas / https://www.vestas.com/
[57] Siemens Gamesa awarded two wind turbine projects totaling 330 MW of G132-3.465 MW turbines in the U.S./ Siemens Gamsea / http://www.siemensgamesa.com/
[58] Solar Star / Wikipedia / https://en.wikipedia.org/wiki/Solar_Star
[59] United States / CPV Consortium / http://cpvconsortium.org/
[60] SEGS California Complex CSP Parabolic type plant / National Renewable Energy Laboratory: CSP Projects / https://www.nrel.gov/
[61] Solana Generating Station / National Renewable Energy Laboratory: CSP Projects / https://www.nrel.gov/
[62] Ivanpah Solar Power Facility / National Renewable Energy Laboratory: CSP Projects / https://www.nrel.gov/
[63] Crescent Dunes Solar Energy Project / National Renewable Energy Laboratory: CSP Projects / https://www.nrel.gov/
[64] Kimberlina Solar Thermal Energy Plant / Wikipedia / https://en.wikipedia.org/wiki/Kimberlina_Solar_Thermal_Energy_Plant
[65] Infinia begins commissioning 1.5 MW dish Stirling solar Concentrating Solar Power plant in Utah / 15-06-2013 / Helios CSP / http://helioscsp.com/
[66] Ocean Energy The Ocean is a Vast, Largely Untapped Energy Resource / Hawaiian Electric / https://www.hawaiianelectric.com/
[67] Current and future tidal power schemes / Wikipedia / https://en.wikipedia.org/wiki/Tidal_power#Current_and_future_tidal_power_schemes
[68] Ocean Thermal Energy Conversion (OTEC) / Natural Energy Laboratory of Hawaii Authority (NELHA) / http://nelha.hawaii.gov/
[69] Steamboat Complex (63.8 MW) / Richard Burdett (27 MW) / Galena II-III (45 MW) / OpenEI / https://openei.org
[70] Nevada Geothermal Power Plants / Geothermal Energy Association / http://www.geo-energy.org/
[71] Imperial Valley / BHE Renewables / https://www.bherenewables.com/
[72] California Geothermal Power Plants (PDF) / Geothermal Energy Association / http://www.geo-energy.org/
[73] Calpine: Americas’s largest geothermal energy producer / U.S. Department of Energy / http://energy.gov/
[74] Merchant Hydrogen Plant Capacities in North America / HYARC / Hydrogen Tools / https://www.h2tools.org/
[75] The Business case for Fuel Cells: Delivering Sustainable Value (PDF) / Thomas G.Benjamin Argonne National Laboratory; Jennifer Gangi, Fuel Cell and Hydrogen Energy Association; Sandra Curtin, Fuel Cell and Hydrogen Energy Association / U.S. Department of Energy / http://energy.gov/
[76] U.S. Biomass Power Facilities (PDF) / Biomass Power Association / http://usabiomass.org/
[77] Biodiesel / Biodiesel Magazine / http://www.biodieselmagazine.com/
[78] Biorefinery Locations / Renewable Fuels Association / http://www.ethanolrfa.org/
[79] U.S. Ethanol Plants / Ethanol Producer Magazine / http://www.ethanolproducer.com/
[80] Le Sueur (PDF) / American Biogas Council / https://americanbiogascouncil.org/
[81] Plainfield / Greenleaf Power / http://www.greenleaf-power.com/
[82] Gasification of Non-Recycled Plastics From Municipal Solid Waste In the United States / August 13, 2013. / Gershman, Brickner & Bratton, Inc.. / American Chemistry Council, Inc. (PDF) / https://plastics.americanchemistry.com/
[83] Alter NRG Plasma Gasification: The Next Generation of Waste-To-Energy Solutions (PDF) / Pronto Marketing / https://d2oc0ihd6a5bt.cloudfront.net/
[84] Large Industrial Users of Energy Biomass, September 2013 (PDF)/ Year 2013 / Publications / IEA Bioenergy Task 40 / http://bioenergytrade.org/
[85] Energy Recovery Council: 2016 Directory of Waste-to-energy Facilities (PDF) / Energy Recovery Council / http://energyrecoverycouncil.org/
[86] Burning landfill gas has environmental and economic benefits / Power / http://www.powermag.com/
[87] DOE Bioenergy Technologies Office (BETO) 2015 Project Peer Review (PDF) / U.S. Department of Energy / https://www.energy.gov/
[88] Projects / IEA Bioenergy Task 39: Commercializing Liquid Biofuels from Biomass / http://demoplants.bioenergy2020.eu/
[89] Thermogen switches technology to Zilkha / Anna Simet / March 12, 2014 / Biomass Magazine / http://biomassmagazine.com/
[90] US energy policy in the Trump Administration and 115th Congress (PDF) / January 2017 / EY / http://www.ey.com/
[91] The Trump Energy Plan: A Sea Change in U.S. Energy Policy / David Blackmon / November 14, 2017 / Shale Magazine / https://shalemag.com/
[92] The Trump Administration Keeps Trying to Sell Federal Land for Oil Drilling. But Nobody Wants It / TIME / http://time.com/
[93] United States withdrawal from the Paris Agreement / Wikipedia / https://en.wikipedia.org/wiki/United_States_withdrawal_from_the_Paris_Agreement
[94] Paris Climate Agreement: Everything You Need to Know / February 19, 2021 / NRDC / https://www.nrdc.org/
[95] 2021 U.S. Geothermal Power Production and District Heating Market Report (PDF) / July 2021 / NREL / https://www.nrel.gov/
图表和曲线的来源在图像下方指定。
有关美国能源行业的更多信息,请参见此处