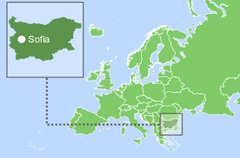

Bulgarien, offiziell Republik Bulgarien, ist ein Land in Südosteuropa, das den östlichen Teil der Balkanhalbinsel einnimmt. Das Land grenzt im Norden an Rumänien, im Süden an Griechenland und die Türkei (an die Türkei und Griechenland) und im Westen an Serbien und Nordmazedonien. Die Gesamtlänge der Küste des Landes beträgt 354 km [3].
Laut Statistik von 2023 leben in Bulgarien etwa 7 Millionen Menschen. In Bezug auf die Bevölkerungsdichte liegt das Land weltweit auf Platz 158 von 248 betrachteten Ländern. Die Landeshauptstadt und größte Stadt ist Sofia. Die politische Regierungsform ist eine parlamentarische Republik und die Verwaltungskarte des Landes ist in 28 Provinzen unterteilt [1,2,3].
| Bulgaria / Republic of Bulgaria | ||
|---|---|---|
| Capital: Sofia | Density: 63/km2 | Currency: Lev (BGN) |
| Official languages: Bulgarian | Life expectancy at birth: 73.61 years | GDP (PPP): $216.499 billion (2023 est.) |
| National Day: 03 March | Area (land): 110,993.6 km2 | GDP - per capita (PPP): $33,780 (2023 est.) |
| Population: 6,827,736 (2023 est.) | Coastline: 354 km | Internet country code: .bg |
Source: [1,2,3,4,5]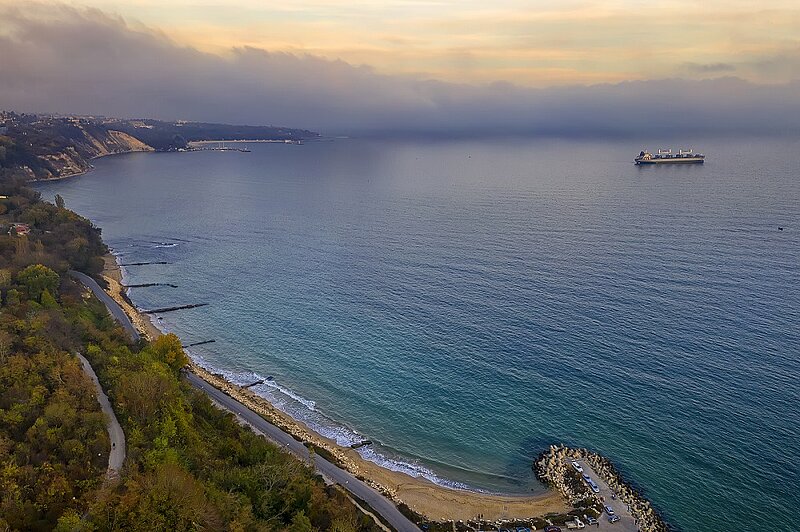
A beautiful aerial view from drone to the coastline, Black sea near Varna, Bulgaria. Envato. RZLB2QXP4M
Die Ranking-Positionen Bulgariens im Vergleich zu anderen Ländern wurden anhand einer umfangreichen Liste von Wirtschafts-, Energie-, Innovations- und Bildungsindizes sowie anhand von Kennzahlen ermittelt, die den Zustand der Umwelt widerspiegeln. Zu den Wirtschaftsindizes zählen beispielsweise das Pro-Kopf-BIP, das jährliche durchschnittliche BIP-Wachstum, Hochtechnologieexporte und andere. Die Liste der Energieindizes umfasst nachgewiesene Öl-, Gas- und Kohlereserven, das kombinierte Produktions-Verbrauchs-Verhältnis, den Energieverbrauch usw. Jeder der Indizes verfügt über eine Rangliste der enthaltenen Mitgliedsländer. Da die Anzahl der Länder in jeder Bewertung für jeden Index unterschiedlich ist, wird die Positionierung des betreffenden Landes in einem speziellen Diagramm angezeigt, wobei die vertikale Achse eine einheitliche relative Skala von 0 bis 1 darstellt, während die horizontale Achse die verschiedenen Indizes bezeichnet und die entsprechenden Nummern, die sich auf die unten aufgeführten Beschreibungen beziehen.
Daher wird in einem solchen relativen „0-1“-Diagramm die Position des Landes mit einem Punkt im Verhältnis zu seiner Position in der ursprünglichen Bewertungsliste markiert. Wenn das Land hinsichtlich des ausgewählten Indikators zu den Spitzenreitern gehört, wird es im oberen grünen Bereich des entsprechenden Diagramms mit „0-1“ nahe 1 markiert. Wenn das Land in der Bewertungsliste ein Außenseiter ist, wird es markiert im unteren roten Bereich des Diagramms „0-1“ usw. Für alle Länder wird eine einzige Indexliste verwendet. Wenn ein Land in keinem Index auf der Rangliste steht, wird die entsprechende Position in den Charts nicht angezeigt.
Rangliste Bulgariens in der Liste der Wirtschaftsindizes:
| Sources: 1. GDP (purchasing power parity), 2020 est. / The World Factbook/Library/Central Intelligence Agency *228 2. GDP - per capita (PPP), 2020 / The World Factbook/Library/Central Intelligence Agency *229 3. Inflation rate (consumer prices), 2019 est. / The World Factbook/Library/Central Intelligence Agency *228 4. Charges for the use of intellectual property, receipts (BoP, current US$), 2020 / International Monetary Fund, Balance of Payments Statistics Yearbook, and data files. / License: CC BY-4.0 *88 5. The Global Competitiveness Index 2019 / Rankings / Reports / World Economic Forum *141 6. High-technology exports (current US$) 2019-2020 / United Nations, Comtrade database through the WITS platform / License: CCBY-4.0 / Data *134 7. 2021 Index of Economic Freedom / International Economies / The Heritage Foundation *178 8. Reserves of foreign exchange and gold, 2017 est. / The World Factbook / Library / Central Intelligence Agency *195 9. Annual average GDP growth in %, for the last 10 years (2011-2020) / World Bank national accounts data, and OECD National Accounts data files / License: CC BY-4.0 *206 10. Public debt (% of GDP), 2017 est. / The World Factbook / Library / Central Intelligence Agency (from smallest to largest) *210 * Total number of countries participating in ranking Abbildung 1. Wirtschaftsindizes von Bulgarien |
Bei den meisten der in der Grafik dargestellten Wirtschaftsindikatoren liegt Bulgarien über dem Mittelfeld der Rangliste. Die schwächsten Punkte der bulgarischen Wirtschaftsindikatoren sind die Inflationsrate (0,35) und das jährliche durchschnittliche BIP-Wachstum in % (0,42). Bulgarien verfügt über die besten Indizes unter den vorgestellten Indizes für die Staatsverschuldung in % des BIP (0,86), den Index der Wirtschaftsfreiheit 2021 (0,80) und die Devisen- und Goldreserven (0,74).
Bulgarien verfügt nicht über nennenswerte Reserven an fossilen Brennstoffen. Im Norden des Landes, in der Gegend von Pleven und auf dem Schelf des Schwarzen Meeres, gibt es unbedeutende Öl- und Erdgasvorkommen, die 0,001 % bzw. 0,003 % der weltweiten Gesamtvorkommen ausmachen. Darüber hinaus verfügt Bulgarien über einige Kohlereserven, die 0,23 % der gesamten weltweiten Kohlereserven ausmachen.
Bezogen auf Tonnen Öläquivalent entfielen den Daten aus dem Jahr 2024 zufolge die konventionellen nachgewiesenen Reserven zu 99,6 % auf Kohle, gefolgt von Erdgas – 0,3 % und Rohöl – 0,1 % (Abb. 5).
Tabelle 1. Fossile Energieressourcen Bulgariens
| Resource /Explanations | Crude oil* | Natural gas* | Coal* | Shale Gas** | Tight Oil** | Oil Shale | Coalmine methane |
|---|---|---|---|---|---|---|---|
| Value | 0.02 (0.001%) | 0.2 (0.003%) | 2608 (0.23%) | 16.6 | 0.2 | 0.125 | 2.57 - 9.15 |
| Unit | billion barrels | Tcf | million short tons | Tcf | billion barrels | billion barrels | bcm |
| Year | 2021 | 2020 | 2021 | 2015 | 2015 | 2008 | 2020 |
| Source | [6] | [6] | [6] | [7] | [7] | [8] | [9] |
*Der Anteil der Reserven des Landes an der weltweiten Gesamtmenge ist in Klammern angegeben.
**Unbewiesene technische Förderfähigkeit.
Bulgarien verfügt über schätzungsweise 500 Milliarden Kubikmeter Schiefergas, die derzeitige Gesetzgebung erlaubt jedoch keine Förderung. Nach Protesten lokaler Gemeinden und Umweltaktivisten verhängte Bulgarien 2012 ein Verbot der Exploration und Förderung von Schiefergas mithilfe der hydraulischen Fracking-Technologie. Angesichts der jüngsten Entwicklungen fordern einige Experten eine Aufhebung des Verbots der Schiefergasförderung, um die starke Abhängigkeit Bulgariens von russischen Energieressourcen zu verringern [10].
Tabelle 2. Erneuerbare Energieressourcen Bulgariens
| Resource/ explanations | Solar Potential (GHI)* | Wind Potential (50 м)* | Bio Potential (agricultural area) | Bio Potential (forest area) | Hydro energy Potential** | Geothermal Potenial | Municipal Solid Waste |
|---|---|---|---|---|---|---|---|
| Value | 3.8-4.1 | 5.0-6.0 | 46.5 | 35.9 | 26 540 | 164 | 408 |
| Unit | kWh/m2/day | m/s | % of land area | % of land area | GWh/year | MWe | kg per capita |
| Year | 2020 | 2020 | 2020 | 2020 | 2013 | 2016 | 2021 |
| Source | [11] | [12] | [13] | [14] | [15] | [16] | [17] |
*for most of the territory of the country
**gross theoretical capability
Bulgarien verfügt über ein recht großes Potenzial für die Entwicklung verschiedener Arten erneuerbarer Energien. Dabei handelt es sich vor allem um Onshore- und Offshore-Windenergie mit Windgeschwindigkeiten von bis zu 6,5 m/s in 50 m Höhe im östlichen Teil des Landes, entlang der Schwarzmeerküste. Noch bedeutendere Offshore-Ressourcen gibt es in der Schwarzmeerregion.
MOURGASH. BULGARIA
Latitüde: 42.83, Longitude: 23.67
Average speed: 8.74 m/s Operational share: 85%
Average daily wind speed for 10 years of observations, m/s, 10 m above the ground
Source: based on NOAA U.S. Department of Commerce
Detailed information: Interactive map of wind resources
MOURGASH. BULGARIA
Latitüde: 42.83, Longitude: 23.67
Average daily sky coverage over 10 years of observations, %
CLR - clear, SCT - scattered from 1/8 TO 4/8, BKN - broken from 5/8 TO 7/8, OVC - overcast, OBS - obscured, POB - partial obscuration
Source: based on NOAA U.S. Department of Commerce
Detailed information: Interactive map of solar resources
Laut einer aktuellen Studie im Auftrag der European Climate Foundation kann Bulgarien technisch gesehen mehr Strom aus Wind erzeugen als derzeit des gesamten Stromverbrauchs im Land. Das gesamte technische Potenzial für Windkraft in den fünf führenden Regionen – Dobrich, Varna, Shumen, Razgrad und Silistra – ist mit insgesamt 14,7 GW sehr hoch. Das ist fast so viel, wie derzeit ganz Bulgarien an Strom verbraucht. Das Haupthindernis für den Ausbau der Windenergie ist jedoch die bestehende Netzinfrastruktur, die noch lange nicht für die Aufnahme derart großer Strommengen geeignet ist [18].
Bulgarien verfügt insbesondere im südlichen Teil des Landes über ein hohes Sonneneinstrahlungspotenzial. Die höchste Sonneneinstrahlungsintensität (WHI) beträgt 4,1–4,4 kWh/m 2 pro Tag und ist im südwestlichen Teil des Landes, in der Region Blagoevgrad, verteilt. Die Solarenergie wird heute noch nicht vollständig genutzt, sie wird jedoch sowohl auf der Ebene der Haushalte und Institutionen als auch im großen Maßstab mit hoher Geschwindigkeit ausgebaut.
Wasserkraft spielt eine wichtige Rolle in der Energiebilanz Bulgariens und verfügt über ein hohes Potenzial für die weitere Entwicklung, beispielsweise an der Donau, wo Rumänien und Bulgarien den Bau und künftigen gemeinsamen Betrieb zweier Wasserkraftprojekte vereinbart haben. Das erste Kraftwerk mit einer Leistung von 840 MW wird zwischen Turnu Măgurele in Rumänien und Nikopol in Bulgarien errichtet [19].
Laut [6] betrug die Gesamtproduktion an Primärenergie in Bulgarien im Jahr 2022 0,473 Billiarden Btu, während der Verbrauch bei 0,737 Billiarden Btu lag. Damit betrug der Anteil der heimischen Produktion am Primärenergieverbrauch etwa 58,4 %. Dies macht Bulgarien zu einem von Energieimporten abhängigen Land.
Laut der BP Statistical Review of World Energy 2022 betrug der gesamte Primärenergieverbrauch in Bulgarien im Jahr 2021 0,78 Exajoule [20].
Source: U.S. Energy Information Administration (Mar 2024) / www.eia.gov
Abbildung 2. Die Produktion und der Verbrauch fossiler Brennstoffe in Bulgarien (Kohle – links, Gas – in der Mitte, Öl – rechts),
Wie aus der Grafik ersichtlich ist Wie oben dargestellt, übersteigt der Verbrauch Bulgariens an Erdgas und Rohöl die geringe Produktion bei weitem. Somit ist der Ölverbrauch im Jahr 2022 15-mal höher als die inländische Produktion und die Nachfrage nach Erdgas ist 100-mal höher als die interne Kapazität des Landes. Wenn wir uns die Kohledaten ansehen, ist die Kohleproduktion etwas höher als der Verbrauch.
Source: U.S. Energy Information Administration (Mar 2024) / www.eia.gov
Figure 3. Electricity production in Bulgaria
Bulgaria is fully self-sufficient in electricity and exports some of the domestically produced electricity. Over the 10 years presented in the chart above, the amount of electricity produced and consumed in the country has remained approximately at the same level. With regard to the distribution of electricity generation sources, there is a slight increase in the share of renewable energy sources and a decrease in the share of fossil fuels.
According to statistics provided by the Transmission System Operator of the Republic of Bulgaria [21], about 41% of electricity was generated by nuclear power plants, followed by thermal power plants – 30.31%, hydroelectric generation – 16%, solar power – 11%, thermal power plants – 10%, wind – 5%, and bioenergy – 0.46%. These data indicate that the share of renewable energy sources in the country's electricity production is growing rapidly.
| Sources: 1. Crude oil proved reserves, 2021 / International Energy Statistic/Geography / U.S. Energy Information Administration (Nov 2021)*98 2. Natural gas proved reserves 2021 / International Energy Statistic / Geography / U.S. Energy Information Administration (Nov 2021) *99 3. Total recoverable coal reserves 2019 / International Energy Statistic / Geography / U.S. Energy Information Administration (Nov 2021) *81 4. Combination production-consumption for Crude oil 2018 / International Energy Statistic / Geography / U.S. Energy Information Administration (Nov 2021) *219 5. Combination production-consumption for Natural gas 2019 / International Energy Statistic / Geography / U.S. Energy Information Administration (Nov 2021) *123 6. Combination production-consumption for Coal 2019 / International Energy Statistic / Geography / U.S. Energy Information Administration (Nov 2021) *128 7. Electricity – from other renewable sources (% of total installed capacity), 2017 est. / The World Factbook / Library / Central Intelligence Agency *170 8. GDP per unit of energy use (PPP per unit of oil equivalent), 2020 *66 Primary energy consumption - BP Statistical Review of World Energy 2021/BP;GDP (purchasing power parity) - The World Factbook/Library/Central Intelligence Agency 9. Energy use (primary energy use of oil equivalent per capita) 2020 *127 Primary energy consumption – BP Statistical Review of World Energy 2021; Population - United Nations, Department of Economic and Social Affairs, Population Division (2019). World Population Prospects 2019, custom data acquired via website. Retrieved 15 November 2021*66 10. The Global Energy Architecture Performance Index Report (EAPI) 2017 / Rankings / Reports / World Economic Forum 11. Electric power consumption (kWh per capita), 2016 *217 Electricity Consumption - The World Factbook / Library / Central Intelligence Agency; Population - United Nations, Department of Economic and Social Affairs, Population Division (2019). World Population Prospects 2019, custom data acquired via website. Retrieved 15 November 2021 12. Combination of electricity production-consumption (kWh)/The World Factbook/Library/Central Intelligence Agency *216 * Total number of countries participating in ranking Figure 4. Energy indices of Bulgaria |
Since Bulgaria has no significant fossil fuel reserves, the country's positions in crude oil (0.15) and natural gas (0.14) are the lowest of those in the chart above. Consequently, Bulgaria has a relatively low ratio of the Combined production-consumption for oil (0.25) and natural gas (0.30). The strongest indicators reflected on the graph are Combination of electricity production-consumption (0.84) and Electricity – from other renewable sources as % of total installed capacity (0.76). Apart from that, the country is well-positioned in Electric power consumption per capita (0.71).
In Bulgarien gibt es zwei Produktionsregionen für fossile Brennstoffe. Das erste liegt im Osten des Landes auf dem Festlandsockel des Schwarzen Meeres, wobei das Hauptfeld das Erdgasfeld Galata ist, das etwa 25 km südöstlich von Varna vor der Küste liegt. Nördlich davon befindet sich Bulgariens erstes entdecktes Ölfeld, Tulenovo, ebenfalls vor der Küste. Darüber hinaus befinden sich im Osten des Landes weitere Infrastruktureinrichtungen wie Gas- und Ölraffinerien sowie Lager und Terminals für den Umschlag von in der Region gefördertem Öl und Gas sowie importierten Produkten. Darüber hinaus gibt es im Nordwesten Bulgariens, in der Region Pleven, eine Onshore-Region, in der Erdgas und Öl gefördert werden.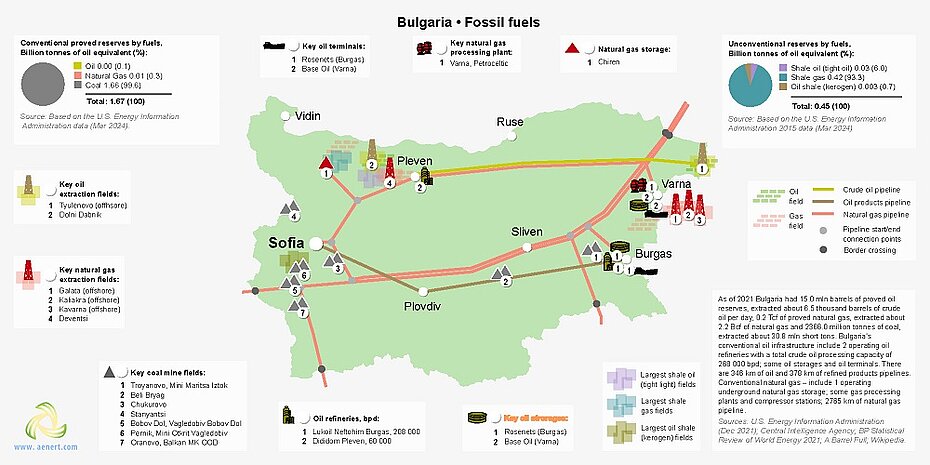
Abbildung 5. Grundlegende Infrastruktureinrichtungen des fossilen Brennstoffsektors in Bulgarien
Obwohl Bulgariens inländischer Erdgasmarkt klein ist, verfügt das Land über ein ausgedehntes Netz von Gaspipelines, die sowohl den Bedarf Bulgariens als auch den der Nachbarländer Türkei, Griechenland und Mazedonien decken, indem sie dort importiertes Gas liefern.
Die Kohlevorkommen Bulgariens befinden sich größtenteils im westlichen Teil des Landes und in der Nähe des Schwarzen Meeres. Als Teil seiner Klimaschutzverpflichtungen hat Bulgarien einen Ausstieg aus der Kohle bis 2040 angekündigt, was angesichts des schlechten Zustands der bulgarischen Kohleindustrie eine sinnvollere Lösung wäre, als die Einhaltung von Emissionsnormen zu erreichen, was einen enormen Aufwand erfordern würde Investitionen [22].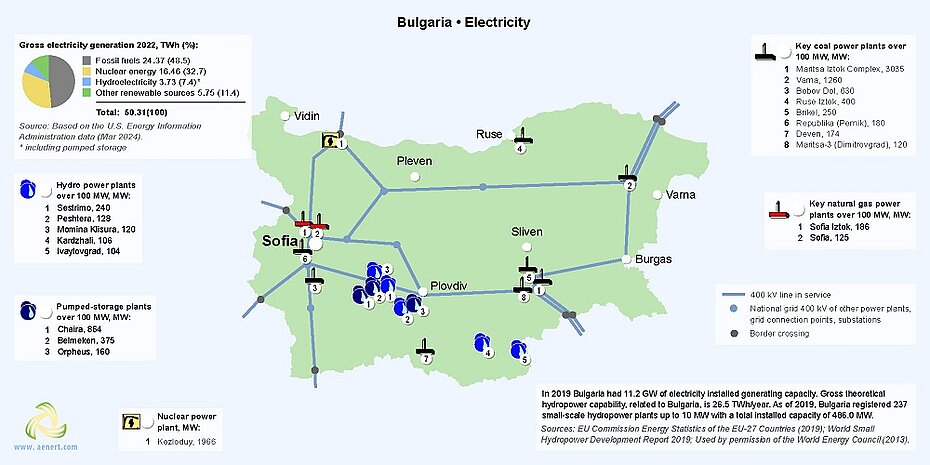
Abbildung 6. Stromproduktion in Bulgarien
Wie bereits erwähnt, stammt ein erheblicher Teil (etwa 33 %) des bulgarischen Stroms aus Kernenergie. Das Land betreibt derzeit zwei Kernkraftwerke in Kosloduj, 200 km nördlich von Sofia. Anfang 2023 gab die bulgarische Regierung die Energiestrategie des Landes bis 2053 bekannt. Zu den strategischen Zielen für die Entwicklung des Energiesektors gehört der Bau von zwei neuen Reaktoren in Kosloduj und zwei in Belene, wodurch 4.000 MW neue Kernkapazität bereitgestellt werden [23]. .
Nach Angaben der Energy Information Administration wurden im Jahr 2022 etwa 7,4 % des bulgarischen Stroms durch Wasserkraftwerke erzeugt. Sestrimo liegt am Fluss Kriva im östlichen Rila-Gebirge und ist mit einer Leistung von 240 MW das bedeutendste Wasserkraftprojekt des Landes. Abbildung 7. Erneuerbare Energien in Bulgarien
Die meisten bulgarischen Windparks befinden sich im Nordosten des Landes, wobei das 156-MW-Onshore-Kraftwerk Saint Nikola in Dobrich das größte Windkraftprojekt in Bulgarien ist.
Einer der größten Solarparks in Bulgarien, der an das nationale Stromnetz angeschlossen ist, ist der 66-Megawatt-Solarpark Dalgo Pole, der etwa 120 Kilometer südöstlich der Hauptstadt Sofia und in der Nähe der Stadt Plovdiv liegt [24].
Gemäß der bulgarischen Energiestrategie [23] strebt das Land bis 2030 den Bau von 7 GW Solar- und 2 GW Windkraftanlagen sowie 12 GW Solar- und 4 GW Windkraftanlagen bis 2050 an. Darüber hinaus sollen insgesamt 870 MW installiert werden Bis 2030 sind neue Wasserkraftprojekte und bis 2050 1.270 MW geplant. Darüber hinaus wird ein wichtiger Faktor für die zukünftige Entwicklung des Sektors die Wasserstoffproduktion sein, die Bulgariens Abhängigkeit von Erdgasimporten verringern und ersetzen soll.
| Sources: 1. The Global Innovation Index 2021, Rankings / Knowledge / World Intellectual Property Organization / Cornell University, INSEAD, and WIPO (2021): Energizing the World with Innovation. Ithaca, Fontainebleau, and Geneva *132 2. Patent Grants 2011-2020, resident & abroad / Statistical country profiles / World Intellectual Property Organization *185 3.Patents in Force 2020 / Statistical country profiles / World Intellectual Property Organization *109 4. QS World University Rankings 2022 *97 5. SCImago Country Rankings (1996-2020) / Country rankings / SCImago, (n.d.). SIR-SCImago Journal & Country Rank [Portal]. Retrieved 17 Nov 2021 *240 6. Internet users in 2018 / The World Factbook / Central Intelligence Agency *229 7. Internet users in 2018 (% Population) / The World Factbook / Central Intelligence Agency *229 8. Government expenditure on education, total (% of GDP), 2019 / United Nations Educational, Scientific, and Cultural Organization (UNESCO) Institute for Statistics. License: CCBY-4.0 / Data as of September 2021*177 9. Research and development expenditure (% of GDP), 2018 / UNESCO Institute for Statistics. License: CCBY-4.0 / Data *119 10. Scientific and technical journal articles, 2018 / National Science Foundation, Science and Engineering Indicators. License: CCBY-4.0 / Data *197 * Total number of countries participating in ranking Abbildung 8. Die Indizes für Bildung und Innovation in Bulgarien |
Die meisten Indizes, die die Positionierung des Landes in den verschiedenen internationalen Rankings zum Thema Bildung und Innovation beschreiben, sind überdurchschnittlich gut. Den niedrigsten Platz im Land belegt das QS World University Rankings 2022 (0,13), was zum Teil durch relativ geringe staatliche Bildungsausgaben (0,41) erklärt werden kann. Bulgarien belegt den höchsten Platz unter den im SCImago Country Rankings (0,77) und im Global Innovation Index 2021 (0,73) präsentierten Ländern.
The Belogradchik rocks in Bulgaria. Envato. M976YKQ8C4
| Sources: 1. CO2 total emission by countries 2020 / European Commission / Joint Research Centre (JRC) / Emission Database for Global Atmospheric Research (EDGAR)*208 2. CO2 per capita emission 2020/European Commission/Joint Research Centre (JRC) / Emission Database for Global Atmospheric Research (EDGAR) *208 3. Forest area 2020 (% of land area) / The Global Forest Resources Assessment 2020 / Food and Agriculture Organization of the United Nations *234 4. Forest area change 2010-2020 (1000 ha/year) / The Global Forest Resources Assessment 2020 / Food and Agriculture Organization of the United Nations *234 5. The Environmental Performance Index (EPI) 2020 / Rankings / Yale Center for Environmental Law & Policy / Yale University *180 6. Annual freshwater withdrawals (m3 per capita), 2017 *179 Annual freshwater withdrawals, total (billion m3), 2017 – Food and Agriculture Organization, AQUASTAT data. /License: CC BY-4.0; Population – United Nations, Department of Economic and Social Affairs, Population Division (2019). World Population Prospects 2019, custom data acquired via website. Retrieved 15 November 2021 7. The National Footprint Accounts 2017 (Biocapacity Credit / Deficit) / Global Footprint Network *188 8. Methane emissions (kt of CO2 equivalent), 2018 / Data for up to 1990 are sourced from Carbon Dioxide Information Analysis Center, Environmental Sciences Division, Oak Ridge National Laboratory, Tennessee, United States. Data from 1990 are CAIT data: Climate Watch. 2020. GHG Emissions. Washington, DC: World Resources Institute. Available at: License : Attribution-NonCommercial 4.0 International (CC BY-NC 4.0) *191 9. The Climate Change Performance Index (CCPI) 2022 / Overall Results / Jan Burck, Thea Uhlich, Christoph Bals, Niklas Höhne, Leonardo Nascimento / Germanwatch, NewClimate Institute & Climate Action Network *60 * Total number of countries participating in ranking Abbildung 9. Umweltindizes von Bulgarien |
Bulgarien gehört zur Gruppe der Länder mit hohen Kohlendioxidemissionen – insgesamt (0,31) und pro Kopf (0,26). Diese Tatsache ist mitverantwortlich für die niedrige Platzierung im Climate Change Performance Index 2022 (0,31). Zu den positiven Indikatoren zählen hingegen ein deutlicher Aufwärtstrend bei der Waldfläche (0,91) und relativ hohe jährliche Süßwasserentnahmen (0,81).
[1] List of sovereign states and dependencies by area / Wikipedia / en.wikipedia.org/wiki/List_of_sovereign_states_and_dependencies_by_area
[2] List of countries and dependencies by population density / Wikipedia / en.wikipedia.org/wiki/List_of_countries_and_dependencies_by_population_density
[3] Bulgaria / The world factbook / Library / Central Intelligence Agency / www.cia.gov
[4] GDP, PPP (constant 2011 international $) / World Bank, International Comparison Program database. License: CC BY-4.0 / Data / The World Bank / www.worldbank.org
[5] GDP per capita, PPP (current international $) / World Bank, International Comparison Program database. License: CC BY-4.0 / Data / The World Bank / www.worldbank.org
[6] International Energy Statistic / Geography / Bulgaria / U.S. Energy Information Administration / www.eia.gov/beta/international/
[7] World Shale Resource Assessments / U.S. Energy Information Administration (September 24, 2015) / https://www.eia.gov/
[8] 2010 Survey of Energy Resources (PDF) / 2010 / Uploads / World Energy Council / https://www.worldenergy.org/
[9] Potential for the utilization of coal methane/ aenert.com/technologies/fossil-fuel/unconventional-gas/coal-seam-methane/
[10] Bulgaria is rich with shale gas, but lacks political will to exploit it / 10. Juni 2022 / EURAKTIV / www.euractiv.com/section/energy/news/bulgaria-is-rich-with-shale-gas-but-has-no-political-will-to-exploit-it/
[11] Solar resource data obtained from the Global Solar Atlas, owned by the World Bank Group and provided by Solargis / Global Solar Atlas / globalsolaratlas.info
[12] Bulgaria Wind Map / Global Wind Atlas 2.0, a free, web-based application developed, owned and operated by the Technical University of Denmark (DTU) in partnership with the World Bank Group, utilizing data provided by Vortex, with funding provided by the Energy Sector Management Assistance Program (ESMAP). For additional information: globalwindatlas.info
[13] Agricultural land (% of land area) /Food and Agriculture Organization, electronic files and web site. License: CC BY-4.0 / Data / The World Bank / www.worldbank.org
[14] Forest area (% of land area) /Food and Agriculture Organization, electronic files and web site. License: CC BY-4.0 / Data / The World Bank / www.worldbank.org
[15] Hydro (PDF) / World Energy Council / https://www.worldenergy.org/
[16] 2016 Annual U.S. & Global Geothermal Power Production Report (PDF) / Geothermal Energy Association / http://geo-energy.org/
[17] Municipal waste statistics Updated / Statistics Explained / Eurostat / https://ec.europa.eu/eurostat/statistics-explained/index.php?title=Municipal_waste_statistics
[18] STUDY ON THE WIND POWER POTENTIAL IN BULGARIA, HUNGARY, AND ROMANIA. Countrz Report Bulfaria / 30 NOVEMBER 2023 / PDF / www.ait.ac.at/fileadmin/mc/energy/downloads/IES/Projekte/ECF_Study_on_the_Assessment_of_Wind_Potentials_-_Country_Report_Bulgaria__AIT__REKK__2023-11-30_.pdf
[19] Romania and Bulgaria agree to build two hydropower plants on Danube / January 23, 2023 / www.balkangreenenergynews.com/romania-and-bulgaria-agree-to-build-two-hydropower-plants-on-danube/
[20] BP Statistical Review of World Energy 2020-2022 (PDF) / BP / www.bp.com
[21] ESO.BG - Електроенергиен Системен Оператор / www.eso.bg
[22] Europe's coal exit / beyondfossilfuels.org/europes-coal-exit/
[23] Стратегическа визия за развитие на електроенергийния сектор на Република България / www.me.government.bg/uploads/manager/source/NRRP/%D0%B2%D0%B8%D0%B7%D0%B8%D1%8F_2023-2053_1.pdf
[24] Dalgo Pole, Bulgaria, 66 MWp / www.mounting-systems.com/en/solar-parks-large-scale-projects/referenzen-solarparks-grossprojekte/dalgo-pole-bulgaria-66-mwp/
Die Quellen der Diagramme und Kurven sind unter den Bildern angegeben.
Weitere Informationen zur Energiewirtschaft in Bulgarien finden Sie hier