
Contents
General State of the Economy
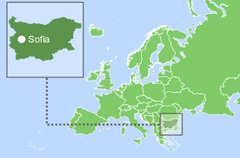
Bulgaria, officially the Republic of Bulgaria, is a country in Southeastern Europe occupying the eastern part of the Balkan Peninsula. The country borders Rumania to the north, Greece and Turkey – to the south – Turkey and Greece, and Serbia and North Macedonia – to the west. The total length of the country's coastline is 354 km [3].
According to 2023 statistics, Bulgaria is home to about 7 million people. In terms of population density the country is 158th in the world from 248 countries considered. The national capital and largest city is Sofia. The political form of government is a parliamentary republic and the administrative map of the country is divided into 28 provinces [1,2,3].
| Bulgaria / Republic of Bulgaria | ||
|---|---|---|
| Capital: Sofia | Density: 63/km2 | Currency: Lev (BGN) |
| Official languages: Bulgarian | Life expectancy at birth: 73.61 years | GDP (PPP): $216.499 billion (2023 est.) |
| National Day: 03 March | Area (land): 110,993.6 km2 | GDP - per capita (PPP): $33,780 (2023 est.) |
| Population: 6,827,736 (2023 est.) | Coastline: 354 km | Internet country code: .bg |
Source: [1,2,3,4,5]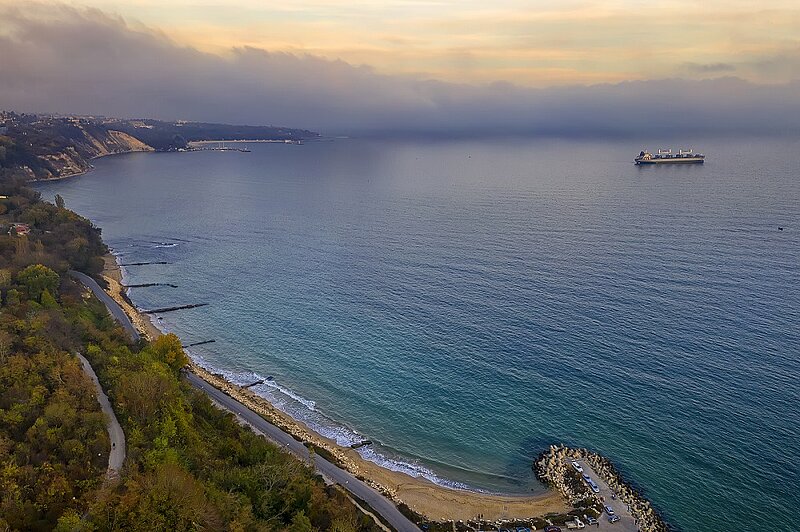
A beautiful aerial view from drone to the coastline, Black sea near Varna, Bulgaria. Envato. RZLB2QXP4M
The ranking positions of Bulgaria relative to other countries have been determined for an extensive list of economic, energy, innovative and educational indices, as well as for metrics reflecting the state of the environment. The economic indices include, for example, GDP per capita, annual average GDP growth, high-technology exports, and others. The list of energy indices includes proven reserves of oil, gas and coal, production-consumption ratio combined, and energy use, etc. Each of the indices has a ranked list of included member countries. Since the number of countries in each rating is different for each index, the positioning of the country of interest is displayed on a special chart, where the vertical axis is a uniform relative scale from 0 to 1, whereas the horizontal axis denominates the various indices and respective numbers relating to the descriptions given underneath.
Thus, in such a relative “0-1” diagram, the country’s position is marked with a dot in proportion to its location in the original rating list. If the country is among the leaders regarding the selected indicator, it will be marked close to 1 in the upper green zone on the relevant chart “0-1”, if the country is an outsider in the rating list, then it will be marked in the lower red zone of the chart “0-1”, etc. A single list of indices is used for all countries. If a country is not in the ranking list for any index, then the corresponding position on the charts is not displayed.
Ranking position of Bulgaria for list of economic indices:
| Sources: 1. GDP (purchasing power parity), 2020 est. / The World Factbook/Library/Central Intelligence Agency *228 2. GDP - per capita (PPP), 2020 / The World Factbook/Library/Central Intelligence Agency *229 3. Inflation rate (consumer prices), 2019 est. / The World Factbook/Library/Central Intelligence Agency *228 4. Charges for the use of intellectual property, receipts (BoP, current US$), 2020 / International Monetary Fund, Balance of Payments Statistics Yearbook, and data files. / License: CC BY-4.0 *88 5. The Global Competitiveness Index 2019 / Rankings / Reports / World Economic Forum *141 6. High-technology exports (current US$) 2019-2020 / United Nations, Comtrade database through the WITS platform / License: CCBY-4.0 / Data *134 7. 2021 Index of Economic Freedom / International Economies / The Heritage Foundation *178 8. Reserves of foreign exchange and gold, 2017 est. / The World Factbook / Library / Central Intelligence Agency *195 9. Annual average GDP growth in %, for the last 10 years (2011-2020) / World Bank national accounts data, and OECD National Accounts data files / License: CC BY-4.0 *206 10. Public debt (% of GDP), 2017 est. / The World Factbook / Library / Central Intelligence Agency (from smallest to largest) *210 * Total number of countries participating in ranking Figure 1. Economic Indices of Bulgaria |
For most of the economic indicators shown in the chart, Bulgaria is above the middle of the ranking lists. The weakest spots in Bulgarian economic indicators are Inflation rate (0.35) and Annual average GDP growth in % (0.42). Bulgaria has the best indices among those presented for Public debt as % of GDP (0.86), 2021 Index of Economic Freedom (0.80), and Reserves of foreign exchange and gold (0.74).
Energy Resources
Bulgaria does not have significant reserves of fossil fuels. In the north of the country in the area of Pleven and on the shelf of the Black Sea there are insignificant deposits of oil and natural gas, which makes 0.001% and 0.003% of the world’s total, respectively. In addition, Bulgaria has some coal reserves, which represent 0.23% of the world's total coal reserves.
In terms of tons of oil equivalent, according to 2024 data, conventional proved reserves were represented to 99.6% by coal, followed by natural gas – 0.3%, and crude oil – 0.1% (Fig.5).
Table 1. Fossil energy resources of Bulgaria
| Resource /Explanations | Crude oil* | Natural gas* | Coal* | Shale Gas** | Tight Oil** | Oil Shale | Coalmine methane |
|---|---|---|---|---|---|---|---|
| Value | 0.02 (0.001%) | 0.2 (0.003%) | 2608 (0.23%) | 16.6 | 0.2 | 0.125 | 2.57 - 9.15 |
| Unit | billion barrels | Tcf | million short tons | Tcf | billion barrels | billion barrels | bcm |
| Year | 2021 | 2020 | 2021 | 2015 | 2015 | 2008 | 2020 |
| Source | [6] | [6] | [6] | [7] | [7] | [8] | [9] |
*share of the country’s reserves in world total is provided in brackets
**unproved technically recoverable
Bulgaria has an estimated 500 billion cubic meters of shale gas, but current legislation does not allow its extraction. Following protests by local communities and environmental activists, in 2012 Bulgaria imposed a ban on shale gas exploration and production using hydraulic fracturing technology. In view of recent developments, in order to reduce Bulgaria's heavy dependence on Russian energy resources, some experts call for lifting the ban on shale gas extraction [10].
Table 2. Renewable energy resources of Bulgaria
| Resource/ explanations | Solar Potential (GHI)* | Wind Potential (50 м)* | Bio Potential (agricultural area) | Bio Potential (forest area) | Hydro energy Potential** | Geothermal Potenial | Municipal Solid Waste |
|---|---|---|---|---|---|---|---|
| Value | 3.8-4.1 | 5.0-6.0 | 46.5 | 35.9 | 26 540 | 164 | 408 |
| Unit | kWh/m2/day | m/s | % of land area | % of land area | GWh/year | MWe | kg per capita |
| Year | 2020 | 2020 | 2020 | 2020 | 2013 | 2016 | 2021 |
| Source | [11] | [12] | [13] | [14] | [15] | [16] | [17] |
*for most of the territory of the country
**gross theoretical capability
Bulgaria has a rather high potential for the development of various types of renewable energy. This primarily concerns onshore and offshore wind energy, having wind speeds of up to 6.5 m/s at a height of 50 m in the eastern part of the country, along the Black Sea coastline. There are even more significant offshore resources in the Black Sea region.
MOURGASH. BULGARIA
Latitüde: 42.83, Longitude: 23.67
Average speed: 8.74 m/s Operational share: 85%
Average daily wind speed for 10 years of observations, m/s, 10 m above the ground
Source: based on NOAA U.S. Department of Commerce
Detailed information: Interactive map of wind resources
MOURGASH. BULGARIA
Latitüde: 42.83, Longitude: 23.67
Average daily sky coverage over 10 years of observations, %
CLR - clear, SCT - scattered from 1/8 TO 4/8, BKN - broken from 5/8 TO 7/8, OVC - overcast, OBS - obscured, POB - partial obscuration
Source: based on NOAA U.S. Department of Commerce
Detailed information: Interactive map of solar resources
According to a recent study commissioned by the European Climate Foundation, Bulgaria can technically produce more electricity from wind than the current level of total electricity consumption in the country. The total technical potential for wind power in the five leading regions - Dobrich, Varna, Shumen, Razgrad and Silistra - is very high totaling 14.7 GW. This is almost as much as the electricity consumed by the whole of Bulgaria at present. However, the main obstacle to the expansion of wind power is the existing grid infrastructure, which is far from being ready to receive such huge amounts of electricity [18].
Bulgaria has a high solar radiation potential, especially in the southern part of the country. The highest solar radiation intensity GHI is 4.1-4.4 kWh/m2 per day, distributed in the southwestern part of the country, in the Blagoevgrad region. Today, solar energy is not fully utilized, but it is being developed at a high rate both at the level of households and institutions and on a large scale.
Hydropower plays an important role in Bulgaria's energy balance and has a high potential for further development, such as on the Danube, where Romania and Bulgaria have agreed on the construction and future joint operation of two hydropower projects. The first power plant with a capacity of 840 MW will be located between Turnu Măgurele in Romania and Nikopol in Bulgaria [19].
Energy Balance
According to [6], in 2022 in Bulgaria, the total production of primary energy was 0.473 quadrillion Btu, while consumption was at the level of 0.737 quadrillion Btu. Thus, the share of domestic production in primary energy consumption was about 58.4%. This makes Bulgaria a country dependent on energy imports.
According to the BP Statistical Review of World Energy 2022, total primary energy consumption in Bulgaria in 2021 was 0.78 exajoules [20].
Source: U.S. Energy Information Administration (Mar 2024) / www.eia.gov
Figure 2. The Production and consumption of fossil fuels in Bulgaria (coal – left, gas – in the center, oil – right)
As can be seen from the graph above, Bulgaria's consumption of natural gas and crude oil far exceeds its low production. Thus, in 2022, oil consumption is 15 times higher than domestic production, and the demand for natural gas is 100 times higher than the country's internal capacity. If we look at coal data, coal production is slightly higher than consumption.
Source: U.S. Energy Information Administration (Mar 2024) / www.eia.gov
Figure 3. Electricity production in Bulgaria
Bulgaria is fully self-sufficient in electricity and exports some of the domestically produced electricity. Over the 10 years presented in the chart above, the amount of electricity produced and consumed in the country has remained approximately at the same level. With regard to the distribution of electricity generation sources, there is a slight increase in the share of renewable energy sources and a decrease in the share of fossil fuels.
According to statistics provided by the Transmission System Operator of the Republic of Bulgaria [21], about 41% of electricity was generated by nuclear power plants, followed by thermal power plants – 30.31%, hydroelectric generation – 16%, solar power – 11%, thermal power plants – 10%, wind – 5%, and bioenergy – 0.46%. These data indicate that the share of renewable energy sources in the country's electricity production is growing rapidly.
| Sources: 1. Crude oil proved reserves, 2021 / International Energy Statistic/Geography / U.S. Energy Information Administration (Nov 2021)*98 2. Natural gas proved reserves 2021 / International Energy Statistic / Geography / U.S. Energy Information Administration (Nov 2021) *99 3. Total recoverable coal reserves 2019 / International Energy Statistic / Geography / U.S. Energy Information Administration (Nov 2021) *81 4. Combination production-consumption for Crude oil 2018 / International Energy Statistic / Geography / U.S. Energy Information Administration (Nov 2021) *219 5. Combination production-consumption for Natural gas 2019 / International Energy Statistic / Geography / U.S. Energy Information Administration (Nov 2021) *123 6. Combination production-consumption for Coal 2019 / International Energy Statistic / Geography / U.S. Energy Information Administration (Nov 2021) *128 7. Electricity – from other renewable sources (% of total installed capacity), 2017 est. / The World Factbook / Library / Central Intelligence Agency *170 8. GDP per unit of energy use (PPP per unit of oil equivalent), 2020 *66 Primary energy consumption - BP Statistical Review of World Energy 2021/BP;GDP (purchasing power parity) - The World Factbook/Library/Central Intelligence Agency 9. Energy use (primary energy use of oil equivalent per capita) 2020 *127 Primary energy consumption – BP Statistical Review of World Energy 2021; Population - United Nations, Department of Economic and Social Affairs, Population Division (2019). World Population Prospects 2019, custom data acquired via website. Retrieved 15 November 2021*66 10. The Global Energy Architecture Performance Index Report (EAPI) 2017 / Rankings / Reports / World Economic Forum 11. Electric power consumption (kWh per capita), 2016 *217 Electricity Consumption - The World Factbook / Library / Central Intelligence Agency; Population - United Nations, Department of Economic and Social Affairs, Population Division (2019). World Population Prospects 2019, custom data acquired via website. Retrieved 15 November 2021 12. Combination of electricity production-consumption (kWh)/The World Factbook/Library/Central Intelligence Agency *216 * Total number of countries participating in ranking Figure 4. Energy indices of Bulgaria |
Since Bulgaria has no significant fossil fuel reserves, the country's positions in crude oil (0.15) and natural gas (0.14) are the lowest of those in the chart above. Consequently, Bulgaria has a relatively low ratio of the Combined production-consumption for oil (0.25) and natural gas (0.30). The strongest indicators reflected on the graph are Combination of electricity production-consumption (0.84) and Electricity – from other renewable sources as % of total installed capacity (0.76). Apart from that, the country is well-positioned in Electric power consumption per capita (0.71).
Energy Infrastructure
There are two fossil fuel production regions in Bulgaria. The first is based in the east of the country on the continental shelf of the Black Sea, with the main field being the Galata natural gas field, located offshore about 25 km southeast of Varna. To the north of it is Bulgaria's first discovered oil field, Tulenovo, located also offshore. Other infrastructural facilities such as gas and oil refineries, as well as storage and terminals, are also situated in the east of the country to handle oil and gas produced in the region as well as imported products. In addition, there is an onshore region in the northwestern part of Bulgaria, in the Pleven region, where natural gas and oil are being extracted.
Figure 5. Basic infrastructural facilities of the fossil fuel sector in Bulgaria
Although Bulgaria's domestic natural gas market is small, the country has an extensive network of gas pipelines that serve both Bulgaria's needs and those of neighboring Turkey, Greece and Macedonia by supplying imported gas there.
Bulgaria’s coal deposits are mostly located in the western part of the country and near the Black Sea. As part of its climate change commitments, Bulgaria has announced a phase-out of coal by 2040, which, given the poor state of Bulgaria's coal industry, would be a more sensible solution than bringing it into compliance with emission standards, which would require huge investments [22]. 
Figure 6. Electricity production in Bulgaria
As already mentioned, a significant part (about 33%) of Bulgaria's electricity is nuclear. The country currently operates two nuclear power units in Kozloduy, 200 km north of Sofia. At the beginning of 2023 Bulgarian government announced countries’ energy strategy until 2053. Among the strategic objectives for the development of the energy sector are the construction of two new reactors at Kozloduy and two at Belene, providing 4,000 MW of new nuclear capacity [23].
According to the Energy Information Administration Data, in 2022, about 7.4% of Bulgaria’s electricity was generated by hydropower plants. Located on Kriva river in the eastern Rila mountains Sestrimo is the country's most significant hydropower project with a capacity of 240 MW.
Figure 7. Renewable energy in Bulgaria
The majority of the Bulgarian wind parks are located in the north-eastern part of the country with the 156 MW Saint Nikola onshore plant located in Dobrich as the largest wind power project in Bulgaria.
One of the largest solar parks in Bulgaria connected to the national grid is the 66-megawatt Dalgo Pole, located about 120 kilometers southeast of the capital Sofia and near the city of Plovdiv [24].
According to the Bulgarian energy strategy [23], the country is targeting a 7 GW of solar and 2 GW of wind plants by 2030 and 12 GW of solar and 4 GW of wind plants by 2050. In addition, a total of 870 MW of new hydropower projects are planned by 2030 and 1,270 MW by 2050. Moreover, an important factor in the future development of the sector will be hydrogen production, which is expected to reduce and replace Bulgaria's dependence on natural gas imports.
Education and Innovation
The following chart shows Bulgaria's positions in terms of education and innovation:
| Sources: 1. The Global Innovation Index 2021, Rankings / Knowledge / World Intellectual Property Organization / Cornell University, INSEAD, and WIPO (2021): Energizing the World with Innovation. Ithaca, Fontainebleau, and Geneva *132 2. Patent Grants 2011-2020, resident & abroad / Statistical country profiles / World Intellectual Property Organization *185 3.Patents in Force 2020 / Statistical country profiles / World Intellectual Property Organization *109 4. QS World University Rankings 2022 *97 5. SCImago Country Rankings (1996-2020) / Country rankings / SCImago, (n.d.). SIR-SCImago Journal & Country Rank [Portal]. Retrieved 17 Nov 2021 *240 6. Internet users in 2018 / The World Factbook / Central Intelligence Agency *229 7. Internet users in 2018 (% Population) / The World Factbook / Central Intelligence Agency *229 8. Government expenditure on education, total (% of GDP), 2019 / United Nations Educational, Scientific, and Cultural Organization (UNESCO) Institute for Statistics. License: CCBY-4.0 / Data as of September 2021*177 9. Research and development expenditure (% of GDP), 2018 / UNESCO Institute for Statistics. License: CCBY-4.0 / Data *119 10. Scientific and technical journal articles, 2018 / National Science Foundation, Science and Engineering Indicators. License: CCBY-4.0 / Data *197 * Total number of countries participating in ranking Figure 8. The indices of education and innovation in Bulgaria |
The majority indices describing the country‘s positioning in the various international rankings related to education and innovation are above average. The lowest spot in the country is the QS World University Rankings 2022 (0.13), which can be partly explained by relatively low government expenditure on education (0.41). Bulgaria has the highest position of those presented for SCImago Country Rankings (0.77) and The Global Innovation Index 2021 (0.73).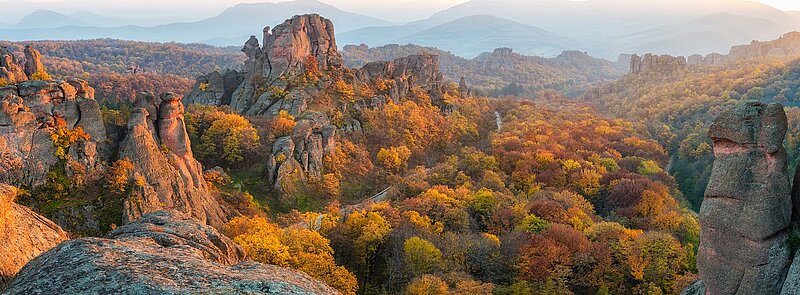
The Belogradchik rocks in Bulgaria. Envato. M976YKQ8C4
Ecology and Environment Protection
Indicators related to environmental issues are presented in the following diagram:
| Sources: 1. CO2 total emission by countries 2020 / European Commission / Joint Research Centre (JRC) / Emission Database for Global Atmospheric Research (EDGAR)*208 2. CO2 per capita emission 2020/European Commission/Joint Research Centre (JRC) / Emission Database for Global Atmospheric Research (EDGAR) *208 3. Forest area 2020 (% of land area) / The Global Forest Resources Assessment 2020 / Food and Agriculture Organization of the United Nations *234 4. Forest area change 2010-2020 (1000 ha/year) / The Global Forest Resources Assessment 2020 / Food and Agriculture Organization of the United Nations *234 5. The Environmental Performance Index (EPI) 2020 / Rankings / Yale Center for Environmental Law & Policy / Yale University *180 6. Annual freshwater withdrawals (m3 per capita), 2017 *179 Annual freshwater withdrawals, total (billion m3), 2017 – Food and Agriculture Organization, AQUASTAT data. /License: CC BY-4.0; Population – United Nations, Department of Economic and Social Affairs, Population Division (2019). World Population Prospects 2019, custom data acquired via website. Retrieved 15 November 2021 7. The National Footprint Accounts 2017 (Biocapacity Credit / Deficit) / Global Footprint Network *188 8. Methane emissions (kt of CO2 equivalent), 2018 / Data for up to 1990 are sourced from Carbon Dioxide Information Analysis Center, Environmental Sciences Division, Oak Ridge National Laboratory, Tennessee, United States. Data from 1990 are CAIT data: Climate Watch. 2020. GHG Emissions. Washington, DC: World Resources Institute. Available at: License : Attribution-NonCommercial 4.0 International (CC BY-NC 4.0) *191 9. The Climate Change Performance Index (CCPI) 2022 / Overall Results / Jan Burck, Thea Uhlich, Christoph Bals, Niklas Höhne, Leonardo Nascimento / Germanwatch, NewClimate Institute & Climate Action Network *60 * Total number of countries participating in ranking Figure 9. Environmental Indices of Bulgaria |
Bulgaria belongs to the group of countries with high carbon dioxide emissions – in total (0.31) and per capita (0.26). This fact is partly responsible for its low ranking in the Climate Change Performance Index 2022 (0.31). On the other hand, among positive indicators, there is a clear upward trend in the area of forests (0.91) and relatively high Annual freshwater withdrawals (0.81).
References
[1] List of sovereign states and dependencies by area / Wikipedia / en.wikipedia.org/wiki/List_of_sovereign_states_and_dependencies_by_area
[2] List of countries and dependencies by population density / Wikipedia / en.wikipedia.org/wiki/List_of_countries_and_dependencies_by_population_density
[3] Bulgaria / The world factbook / Library / Central Intelligence Agency / www.cia.gov
[4] GDP, PPP (constant 2011 international $) / World Bank, International Comparison Program database. License: CC BY-4.0 / Data / The World Bank / www.worldbank.org
[5] GDP per capita, PPP (current international $) / World Bank, International Comparison Program database. License: CC BY-4.0 / Data / The World Bank / www.worldbank.org
[6] International Energy Statistic / Geography / Bulgaria / U.S. Energy Information Administration / www.eia.gov/beta/international/
[7] World Shale Resource Assessments / U.S. Energy Information Administration (September 24, 2015) / https://www.eia.gov/
[8] 2010 Survey of Energy Resources (PDF) / 2010 / Uploads / World Energy Council / https://www.worldenergy.org/
[9] Potential for the utilization of coal methane/ aenert.com/technologies/fossil-fuel/unconventional-gas/coal-seam-methane/
[10] Bulgaria is rich with shale gas, but lacks political will to exploit it / 10. Juni 2022 / EURAKTIV / www.euractiv.com/section/energy/news/bulgaria-is-rich-with-shale-gas-but-has-no-political-will-to-exploit-it/
[11] Solar resource data obtained from the Global Solar Atlas, owned by the World Bank Group and provided by Solargis / Global Solar Atlas / globalsolaratlas.info
[12] Bulgaria Wind Map / Global Wind Atlas 2.0, a free, web-based application developed, owned and operated by the Technical University of Denmark (DTU) in partnership with the World Bank Group, utilizing data provided by Vortex, with funding provided by the Energy Sector Management Assistance Program (ESMAP). For additional information: globalwindatlas.info
[13] Agricultural land (% of land area) /Food and Agriculture Organization, electronic files and web site. License: CC BY-4.0 / Data / The World Bank / www.worldbank.org
[14] Forest area (% of land area) /Food and Agriculture Organization, electronic files and web site. License: CC BY-4.0 / Data / The World Bank / www.worldbank.org
[15] Hydro (PDF) / World Energy Council / https://www.worldenergy.org/
[16] 2016 Annual U.S. & Global Geothermal Power Production Report (PDF) / Geothermal Energy Association / http://geo-energy.org/
[17] Municipal waste statistics Updated / Statistics Explained / Eurostat / https://ec.europa.eu/eurostat/statistics-explained/index.php?title=Municipal_waste_statistics
[18] STUDY ON THE WIND POWER POTENTIAL IN BULGARIA, HUNGARY, AND ROMANIA. Countrz Report Bulfaria / 30 NOVEMBER 2023 / PDF / www.ait.ac.at/fileadmin/mc/energy/downloads/IES/Projekte/ECF_Study_on_the_Assessment_of_Wind_Potentials_-_Country_Report_Bulgaria__AIT__REKK__2023-11-30_.pdf
[19] Romania and Bulgaria agree to build two hydropower plants on Danube / January 23, 2023 / www.balkangreenenergynews.com/romania-and-bulgaria-agree-to-build-two-hydropower-plants-on-danube/
[20] BP Statistical Review of World Energy 2020-2022 (PDF) / BP / www.bp.com
[21] ESO.BG - Електроенергиен Системен Оператор / www.eso.bg
[22] Europe's coal exit / beyondfossilfuels.org/europes-coal-exit/
[23] Стратегическа визия за развитие на електроенергийния сектор на Република България / www.me.government.bg/uploads/manager/source/NRRP/%D0%B2%D0%B8%D0%B7%D0%B8%D1%8F_2023-2053_1.pdf
[24] Dalgo Pole, Bulgaria, 66 MWp / www.mounting-systems.com/en/solar-parks-large-scale-projects/referenzen-solarparks-grossprojekte/dalgo-pole-bulgaria-66-mwp/
The sources of charts and curves are specified under the images.
For more information about the energy industry in Bulgaria see here