
Contents
General State of the Economy
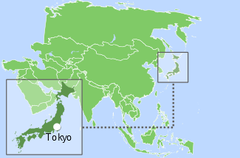
Japan is a sovereign island nation in East Asia. Japan has maritime borders with Russia to the north, China to the north-west, with North and South Korea to the west, and with Taiwan in the southwest. Japan is the 68th largest country the world, is home to around 125 million people, as of 2023. In terms of population density, the country is 41st in the world [1,2,3].
| Japan | ||
|---|---|---|
| Capital: Tokyo | Density: 330/km2 | Currency: Japanese yen (¥) |
| Official languages: Japanese (de facto) | Life expectancy at birth: 84.62 years | GDP (PPP): $6.495 trillion (2023 est.) |
| National Day: 11 February | Area (land): 377,975 km2 | GDP - per capita (PPP): $52,120 (2023 est.) |
| Population: 125,416,877 (2023 est.) | Coastline: 29,751 km | Internet country code: .jp |
Source: [1,2,3,4,5]
The country stretches from the Sea of Okhotsk in the north to the East China Sea and Taiwan in the south; the total length of the country's coastline is 29 751 km [3]. Japan is a unitary parliamentary constitutional monarchy and its official language is Japanese. The administrative map of the country is divided into 47 prefectures [3].
| Sources: 1. GDP (purchasing power parity), 2020 est. / The World Factbook/Library/Central Intelligence Agency *228 2. GDP - per capita (PPP), 2020 / The World Factbook/Library/Central Intelligence Agency *229 3. Inflation rate (consumer prices), 2019 est. / The World Factbook/Library/Central Intelligence Agency *228 4. Charges for the use of intellectual property, receipts (BoP, current US$), 2020 / International Monetary Fund, Balance of Payments Statistics Yearbook, and data files. / License: CC BY-4.0 *88 5. The Global Competitiveness Index 2019 / Rankings / Reports / World Economic Forum *141 6. High-technology exports (current US$) 2019-2020 / United Nations, Comtrade database through the WITS platform / License: CCBY-4.0 / Data *134 7. 2021 Index of Economic Freedom / International Economies / The Heritage Foundation *178 8. Reserves of foreign exchange and gold, 2017 est. / The World Factbook / Library / Central Intelligence Agency *195 9. Annual average GDP growth in %, for the last 10 years (2011-2020) / World Bank national accounts data, and OECD National Accounts data files / License: CC BY-4.0 *206 10. Public debt (% of GDP), 2017 est. / The World Factbook / Library / Central Intelligence Agency(from smallest to largest) *210 * Total number of countries participating in ranking Figure 1. Economic Indices of Japan |
The base of the country's economy is the service sector, accounting for three quarters of GDP; as well as the automotive sector, electronics, ships and steel. Japan is one of the ten strongest economies in the world, which is reflected in the presented diagram – Figure 1. By almost every indicator in the presented diagram, Japan places in the top 25% of the leading countries in the world included in the rating.
Since the early 1990s, the country has experienced a steady growth in GDP at purchasing power parity, both in general and per capita [4,5]. GDP at purchasing power parity increased from $5.180 trillion in 2017 to $5.224 trillion (4th place in the world) in 2019 [3]. The country’s GDP at purchasing power parity per capita is significantly lower (41st place in the world in 2019), but has also been demonstrating positive dynamics: from $40 859 in 2017 to 41 400 in 2019 [3]. The inflation rate rose from -0.1% in 2016 to 0.4% in 2019; according to this indicator, the country is 39th in the world [3].
By the market value of publicly traded shares, the country was 4th in 2015, behind, for example, the USA, China and the EU [3]. According to the Global Competitiveness Report, presented by the World Economic Forum in 2019, Japan placed 6th out of a total of 141 countries, behind Singapore, USA, Hong Kong SAR, Netherland and Switzerland; notably, the country lost one position compared to the previous year’s rating. This rating measures the effectiveness of the use of the country’s own resources for sustainable development. In addition to a number of economic indicators this index also takes into account such variables as education, health, level of innovation, etc. In the list of countries that exported high-tech products in 2019-2020, the country was 7th out of 134 countries, behind China, USA and South Korea. According to the Index of Economic Freedom, which is based on freedom of business, freedom from government intervention, property protection, and freedom from corruption, Japan was 23rd in 2021 out of the 178 countries considered. In terms of gold reserves and foreign exchange reserves in 2017 Japan was 2nd in the world, behind China. According to the indicator for the average GDP growth in percentage over a 10 year period (2011-2020), the country was 178th out of 206 countries in 2017. In terms of public debt, calculated as a percentage of the country's GDP, Japan was at the very top of the ranking out of 210 countries considered in 2017.
Energy Resources
In Japan, there are practically no significant fossil resources, particularly when compared with those in the largest producer countries (Table 1). According to proven reserves of oil and natural gas, the country is 77th and 74th in the world, respectively [3]. In terms of tons of oil equivalent, according to 2021 data, proved coal reserves were 90.8%, natural gas – 7%, oil – 2.2%, in oil equivalent of the total energy potential of the country's mineral resources (Fig. 5).
Table 1. Fossil energy resources of Japan
| Resource /Explanations | Crude oil | Natural gas | Coal | Coal mine methane | Shale Gas | Tight Oil |
|---|---|---|---|---|---|---|
| Value | 0.044 (0.003%) | 0.738 (0.01%) | 385 (0.035%) | 3.4-5.8 | no data | no data |
| Unit | billion barrels | Tcf | million short tons | Bcm | - | - |
| Year | 2021 | 2020 | 2021 | 2018 | - | - |
| Source | [6] | [6] | [6] | [8,9] | - | - |
According to the Energy Information Administration [6] survey, as of early 2016 proven oil reserves totalled 44 million barrels, and according to [3] consisted of 44.12 million bbl at the beginning of 2018 (Table 1). In the Agency for Natural Resources and Energy’s monthly report, as of July 2017, oil reserves are divided into three categories: national reserves, private reserves and joint petroleum products. The national reserves of the country, as noted in the report, are 48.1 million kiloliters,; private reserves - 16.5 million kiloliters; and joint reserves of petroleum products – 1.67 million kiloliters [7]. According to [6], the Oil and Gas Journal estimates the natural gas reserves in the country at the beginning of 2017 to be at 738 Bcf. Proved natural gas reserves in Japan at the beginning of 2018 were estimated at 20.9 Bcm [3]. According to the BP Statistical Review of World Energy data, coal resources were estimated at 350 million tons in 2020 [8], for comparison, coal resources in neighbouring China are estimated at 143 197 million tons [8]. According to calculations, made by Advanced Energy Technologies, the methane utilization potential (using a the methodology based on methane emissions from [9] and coal reserves from [8]) amounted to around 3.4-8.5 Bcm.
Japan has a variety of renewable resources for energy production. A selection of basic indicators of this type of resource is presented in Table 2.
Table 2. Renewable energy resources of Japan
| Resource/ Explanations | Solar Potential (GHI)* | Wind Potential (50 м)* | Hydro energy Potential** | Bio Potential (agricultural area) | Bio Potential (forest area) | Geothermal Potential | Municipal Solid Waste |
|---|---|---|---|---|---|---|---|
| Value | 3.8-4.1 | 6.0-7.5 | 136 520 | 12.5 | 68.5 | 23 | 1.71 |
| Unit | kWh/m2/day | m/s | GWh/year | % of land area | % of land area | GWe | kg//per capitaday |
| Year | 2018 | 2017 | 2013 | 2018 | 2018 | 2013 | 2012 |
| Source | [10] | [11] | [12] | [13] | [14] | [15] | [16] |
*for most of the territory of the country
**technically exploitable capability
The level of horizontal solar radiation in most of the country is between 3.8-4.1 kWh/m2/day [10].The distribution of wind resources is as follows: in the majority of the country the wind speed does not exceed 6.0-7.5 m/s; along the coastline of the island of Hokkaido, and in the north and south of Honshu, the wind speed can exceed 7.5 m/s at a height of 90 m [11]. These are positive indicators for the development of wind power, but both the high regularity of extreme wind gusts and the presence of frequent and destructive hurricanes in this region complicate its implementation.
According to 2013 data, the technically exploitable capability of hydro power in Japan, is 136 520 GWh/year [12], which is almost twice as high as, for example, Austria, which has a high level of development of hydro resources. This allows for Japan to intensively exploit hydro resources for electricity generation. More than 12.5% of Japan is covered by agricultural land and around 68.5% is forested [13,14].
Japan is one of the most tectonically active countries in the world, with almost 200 volcanoes;, as a result, the country possesses significant geothermal energy resources, estimated at 20 GWe [14]. According to [15], the potential of geothermal resources in Japan is 23 GWe – one of the highest in the world and higher than that of traditional leaders in geothermal energy such as Iceland, USA, Mexico, Philippines. The level of municipal waste generation in Japan in 2012 was 1.71 kg per capita per day, which exceeds the performance of other countries in the region, for example, China – (1.02 kg per person per day) and South Korea – (1.24 kg per person per day). By 2025, this indicator is predicted to decline slightly to 1.7 kg per person per day. This resource is a valuable raw material for recycling or producing energy, the technologies of which have reached a very high level of development in Japan [16].
Energy Balance
According to the BP Statistical Review of World Energy 2021, total primary energy consumption in Japan in 2020 was 17.03 Exajoules, about 38.1% of which was from oil, 26.8% from coal, 22.1% form natural gas, 2.2% from nuclear energy, 6.6% from renewable energy, and 4% from hydropower [8]. Japan is the fifth largest oil consumer in the world and the fourth largest oil importer, as of 2019 [6]. Oil production between 2003-2021 remained practically unchanged, and lower than consumption levels, at between 120-130 thousand barrels/day [17]. The volume of oil consumption in the country since 2003 has shown a decline (Fig.2) and in 2021 totalled 3411 thousand barrels/day [17]. A report by BP showed similar figures — 3 854 thousand barrels/day in 2018 [8]. Oil in Japan in 2017 amounted to 3.208 million barrels/day [3]. The main oil exporters to Japan are the countries of the Middle East (Saudi Arabia — 34%, UAE — 25%), but Japanese authorities are trying to diversify imports and increase the share of imports from South-East Asia, East Africa and Russia [6].
Source: U.S. Energy Information Administration (Dec 2021) / www.eia.gov
Figure 2. The Production and Consumption of fossil fuels in Japan (left — coal, in the center — gas, right — oil)
Japan is the largest LNG importer in the world, accounting for 22% of total global imports in 2019. The consumption of natural gas in the country grew rapidly between 2001-2014, reaching 4.4 trillion cubic feet per year (Tcf/y) in 2014. According to [3], gas consumption in the country in 2017 was 127.2 Bcm, and the BP Statistical Review of World Energy 2021 [8] estimated gas consumption at 104.4 Bcm in 2020. The production of natural gas has been stable since 2000, not exceeding 139 Bcf and accounting for only 2% of Japan’s natural gas consumption [17]. Japan imported 116.6 billion cubic meters of natural gas in 2017 [3]. In 2020, imports of liquefied natural gas from Australia, Malaysia, Qatar, Russia, Indonesia and a number of other countries totalled over 74 million tons or 3,717 bcf [6,18], which is significantly lower compared to the previous year (72 million tons) [18].
Coal consumption in the country between 2021 remained practically unchanged, with small fluctuations, not exceeding 220 million short tons [17]; in 2020 according to BP's report it amounted to 4.57 Exajoules [11].
At present, electricity production in Japan is mainly driven by fossil fuels (Fig.3).
Sources: U.S. Energy Information Administration (Dec 2021) / www.eia.gov | ||
| Figure 3. Electricity Generation in Japan |
It is also worth noting that after the events of 2011 at Fukushima, when the 15-metre tsunami hit a nuclear power plant, causing tremendous destruction, the share of nuclear power in the production of electricity fell to almost zero (Figure 3); before that event its share was significant.
| Sources: 1. Crude oil proved reserves, 2021 / International Energy Statistic/Geography / U.S. Energy Information Administration (Nov 2021)*98 2. Natural gas proved reserves 2021 / International Energy Statistic / Geography / U.S. Energy Information Administration (Nov 2021) *99 3. Total recoverable coal reserves 2019 / International Energy Statistic / Geography / U.S. Energy Information Administration (Nov 2021) *81 4. Combination production-consumption for Crude oil 2018 / International Energy Statistic / Geography / U.S. Energy Information Administration (Nov 2021) *219 5. Combination production-consumption for Natural gas 2019 / International Energy Statistic / Geography / U.S. Energy Information Administration (Nov 2021) *123 6. Combination production-consumption for Coal 2019 / International Energy Statistic / Geography / U.S. Energy Information Administration (Nov 2021) *128 7. Electricity – from other renewable sources (% of total installed capacity), 2017 est. / The World Factbook / Library / Central Intelligence Agency *170 8. GDP per unit of energy use (PPP per unit of oil equivalent), 2020 *66 Primary energy consumption - BP Statistical Review of World Energy 2021/BP;GDP (purchasing power parity) - The World Factbook/Library/Central Intelligence Agency 9. Energy use (primary energy use of oil equivalent per capita) 2020 *127 Primary energy consumption – BP Statistical Review of World Energy 2021; Population - United Nations, Department of Economic and Social Affairs, Population Division (2019). World Population Prospects 2019, custom data acquired via website. Retrieved 15 November 2021*66 10. The Global Energy Architecture Performance Index Report (EAPI) 2017 / Rankings / Reports / World Economic Forum 11. Electric power consumption (kWh per capita), 2016 *217 Electricity Consumption - The World Factbook / Library / Central Intelligence Agency; Population - United Nations, Department of Economic and Social Affairs, Population Division (2019). World Population Prospects 2019, custom data acquired via website. Retrieved 15 November 2021 12. Combination of electricity production-consumption (kWh)/The World Factbook/Library/Central Intelligence Agency *216 * Total number of countries participating in ranking Figure 4. Energy indices of Japan |
The level of electricity production in the country in 2021 was 955 TWh. Of this total, the share of fossil fuels was 72.3%, nuclear power — 6.4%, hydropower — 7.9%, and other renewable resources — 13.4% (Fig.6).
Japan’s position in the comparative diagram of energy index is shown in Figure 4. As already mentioned, Japan does not have significant reserves of fossil resources so the first six indices are extremely low, especially in terms of the production/consumption ratio: Japan is among the world leaders in the import of oil and gas, but its own production are volumes are significantly lower. Other energy indices for Japan look more convincing.
In the EAPI (Energy Architecture Performance Index) 2017, which is based principally on the level of economic growth, environmental safety, and energy independence of the country, including access to energy, Japan placed 45th out of 127 countries considered, behind Canada, South Korea, but ahead of Russia, USA and China. However, it should be noted that during the last 8 years the country has lost 24 ranking positions.
In terms of the share of electricity production from renewable energy sources (excluding hydropower), Japan was 37th out of 170 countries selected for consideration in 2017.
In terms of GDP per unit of energy use in 2020, Japan was 22nd out of 66 countries selected for consideration; the energy consumption per capita is lower — 26th out of 66 countries.
In terms of electricity consumption per capita, the country is 28th in the world, however, for combined electricity production-consumption, Japan is 10th in the ranked list of 216 countries, ahead of a number of Asian countries.
Energy Infrastructure
A territorial map showing the distribution of the largest infrastructure projects of the fossil fuel sector in Japan is shown in Figure 5.
As previously mentioned, coal reserves account for 90.8%, the share of natural gas for 7%, and oil for 2.2% (Fig.5). The main oil and gas fields are concentrated in the country’s central regions o and in the northern Sapporo region.
Figure 5. Basic infrastructure facilities of the fossil fuel sector in Japan
Twenty refineries have a total installed capacity of 3.5 million barrels/day (Fig.5) [20]. The country's largest refinery is Mizushima, owned by JX Nippon Oil & Energy, with an installed capacity of 380 200 barrels/day [21].
One of Japan's leading oil terminals is Chiba, and the largest oil storage facilities are Shirashima (35.2 million barrels) and Tomakomai-Tobu (34.0 million barrels) [22]. Crude oil is transported via oil pipelines with a total length of 174 km (Fig.5).
In the centre of Japan there are several large natural gas storage facilities, the largest of which is Katakai with a volume of 1.01 Bcm [23]. Gas is imported via more than 30 LNG regasification terminals, including 12 terminals with a capacity of more than 500 000 kL each, the largest of which is Sodeguara terminal with a total volume of 2 660 000 kL [24]
Gas is transported within the country via a network of pipelines with a total length of 4 456 km (Fig.5).
Japan is one of the world leaders in the development and commercialization of technologies for the production of synthetic fuels and extraction of unconventional fossil resources.
In 2009, in Japan, the INPEX Corporation, Nippon Oil Corporation, Japan Petroleum Exploration Co., Ltd., Cosmo Oil Co., Ltd., Nippon Steel Engineering Co., Ltd., and the Chiyoda Corporation completed the construction of the JAPAN-GTL demonstration plant with an installed capacity of 500 barrels/day in Niigata City; the purpose of the plant in to carry out research into the commercialization and improvement of GTL technology, which allows the use of carbon dioxide as a raw material [25].
Nine Japanese companies: Mitsubishi Gas Chemical, ITO-CHU, Jepex, Taiyo Oil, Total Di-Methyl Japan, Toyota Tsusho, JGC, Mitsubishi Heavy Industries and Mitsubishi Chemical have set up a joint venture to produce dimethylether in Niigata, with an installed capacity of 80 000 tons/year (with the possibility of increasing the capacity to 100 000 tons/year); the facility began producing fuel in 2008 [26].
Toyo Engineering Corporation is one of the world's licensors of methanol synthesis technologies and DME production, creating Micro-GTL technologies for FPSO, which allow for the utilization of associated petroleum gas in offshore fields [27].
Following years of research, a successful test production of 120 000 m3 of gas hydrates was carried out in 2013 off the shores of Atsumi and the Shumi Peninsula in the southeast of Japan [28], and in 2017 the country reported successful extraction of gas from the Nankai Trough field, whose potential is estimated by Japanese experts at 40 Tcf; approximately equal to 11 years of gas consumption in the country [29]. Japan dedicates considerable resources to researching the exploration and production of gas hydrates; if successful, the country would be fully provided with methane for many years. Japan Oil, Gas and Metals National Corporation (JOGMEC) is the absolute leader in this field in Japan.
The map of the territorial distribution of the largest infrastructure objects of electricity generation in Japan is shown in Figure 6.
The share of fossil fuels in electricity generation in Japan in 2020 was about 70% (Fig. 6).
Figure 6. Electricity production in Japan
The country has a significant number of stations for the production of electricity from hydrocarbons, including ten oil stations with a capacity of more than 1 200 MW, nine gas-fired power plants producing more than 2 200 MW, seven combined-type power plants with a capacity of more than 1 500 MW, and nine nuclear power plants with a capacity of more than 2 000 MW, although nuclear production of electricity was discontinued following the Fukushima accident in 2011 (Fig.6). The resumption of nuclear power generation has not yet begun, but the government is committed to reviving their use [30].
Japan's largest power plants are: gas — Fuutsu, with a total capacity of 5 040 MW [31]; oil — Yokosuka, with installed capacity of 2 274 MW; combined type — Kashima with a capacity of 5 660 MW; coal — Hekinan, with and installed capacity of 4 100 MW; nuclear — Kashiwazaki-Kariwa with a capacity of 8 212 MW [32,33].
Hydroenergy in Japan accounts for 7.9% of in national electricity generation; it is represented by several hydro and pumped storage power plants, which in 2021 produced more than 79.14 TWh of electricity (Fig.6).
Japan is one of the world leaders in using the available hydropotential in the country. So, if we take advantage of data on water resources in the country — 136 TWh/yr (Technically exploitable capability) or 114 TWh/yr (Economically exploitable capability) [34], then it turns out that the level of hydro resource use in Japan is 60% — 72% of the total available potential, which roughly corresponds to similar indicators in highly developed countries with respect to the share of electricity produced by hydro resources as Norway or Sweden, and is far ahead of world leaders in terms of production volumes like China, Brazil and Canada.
It should also be noted that Japan is the second country in the world after China in terms of combined capacity of installed pumped storage stations — 28.3 GW [35]. The leader of generation among hydroelectric power stations is Okutadami with an installed capacity of 560 MW [36], among the pumped storage power plants — Okutaragi, with an installed capacity of 1 932 MW [32].
In addition, as of early 2016 there are about 1 200 small hydroelectric power stations in Japan, with a total capacity of 3 545 MW (Fig.6).
Figure 7 shows the main infrastructure facilities in Japan for the production of renewable energy. Renewable energy in Japan, like hydropower, does not have a decisive influence on electricity generation. Thus, the total production of electricity from renewable sources in 2021, excluding hydropower, amounted to 211.5 TWh — 13.4% of the total electricity production (Fig.7).
Figure 7. Renewable energy in Japan: solar, wind, geothermal and hydrogen
In coastal areas, in zones of relatively high wind activity, there are wind parks, among them 9 large ones with a capacity of more than 50 megawatts each. The largest of these is Aoyama Plateau with an installed capacity of 95 MW [37]. The level of global horizontal irradiation in some regions of the country reaches 4.1 kWh/m²/day and higher, which is a sufficient resource for energy production by means of photovoltaics [9]. As a result, there is a number of solar energy facilities, including 9 photovoltaic stations with a capacity of more than 45 MW each and another three under construction (Fig.7). The largest in the country, Sakuto, a Pacifico Energy Solar PV Plant with an installed capacity of 257.7 MW is under construction [38].
As noted above, Japan has a very high potential for geothermal resources, but its share in electricity generation is low — 1.4% with a generation level of 3.01 TWh in 2021 (Fig.7).
However, Japan is among the top ten countries in the world in terms of total installed capacity for the production of geothermal energy — 603 MW, which in 2021 was 3.8% of the world's total [39]. Single and double flash geothermal stations are the most common. In contrast to Italy or the US, dry steam technologies are used extremely rarely. The country's largest combined power plant, Hatchobaru, with a capacity of 112 MW [40] operates in Oita Prefecture, in the northern Sapporo region — a 25 MW Mori Double Flash Geothermal Power Plant [41], Matsukawa Dry Steam Geothermal Power Plant with a capacity of 23.5 MW [42], as well as around seven Single Flash Geothermal Power Plants, the largest of which is the Kakkonda 1, 2 complex with an installed capacity of 80 MW [43]. Several Japanese companies are world leaders in the production of turbines for geothermal power plants, including Mitsubisi, Toshiba, and Fuji.
Japan is one of the leading countries in Asia for the production and use of hydrogen as an energy source for vehicles. As of December 2018, there are about 90 hydrogen filling stations in operation in the country (Fig. 7). In Japan, there are several commercial compression and cryogenic plants for the production of liquid hydrogen, the largest of which are Sakai (5 400 Nm³/hr) and Kanagawa (4 726 Nm³/hr) owned by the Iwatani International Corporation [44,45]. Hydrogen is transported via pipelines with a total length of 1.2 km (Fig.7).
Figure 8 shows the main bioenergy objects of Japan for energy production.
Figure 8. Renewable energy in Japan: bioenergy and marine
Bioenergy is being actively developed in Japan and, in 2022 bioenergy had an installed capacity of around 5.44 GWe (Fig.8).
The country has biomass and municipal garbage processing plants; biogas, biodiesel, bioethanol, pellet and landfill gas production. In Japan, there are a number of power plants that use biomass as raw materials; ten of them have a capacity of at least 30 MWel. The largest, Handa power plant, is under construction and will have a capacity of 75 MWel, [46]. The landfill utilization facility Tokyo Harbour has a capacity of 0.275 MW and produces around 1.6 million m3 of gas with a methane content of 55%, annually [47].
DINS Sakai Co. can produce about 1,400 kL of bioethanol annually at the largest facility in the country — Sakai City [48].
Jeplan at Imabari No.1 Plant produces second generation bioethanol, which is derived from cellulose found in cotton fibres [49]. The main Japanese enterprise in the field of fuel production from biomass is Revo International Biodiesel Plant in Kyoto, which can produce 5 000 litres of biodiesel per day [50].
Recycling various types of waste into usable forms of energy is of great importance to the Japanese energy sector. There are a significant number of enterprises for the processing of municipal waste in the country, including 12 enterprises with a capacity of more than 25 MW. The leader in terms of generational output is Tomakomai, with an installed capacity of 74 MW/h [51].
In terms of the level of generation of electricity from municipal and industrial waste, Japan placed 4th in the world in 2015, behind the US, China and Germany. Since 2010, the total volume of processing of municipal and industrial waste has increased in Japan by almost 30% [52].
Japan has been particularly successful in processing industrial waste, which has been largely facilitated by the widespread adoption of advanced gasification technologies, particular plasma techniques. Utashinai, Eco Valley Plasma Gasification Plant is the leading facility for the plasma gasification of waste, producing an average of 7.9 MWh [53].
There are several biomass gasification plants in the country, including Daio (Kani-City), Babcock & Wilcox Volund Bio-mass Gasification Plant, which has an installed capacity of 9.3 MWh [54].
Japan is the largest pellet consumer in Asia, but because of limited domestic wood resources, the country has to import the majority of this resource. In 2017, according to Japan Wood Pellets Association, there were about 147 pellet production enterprises with a total capacity of 126 532 tons (Fig.8).
The tragedy at Fukushima radically changed the course of modern energy policy of Japan. In particular, in the Strategic Energy Plan [55], the period between 2018-2020 was specified as a time of internal institutional reform, electricity system reform, changes in the international energy supply structure, and an increase in shale gas supplies from North America.
There are a large number of innovative energy projects in Japan, but the principle developments are seen in the field of hydrogen. One such project is targeted at the organization of transportation of large volumes of hydrogen using Chiyoda's SPERA Hydrogen® technology. To achieve this, two plants will be built: one in Brunei, where hydrogen will be produced from local gas and then hydrogenated (hydrogenate plant) by reacting it with toluene and forming a stable methylcyclohexaneb compound (MCH); and the other in Japan, in the coastal region of Kawasaki, where hydrogen dehydrogenation (dehydrogenation plant) is carried out and redistributed to local consumers. The product is transported between the plants by tankers with capacity of hydrogen transportation: 210 tons/year, which is enough to fuel 40,000 cars with fuel cells [56, 57]. Another, no less ambitious project from the Hitachi and Marubeni companies, is aimed at providing hydrogen to private households through the use of fuel cells to generate thermal and electric energy in the country. Should the project be successful the demand for fuel cells could increase significantly [58]. Another revolutionary project has been conceived by the Toshiba Corporation, Tohoku Electric Power Co., Inc. and the Iwatani Corporation. They plan to build a large-scale hydrogen energy system with a capacity of 10,000 kW to compensate grid loads through the use of gaseous hydrogen in the city of Namiecho, Fukushima prefecture. System testing is scheduled for 2020 [59].
Also notable is the hydrogen supply chain project for forklifts. Hydrogen produced at the Yokohama City Wind Power Plant using electrolysis technology is supplied to local enterprises where it will be used in fuel cells to power 12 forklift trucks. The vehicles will be first used in Japan, and each of them will have a total capacity of 270 Nm³ of hydrogen. This project could reduce CO2 emissions by at least 80% compared to forklifts running on gasoline or powered by electric grids [60]. More and more large-scale plans are being devised in Japan for the distribution of hydrogen filling stations. In May 2017, 11 Japan companies signed a memorandum of cooperation for the large-scale construction of hydrogen fuel stations for fuel cell transport; as of 2021 there are, 160 hydrogen gas stations in Japan and approximately 4,000 hydrogen cars on the road, which is 10% of government targets [61].
Regarding new energy capacities, it should be noted that in March 2016 there were: 6 power plants in Japan under construction using LNG as fuel, with a total capacity of more than 3 400 MW; three coal stations with a total capacity of 2 200 MW; three nuclear power plants with a total capacity of more than 4 000 MW; and three pumped storage stations with a total capacity of 2 480 MW [62].
In the field of wind power, the Shimizu Corporation has signed a contract with GE Renewable Energy to supply 22 wind turbines that will generate about 66 MW and provide 40,000 Japanese homes with electricity [63].
As of February 2017, five geothermal power projects instigated by Orix, Electric Power Development, J-Power, Idemitsu Kosan, JFE Engineering, Mitsui Oil Ex-ploration were at different stages of implementation. If all five projects are implemented, the geothermal power capacity of Japan will increase by 88.4 MW [64]. Toray Industries plans to spend about 5 billion yen (40 million euros) on the construction of one of the world's largest sugar cane processing plants; the demonstration plant will have a capacity of 15 tons/day, and the necessary raw materials will be supplied from Thailand [65]. In recent years, Japan has been developing energy efficient and environmentally friendly "smart" cities. One such example is the small town of Fujisawa, located not far from Tokyo. Established in 2014 by Panasonic in partnership with other project participants, the design of the city, its buildings and streets, water supply systems, communication and management systems take into account the maximum possible use of the natural landscape and local climate features, as well as the latest innovations in this area, to reduce energy consumption and create ecological comfort for residents. Several aspects in this project are directly related to energy: large-scale use of solar panels; the use of generators for electrical and thermal energy based on fuel cells; active use of energy storage technologies using powerful batteries; sensor control of street lighting; the widespread use of LED lamps and electric vehicles; and much more. The expected reduction in energy consumption in this city is 30% [66]. Another initiative by Panasonic is a project in Tsunashima, near Yokohama, that promises to be more ambitious as it will include a commercial zone in addition to residential buildings. The goals and means for achieving them are approximately the same — the maximum possible use of renewable sources for energy production (about 30%); reduction of CO2 emissions; reduction of water consumption; and significant energy accumulation and storage [67].
Education and Innovation
The set of indices reflecting the position of Japan relative to other countries in the field of education and innovation can be seen in Figure 9. The diagram shows Japan as being one of the world leaders.
Japan placed 13th out of 132 countries considered in the ranking of countries of the Global Innovation Index 2021 (see diagram). According to the number of patents granted to Japanese nationals, both domestically and abroad, the country ranks first in the world. Similarly, by the number of valid patents, the country is third only to the United States of America and China, indicating the country's favourable conditions for innovation.
In terms of government expenditure on education as a percentage of the country's GDP, the country demonstrates a result below the world average – 118th out of 177 countries selected for consideration. 48 Japanese universities are included in the rating of the world leading universities – “QS University Rating”. Japan's GDP is high, therefore, in absolute terms, the level of government expenditure on education is considerable.
Nevertheless, in terms of public expenditure on research and development as a percentage of GDP, Japan is 5th, behind only Israel, Sweden Republic of Korea and Switzerland. Japan is very well positioned when considering the number of publications of specialists in scientific and technological journal and patent activities. Japan is 5th out of 240 participating countries in the Scimago ranking, and in Scientific and Journal Activities is ranked 5th out of 197 countries, behind USA and China.
Universities of Japan, such as Tohoku University, Shinshu University, Kumamoto University, Nagasaki University, Kyushu University, Kyoto Institute of Technology, Yokohama City University, and Yokohama National University train specialists in various fields of energy, including Chemical Systems Engineering, Hydrogen Energy Systems, Earth Resources Engineering, and Environmental Engineering, etc.
In the field of synthetic fuel production, extraction and processing of unconventional oil, the leaders in patenting among Japanese companies are Cosmo Oil Co., Ltd. , JOGMEC, Japan Petroleum Exploration Co., Ltd. , INPEC Corporation.
| Sources: 1. The Global Innovation Index 2021, Rankings / Knowledge / World Intellectual Property Organization / Cornell University, INSEAD, and WIPO (2021): Energizing the World with Innovation. Ithaca, Fontainebleau, and Geneva *132 2. Patent Grants 2011-2020, resident & abroad / Statistical country profiles / World Intellectual Property Organization *185 3.Patents in Force 2020 / Statistical country profiles / World Intellectual Property Organization *109 4. QS World University Rankings 2022 *97 5. SCImago Country Rankings (1996-2020) / Country rankings / SCImago, (n.d.). SIR-SCImago Journal & Country Rank [Portal]. Retrieved 17 Nov 2021 *240 6. Internet users in 2018 / The World Factbook / Central Intelligence Agency *229 7. Internet users in 2018 (% Population) / The World Factbook / Central Intelligence Agency *229 8. Government expenditure on education, total (% of GDP), 2019 / United Nations Educational, Scientific, and Cultural Organization (UNESCO) Institute for Statistics. License: CCBY-4.0 / Data as of September 2021*177 9. Research and development expenditure (% of GDP), 2018 / UNESCO Institute for Statistics. License: CCBY-4.0 / Data *119 10. Scientific and technical journal articles, 2018 / National Science Foundation, Science and Engineering Indicators. License: CCBY-4.0 / Data *197 * Total number of countries participating in ranking Figure 9. The indices of education and innovation in Japan |
Research and development in this field is carried out by the Tokyo Institute of Technology, University of Toyama, AIST National Institute of Advanced Industrial Science and Technology and Tohoku University.
The leading patent holders in the field of unconventional oil are Sumitomo Metal Industries Ltd., Hitachi, Ltd., Tokyo Gas Co. Ltd.; Tohuku Electric Power University, Japan Petroleum Exploration Co., Ltd. and Kyushu University are conducting research in this field.
Kawasaki Heavy Industries, Ltd., Osaka Gas Corporation and Mitsubishi Heavy Industries, Ltd. are engaged in research and development in the field of coal seam methane utilization technologies. Research is being conducted by Kyushu University and the University of Tokyo.
Another area where Japanese companies actively patent their technology is the exploration of gas hydrates, where Nippon Steel & Sumimoto Metal Corp., AIST National Institute of Advanced Industrial Science and Technology and Tohoku University. And Mitsui Engineering & Shipbuilding Co., Ltd.; and Japan Oil, Gas and Metals National Corporation (JOGMEC), AIST National Institute of Advanced Industrial Science and Technology and the University of Tokyo are conducting research in this area. In the field of the production of hydrocarbons from low permeability reservoirs – the Kureha Corporation and Toyo Seikan Group Holdings, Ltd., Sumitomo Bakelite Co, Hitachi Ltd, and the research is carried out by Japan Oil, Gas and Metals National Corporation (JOGMEC).
In the field of associated gas, Japan Petroleum Exploration Co., Ltd. And Tokyo Gas Co. Ltd., have the highest number of patents, and JOGMEC has the highest number of publications.
The leading patent holders in the field of bioenergy are Mitsubishi Heavy Industries, Ltd., IHI Corporation, Toyota Motor Corporation. Kyushu University and Tokyo Institute of Technology are conducting research in this field.
A large number of Japanese companies patent technical solutions in the field of energy production from renewable sources. In the field of solar energy Sumitomo Electric Industries, Ltd., Mitsubishi Heavy Industries, Ltd., Kyosemi Corporation, and the Sharp Corporation should be mentioned. Leading research organizations in this field are Tokyo Institute of Technology, Niigata University and Tohoku University. Mitsubishi Heavy Industries, Ltd., are ahead in the number of patents in the field of wind power; research in this field is being conducted by Kyushu University and Mie University.
Ecology and Environment Protection
| Sources: 1. CO2 total emission by countries 2020 / European Commission / Joint Research Centre (JRC) / Emission Database for Global Atmospheric Research (EDGAR)*208 2. CO2 per capita emission 2020/European Commission/Joint Research Centre (JRC) / Emission Database for Global Atmospheric Research (EDGAR) *208 3. Forest area 2020 (% of land area) / The Global Forest Resources Assessment 2020 / Food and Agriculture Organization of the United Nations *234 4. Forest area change 2010-2020 (1000 ha/year) / The Global Forest Resources Assessment 2020 / Food and Agriculture Organization of the United Nations *234 5. The Environmental Performance Index (EPI) 2020 / Rankings / Yale Center for Environmental Law & Policy / Yale University *180 6. Annual freshwater withdrawals (m3 per capita), 2017 *179 Annual freshwater withdrawals, total (billion m3), 2017 – Food and Agriculture Organization, AQUASTAT data. /License: CC BY-4.0; Population – United Nations, Department of Economic and Social Affairs, Population Division (2019). World Population Prospects 2019, custom data acquired via website. Retrieved 15 November 2021 7. The National Footprint Accounts 2017 (Biocapacity Credit / Deficit) / Global Footprint Network *188 8. Methane emissions (kt of CO2 equivalent), 2018 / Data for up to 1990 are sourced from Carbon Dioxide Information Analysis Center, Environmental Sciences Division, Oak Ridge National Laboratory, Tennessee, United States. Data from 1990 are CAIT data: Climate Watch. 2020. GHG Emissions. Washington, DC: World Resources Institute. Available at: License : Attribution-NonCommercial 4.0 International (CC BY-NC 4.0) *191 9. The Climate Change Performance Index (CCPI) 2022 / Overall Results / Jan Burck, Thea Uhlich, Christoph Bals, Niklas Höhne, Leonardo Nascimento / Germanwatch, NewClimate Institute & Climate Action Network *60 * Total number of countries participating in ranking Figure 10. Environmental Indices of Japan |
The country demonstrates a relatively high level of CO2 emissions, both in general and per capita. Japan is regarded as one of the 61 countries responsible for more than 90% of global CO2 emissions related to energy, in the Climate Change Performance Index (CCPI) 2022.
In terms of forest area as a percentage of the country, Japan is 22nd in the world and demonstrates a negative trend (170th in the world), although it was previously noted that compared with 1990 the total forest area in Japan has not decreased. Japan is considered a major ecological debtor by the Ecological Footprint Atlas. The situation is brightened by a relatively high valuation of Japan in the Environmental Performance Index rankings (EPI) 2020, which focuses primarily on assessing the environmental performance of national governments. Here, the country is 12th out of 180 countries.
References
[1] List of sovereign states and dependencies by area / Wikipedia / en.wikipedia.org/wiki/List_of_sovereign_states_and_dependencies_by_area
[2] List of countries and dependencies by population density / Wikipedia / en.wikipedia.org/wiki/List_of_countries_and_dependencies_by_population_density
[3] Japan / The world factbook / Library / Central Intelligence Agency / www.cia.gov
[4] GDP, PPP (constant 2011 international $) / World Bank, International Comparison Program database. License: CC BY-4.0 / Data / The World Bank / www.worldbank.org
[5] GDP per capita, PPP (current international $) / World Bank, International Comparison Program database. License: CC BY-4.0 / Data / The World Bank / www.worldbank.org
[6] Japan / U.S. Energy Information Administration (November 2, 2020) / www.eia.gov/beta/
[7] 石油備蓄の現況Resources / Resource and Fuel Department, Agency for Natural Resources and Energy / www.enecho.meti.go.jp
[8] BP Statistical Review of World Energy 2021 (PDF) / BP / www.bp.com
[9] 2006 IPCC Guidelines for National Greenhouse Gas Inventories, Volume 2, Energy, Fugitive Emissions (PDF) / The Intergovernmental Panel on Climate Change (IPCC) / www.ipcc-nggip.iges.or.jp
[10] Solar resource data obtained from the Global Solar Atlas, owned by the World Bank Group and provided by Solargis / Global Solar Atlas / globalsolaratlas.info
[11] Wind Map / Global Wind Atlas 2.0, a free, web-based application developed, owned and operated by the Technical University of Denmark (DTU) in partnership with the World Bank Group, utilizing data provided by Vortex, with funding provided by the Energy Sector Management Assistance Program (ESMAP). For additional information: globalwindatlas.info
[12] World Energy Resources: Hydro World Energy Council / 2013 / Publications / World Energy Council / www.worldenergy.org/
[13] Agricultural land (% of land area) /Food and Agriculture Organization, electronic files and web site. License: CC BY-4.0 / Data / The World Bank / www.worldbank.org
[14] Forest area (% of land area) /Food and Agriculture Organization, electronic files and web site. License: CC BY-4.0 / Data / The World Bank / www.worldbank.org
[15] 2016 Annual U.S. & Global Geothermal Power Production Report (PDF) / International Geothermal Association / www.geothermal-energy.org
[16] What a Waste 2012 (PDF) / Resources / The World Bank / www.worldbank.org
[17] International Energy Statistic / Geography / U.S. Energy Information Administration (December 2021) / www.eia.gov/beta/international/
[18] 2021 World LNG Report (PDF) / International Gas Union / www.igu.org
[19] Japan’s 2016 LNG imports drop 2 pct / LNG World News / www.lngworldnews.com
[20] 勇払ガス田 / Wikipedia / ja.wikipedia.org
[21] Petroleum Industry in Japan 2020 (PDF) / Petroleum Association of Japan / www.paj.gr.jp
[22] Gloabl strategic petroleum reserves / Wikipedia / en.wikipedia.org
[23] Utilization of Underground Gas Storage (UGS) in Japan. 2009 (PDF) / Koji Yoshizaki, Noriaki Sato, Hiroshi Fukagawa, Hiromi Sugiyama , Genta Takagi and Takenobu Jono / International Gas Union / members.igu.org
[24] LNG Technologies / Tokyo Gas / www.tokyo-gas.co.jp
[25] Japan-GTL Process / Japan-GTL Consortium / japan-gtl.com
[26] DME Promotion Plant by the Indirect method / Production of DME / Japan DME Association / japan-dme.or.jp
[27] Tokyo Engineering Corporation / www.toyo-eng.com
[28] Methane Hydrate / Oil and Natural Gas / Japan Oil, Gas and Metals National Corporation (JOGMEC) / www.jogmec.go.jp
[29] Japan reports successful gas output test from methane hydrate / May 8, 2017 / Reuters / www.reuters.com
[30] Japan to Continue Restarting Nuclear Power Plants, Despite Takahama Halt / Sputnik International / sputniknews.com
[31] Major Facilities as of March 31, 2016 (PDF) / Tokyo Electric Power Company (TEPCO) / www.tepco.co.jp
[32] Electricity Review Japan 2016 (PDF) / The Federation of Electric Power Companies of Japan (FEPC) / www.fepc.or.jp
[33] Japan (Info Updated July 2017) / Information Library / World Nuclear Association / www.world-nuclear.org
[34] 2004 Survey of Energy Resources (PDF) / World Energy Council / www.worldenergy.org
[35] Japan / Global Energy Storage Database / www.energystorageexchange.org
[36] Hydroelectric Power / Our Domestic Facilities / J-Power (Electric Power Development Co., Ltd.) / www.jpower.co.jp
[37] Aoyama-kogen Wind Farm / www.awf.co.jp
[38] April 2017 – Sakuto Mega-solar project / Pacifico Energy / www.pacificoenergy.jp
[39] ThinkGeoEnergy’s Top 10 Geothermal Countries 2021 – installed power generation capacity (MWe) / January 10, 2022 / Think Geoenergy / www.thinkgeoenergy.com
[40] Hatchobaru Geothermal Power Plant / Wikipedia / en.wikipedia.org/wiki/Hatchobaru_Geothermal_Power_Plant
[41] 森発電所 (Mori Power Station) / Wikipedia / ja.wikipedia.org/wiki/%E6%A3%AE%E7%99%BA%E9%9B%BB%E6%89%80
[42] Matsukawa Geothermal Power Plant / Wikipedia / en.wikipedia.org/wiki/Matsukawa_Geothermal_Power_Plant
[43] Geothermal Power Stations / Tohoku Electric Power Co., Inc. / www.tohoku-epco.co.jp/english/index.html
[44] Merchant Hydrogen Plant Capacities in Asia / Hydrogen tools / h2tools.org
[45] Hydroedge: Construction of Hydrogen Production Plant / Project Cases / Cosmo Engineering Co. Ltd. / www.cosmoeng.co.jp
[46] Construction to Begin on Biomass Power Plant in Handa, Aichi Prefecture / 2014 / News Release / Sumitomo Corporation / www.sumitomocorp.co.jp
[47] Tokyo Metropolitan Government Waste Landfill Site (PDF) / Tokyo Metropolitan Government / www.seisakukikaku.metro.tokyo.jp
[48] Bio-fuel Database in East Asia: Japan / Asia Biomass Office / www.asiabiomass.jp
[49] Imabari No. 1 Plant. Production of bio-ethanol from cotton fiber / Jeplan, Inc. / www.jeplan.co.jp
[50] Biodiesel Fuel Production Facility / Hitachi Zosen Corporation / www.hitachizosen.co.jp
[51] Sanix Company Profile (PDF) / Sanix Inc. / sanix.jp
[52] International Energy Agency / Statistics / www.iea.org
[53] Plasma Gasification / National Energy Technology Laboratorium / www.netl.doe.gov
[54] CHP Updraft gasifier Daio / Task 33 / IEA Bioenergy / www.ieatask33.org
[55] Strategic Energy Plan / Agency for Natural Resources and Energy / www.enecho.meti.go.jp
[56] Japan’s global hydrogen supply chain demonstration project / Gas World / www.gasworld.com
[57] Development of large-scale H2storage and transportation technology with Liquid Organic Hydrogen Carrier (LOHC) (PDF) / Chiyoda Corporation / www.chiyoda-corp.com
[58] Hitachi and Marubeni are launching a new delivery project / Hydrogen Fuel News / www.hydrogenfuelnews.com
[59] Toshiba, Tohoku Electric Power and Iwatani Start Development of Large Hydrogen Energy System / Fuel Cells Works / fuelcellsworks.com
[60] Iwatani in hydrogen supply chain project, full-scale operations commence in Japan /13 Jul 2017 / Gasworld / www.gasworld.com
[61] On the road toward renewable energy, Japan is betting on hydrogen / October 29, 2021 / CBS News / www.cbsnews.com
[62] Japan Electric Power Information Center / www.jepic.or.jp
[63] GE Renewable Energy Selected to Provide 66 MW of Wind Power with 22 units for Japan’s Akita Region / 23 Jun 2017 / Windfair / w3.windfair.net
[64] Small-scale geothermal power development picking up in Japan / 27 Feb 2017/ ThinkGeoEnergy/ www.thinkgeoenergy.com
[65] Fast, low energy, and continuous biofuel extraction from microalgae / 28 Apr 2017 / Biofuels Digest / www.eurekalert.org
[65] Project Overview /Fujisawa SST / fujisawasst.com
[67] Panasonic and Nomura Real Estate Unveil Concept Plan for New Smart Town in Yokohama / Coenergia Group / coenergia.com
The sources of charts and curves are specified under the images.
For more information about the energy industry in Japan see here