
Contents
General State of the Economy
Greece, officially the Hellenic Republic, is the southernmost country of the Balkan Peninsula. Greece borders Bulgaria and the Republic of North Macedonia to the north, Albania to the northwest and Turkey to the northeast. The country is bounded by the Ionian Sea to the west, the Mediterranean Sea to the south, and the Aegean Sea to the east. With its large number of islands, Greece has the longest coastline in the Mediterranean Sea Basin stretching over 13,676 kilometers.
According to 2023 statistics, Greece, which in terms of size is 97th in the world, is home to around 10,5 million people. In terms of population density the country is 110th in the world out of 199 countries considered. The administrative map of the country is divided into 13 regions and 1 autonomous monastic state with Athens as its capital and the most-populous city. The political form of government is a parliamentary republic, and the official language is Greek [1,2,3].
| Greece / Hellenic Republic | ||
|---|---|---|
| Capital: Athens | Density: 79.1/km2 | Currency: Euro (€) (EUR) |
| Official languages: Greek | Life expectancy at birth: 81.09 years | GDP (PPP): $416.969 billion (2023 est.) |
| National Day: 25 March | Area (land): 131,957 km2 | GDP - per capita (PPP): $39,864 (2023 est.) |
| Population: 10,495,595 (2023 est.) | Coastline: 13,676 km | Internet country code: .gr |
Source: [1,2,3,4,5]

Acropolis in Athens, Greece. Envato. UQPMXSNWDR
The ranking positions of Greece relative to other countries have been determined for an extensive list of economic, energy, innovative and educational indices, as well as for metrics reflecting the state of the environment. The economic indices include, for example, GDP per capita, annual average GDP growth, high-technology exports, and others. The list of energy indices includes proven reserves of oil, gas and coal, production-consumption ratio combined, and energy use, etc. Each of the indices has a ranked list of included member countries. Since the number of countries in each rating is different for each index, the positioning of the country of interest is displayed on a special chart, where the vertical axis is a uniform relative scale from 0 to 1, whereas the horizontal axis denominates the various indices and respective numbers relating to the descriptions given underneath.
Thus, in such a relative “0-1” diagram, the country’s position is marked with a dot in proportion to its location in the original rating list. If the country is among the leaders regarding the selected indicator, it will be marked close to 1 in the upper green zone on the relevant chart “0-1”, if the country is an outsider in the rating list, then it will be marked in the lower red zone of the chart “0-1”, etc. A single list of indices is used for all countries. If a country is not in the ranking list for any index, then the corresponding position on the charts is not displayed.
Ranking position of Greece for list of economic indices:
| Sources: 1. GDP (purchasing power parity), 2020 est. / The World Factbook/Library/Central Intelligence Agency *228 2. GDP - per capita (PPP), 2020 / The World Factbook/Library/Central Intelligence Agency *229 3. Inflation rate (consumer prices), 2019 est. / The World Factbook/Library/Central Intelligence Agency *228 4. Charges for the use of intellectual property, receipts (BoP, current US$), 2020 / International Monetary Fund, Balance of Payments Statistics Yearbook, and data files. / License: CC BY-4.0 *88 5. The Global Competitiveness Index 2019 / Rankings / Reports / World Economic Forum *141 6. High-technology exports (current US$) 2019-2020 / United Nations, Comtrade database through the WITS platform / License: CCBY-4.0 / Data *134 7. 2021 Index of Economic Freedom / International Economies / The Heritage Foundation *178 8. Reserves of foreign exchange and gold, 2017 est. / The World Factbook / Library / Central Intelligence Agency *195 9. Annual average GDP growth in %, for the last 10 years (2011-2020) / World Bank national accounts data, and OECD National Accounts data files / License: CC BY-4.0*206 10. Public debt (% of GDP), 2017 est. / The World Factbook / Library / Central Intelligence Agency (from smallest to largest) *210 * Total number of countries participating in ranking Figure 1. Economic Indices of Greece |
As can be seen from the graph above, the economic situation in Greece is quite uneven. Of the indices presented, the country has the highest values for Inflation rate (0.88), GDP (0.76) and GDP per capita (0.70). The weakest parts of Greece's economic indicators are Annual average GDP growth in % (0.02) and Public debt (0.00).
Energy Resources
Greece has very small domestic reserves of fossil fuels in the form of natural gas and oil, amounting to 0.0005% and 0.0006% of the world total, respectively. The situation with coal is somewhat better, but reserves are significantly lower than those of the world leaders. Greece has 0.27% of the world's coal, which is, for example, 38 times less than India and 8 times less than Kazakhstan.
In terms of tons of oil equivalent, according to the 2024 data, conventional proved reserves by fuel type were: 99.9% – coal and 0.1% – natural gas (Fig.5).
Table 1. Fossil energy resources of Greece
| Resource /Explanations | Crude oil* | Natural gas* | Coal* | Shale Gas | Tight Oil | Coalmine methane |
|---|---|---|---|---|---|---|
| Value | 0.01 (0.0006%) | 0.035 (0.0005%) | 3 170 (0.27%) | - | - | - |
| Unit | billion barrels | Tcf | million short tons | - | - | - |
| Year | 2021 | 2020 | 2021 | - | - | - |
| Source | [6] | [6] | [6] | - | - | - |
* share of the country’s reserves in world total is provided in brackets
Greece has favorable conditions for the development of renewable energy in general and wind power in particular. In a number of regions of the country, especially on the coast in the eastern part of country, wind speed reaches 8 m/s at a height of 50 m. The southern part of Greece, including many islands, has the most advantageous climatic conditions for the development of solar energy, where the solar GHI reaches 4.9-5.2 kWh/m2 per day.
GREECE, PAROS
Latitude: 37.02 Longitude: 25.13
Average speed: 5.05 m/s, Operational share: 78%
Average daily wind speed for 10 years of observations, m/s, 10 m above ground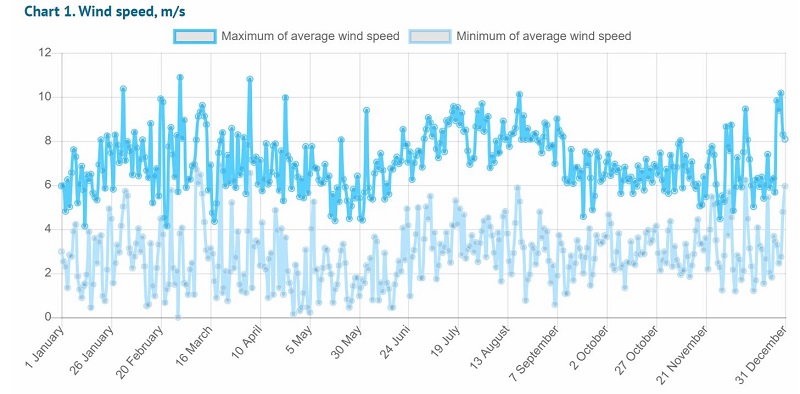
Source: based on NOAA U.S. Department of Commerce
GREECE, MILOS
Latitude: 36.73, Longitude: 24.43
Average daily sky coverage over 10 years of observations, %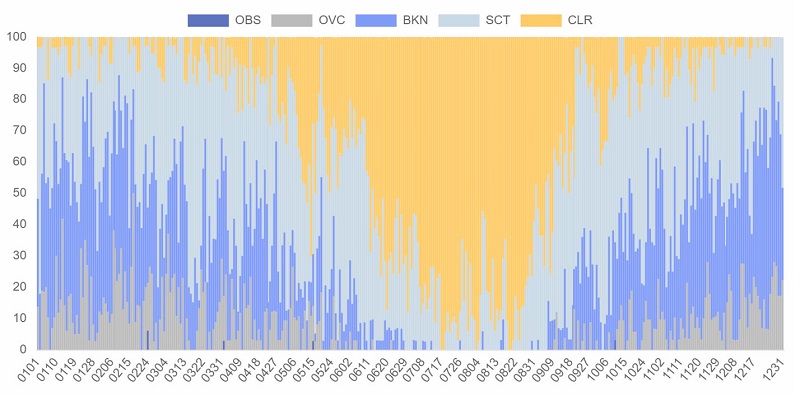
CLR - clear, SCT - scattered from 1/8 TO 4/8, BKN - broken from 5/8 TO 7/8, OVC - overcast, OBS - obscured, POB - partial obscuration
Source: based on NOAA U.S. Department of Commerce
Hydropower has significant potential in the country and plays an important role in electricity generation in Greece, providing about 27% of all renewable electricity generated in 2021, with most hydroelectric power plants located in the northwestern mountainous area.
Table 2. Renewable energy resources of Greece
| Resource/ explanations | Solar Potential (GHI)* | Wind Potential (50 м)* | Bio Potential (agricultural area) | Bio Potential (forest area) | Geothermal Potenial | Municipal Solid Waste |
|---|---|---|---|---|---|---|
| Value | 4.4-4.9 | 5.0-6.0 | 45.5 | 30.3 | 1500 | 524 |
| Unit | kWh/m2/day | m/s | % of land area | % of land area | MWe | kg per capita |
| Year | 2020 | 2020 | 2020 | 2020 | 2014 | 2021 |
| Source | [7] | [8] | [9] | [10] | [11] | [12] |
*for most of the territory of the country
About 75% of the country's territory is covered by agricultural and forest areas. Industrial waste from these areas form a worthy resource base for the development of a number of bioenergy technologies, particularly biogas and bioethanol production.
Energy Balance
According to [6], in 2022 in Greece, the total production of primary energy was 0.154 quadrillion Btu, while consumption was at the level of 0.983 quadrillion Btu. Thus, the share of domestic production in primary energy consumption was 15.7%. This makes Greece a country highly dependent on energy imports.
According to the Statistical Review of World Energy 2022, primary energy consumption in Greece in 2021 amounted to 1.05 exajoules and was dominated by oil – 49.5%, followed by natural gas – 23.8%, renewables – 12.2%, coal – 6.7%, and hydroelectricity – 4.8% [13].
Source: U.S. Energy Information Administration (Mar 2024) / www.eia.gov
Figure 2. The production and consumption of fossil fuels in Greece (coal – left, gas – in the center, oil – right)
As can be seen from the graph above, Greece produces only a negligible amount of fossil fuels domestically and is mostly dependent on imports. Compared to 2015, natural gas consumption more than doubled in 2022, while oil consumption decreased slightly over the same period. The only fossil fuel that the country produces almost entirely domestically is coal, and there is a clear downward trend in consumption.
Sources: U.S. Energy Information Administration (Mar 2024) / www.eia.gov | ||
| Figure 3. Electricity production in Greece |
In 2022, Greece's total electricity production was at the same level as in 2015. The country has been experiencing a shortage of self-generated electricity since 2014 and managed to reach self-sufficiency in electricity in 2021. This is primarily due to an increase in energy production from renewable sources. For comparison, if in 2010 the share of renewable energy sources (except hydro) amounted to 5.6% of the total electricity generated, in 2022 this share reached approximately 37%.
| Sources: 1. Crude oil proved reserves, 2021 / International Energy Statistic/Geography / U.S. Energy Information Administration (Nov 2021)*98 2. Natural gas proved reserves 2021 / International Energy Statistic / Geography / U.S. Energy Information Administration (Nov 2021) *99 3. Total recoverable coal reserves 2019 / International Energy Statistic / Geography / U.S. Energy Information Administration (Nov 2021) *81 4. Combination production-consumption for Crude oil 2018 / International Energy Statistic / Geography / U.S. Energy Information Administration (Nov 2021) *219 5. Combination production-consumption for Natural gas 2019 / International Energy Statistic / Geography / U.S. Energy Information Administration (Nov 2021) *123 6. Combination production-consumption for Coal 2019 / International Energy Statistic / Geography / U.S. Energy Information Administration (Nov 2021) *128 7. Electricity – from other renewable sources (% of total installed capacity), 2017 est. / The World Factbook / Library / Central Intelligence Agency *170 8. GDP per unit of energy use (PPP per unit of oil equivalent), 2020 *66 Primary energy consumption - BP Statistical Review of World Energy 2021/BP;GDP (purchasing power parity) - The World Factbook/Library/Central Intelligence Agency 9. Energy use (primary energy use of oil equivalent per capita) 2020 *127 Primary energy consumption – BP Statistical Review of World Energy 2021; Population - United Nations, Department of Economic and Social Affairs, Population Division (2019). World Population Prospects 2019, custom data acquired via website. Retrieved 15 November 2021*66 10. The Global Energy Architecture Performance Index Report (EAPI) 2017 / Rankings / Reports / World Economic Forum 11. Electric power consumption (kWh per capita), 2016 *217 Electricity Consumption - The World Factbook / Library / Central Intelligence Agency; Population - United Nations, Department of Economic and Social Affairs, Population Division (2019). World Population Prospects 2019, custom data acquired via website. Retrieved 15 November 2021 12. Combination of electricity production-consumption (kWh)/The World Factbook/Library/Central Intelligence Agency *216 * Total number of countries participating in ranking Figure 4. Energy indices of Greece |
The energy indices shown in the graph above reveal Greece as a country dealing with high energy demands. The generation to consumption ratio for natural gas (0.22) and crude oil (0.11) is relatively low because the country's energy needs are much higher than its domestic capacity.
Since almost all of the coal used in the country is domestically produced, the coal production and consumption ratio (0.88) is one of the highest indicators among all presented. In addition, Greece has a good performance in renewable energy production (0.89), which has increased significantly in recent years.
Energy Infrastructure
A territorial map showing distribution of the largest infrastructure projects of the fossil fuel sector in Greece is displayed in Figure 5. As previously mentioned, coal reserves account for 99.9% and crude oil for 0,1% of all proven reserves of fossil fuels.
The largest coal mine in Greece and the Balkans, Ptolemaida-Florina, is located in the north of the country. Other important deposits are Drama and Elassona, also in the northern part of the country, and Megalopolis in the south. As part of the decarbonization process, Greece's long-term plan is a phase-out of coal, an implementation that was started but adjusted because of Russia's invasion of Ukraine. According to government statements, the country will have to increase coal production again in the coming years to help reduce its dependence on gas.
Crude oil and natural gas extraction in Greece is concentrated in the Prino-Kavala offshore basin, located in the northern part of the Aegean Sea. Crude oil is produced from three fields: Prinos, Prinos North and Epsilon. Greece's conventional oil infrastructure includes several operating refineries, oil storage facilities and oil terminals.
Greece has only marginal domestic gas production and meets its gas needs almost entirely through imports. Several gas pipeline systems operate in Greece to ensure domestic gas supplies and gas deliveries to Europe. One of them, the Trans Adriatic Pipeline, which runs through Greece from the Turkish border to Southern Italy, is the main source of gas imports to Europe from Azerbaijan.
Figure 5. Basic infrastructure facilities of the fossil fuel sector in Greece
According to the U.S. Energy Information Administration data, in 2022, 53.4% of electricity in Greece was generated by fossil fuels power plants, mainly driven by gas. 
Figure 6. Electricity production in Greece
Although the largest power plant in the country is Agios Dimitrios with a capacity of 1595 MW is coal-fired and is located in Western Macedonia.
Agios Dimitrios Power Plant in Greece. 1,585 MW, lignite. Envato. BRZ43CQEND
Hydropower also consistently contributes to the country's energy production at an average of approximately 10% depending on the year. Hydroelectric power plants are located in the northwestern part, in regions where most of the mountains are found. As of 2018, Greece registered about 115 small-scale hydropower plants up to 15 MW with a total installed capacity of 232.0 MW.
Figure 7. Renewable energy in Greece
According to the data, provided by the U.S. Energy Information Administration, in 2022 about 38% of Greece's electricity production was renewables-based (excluding hydropower), dominated by wind power.
However, renewable energy has made a breakthrough in the last two years, and according to the latest data for Greece's interconnected electricity grid [14], in 2022 renewables, with the exception of large hydroelectric plants, surpassed all other electricity sources, leaving natural gas in second place. This leadership was maintained in the first eight months of 2023 (14224 GWh), outperforming by 1.5 TWh fossil gas and lignite together (12753 GWh).
The largest wind cluster in Greece is the Kafireas wind project, located on the southern tip of the island of Evia. Its first part was commissioned in 2019 and has a total installed capacity of about 154.1 MW. Its sister project, the 330MW Kafireas II wind farm, is being developed by Greek renewable energy developer Terna Energy and is already partially operational [15].
The Greek government is working on measures to further accelerate the development of renewable energy in the country. According to the National Energy and Climate Plan, presented by the Ministry of Environment and Energy, the country plans to obtain 61% of its energy from renewable sources by 2030. In addition to the further development of solar and wind sources, the plan envisages the use of biomass for energy and fuel production and the development of appropriate energy infrastructure to transition from the current traditional uses of biomass to more energy-efficient and cost-effective ones. Special attention is to be paid to the use of biomethane by feeding it directly into the gas grid, as well as its application in the transportation sector [16].
Education and Innovation
| Sources: 1. The Global Innovation Index 2021, Rankings / Knowledge / World Intellectual Property Organization / Cornell University, INSEAD, and WIPO (2021): Energizing the World with Innovation. Ithaca, Fontainebleau, and Geneva *132 2. Patent Grants 2011-2020, resident & abroad / Statistical country profiles / World Intellectual Property Organization *185 3.Patents in Force 2020 / Statistical country profiles / World Intellectual Property Organization *109 4. QS World University Rankings 2022 *97 5. SCImago Country Rankings (1996-2020) / Country rankings / SCImago, (n.d.). SIR-SCImago Journal & Country Rank [Portal]. Retrieved 17 Nov 2021 *240 6. Internet users in 2018 / The World Factbook / Central Intelligence Agency *229 7. Internet users in 2018 (% Population) / The World Factbook / Central Intelligence Agency *229 8. Government expenditure on education, total (% of GDP), 2019 / United Nations Educational, Scientific, and Cultural Organization (UNESCO) Institute for Statistics. License: CCBY-4.0 / Data as of September 2021*177 9. Research and development expenditure (% of GDP), 2018 / UNESCO Institute for Statistics. License: CCBY-4.0 / Data *119 10. Scientific and technical journal articles, 2018 / National Science Foundation, Science and Engineering Indicators. License: CCBY-4.0 / Data *197 * Total number of countries participating in ranking Figure 8. The indices of education and innovation in Greece |
The majority of Greek indices describing the country's positioning in the various international rankings related to education and innovation are above average. Greece has the highest rankings in SCImago Country Rankings (0.86), Scientific and technical journal articles (0.82) and Patent Grants (0.77). The lowest indicator in the country is public spending on education (0.32). This is partly responsible for the fact that the country did not rise above the world average in the QS World University Rankings (0.49).
Ecology and Environment Protection
| Sources: 1. CO2 total emission by countries 2020 / European Commission / Joint Research Centre (JRC) / Emission Database for Global Atmospheric Research (EDGAR)*208 2. CO2 per capita emission 2020/European Commission/Joint Research Centre (JRC) / Emission Database for Global Atmospheric Research (EDGAR) *208 3. Forest area 2020 (% of land area) / The Global Forest Resources Assessment 2020 / Food and Agriculture Organization of the United Nations *234 4. Forest area change 2010-2020 (1000 ha/year) / The Global Forest Resources Assessment 2020 / Food and Agriculture Organization of the United Nations *234 5. The Environmental Performance Index (EPI) 2020 / Rankings / Yale Center for Environmental Law & Policy / Yale University *180 6. Annual freshwater withdrawals (m3 per capita), 2017 *179 Annual freshwater withdrawals, total (billion m3), 2017 – Food and Agriculture Organization, AQUASTAT data. /License: CC BY-4.0; Population – United Nations, Department of Economic and Social Affairs, Population Division (2019). World Population Prospects 2019, custom data acquired via website. Retrieved 15 November 2021 7. The National Footprint Accounts 2017 (Biocapacity Credit / Deficit) / Global Footprint Network *188 8. Methane emissions (kt of CO2 equivalent), 2018 / Data for up to 1990 are sourced from Carbon Dioxide Information Analysis Center, Environmental Sciences Division, Oak Ridge National Laboratory, Tennessee, United States. Data from 1990 are CAIT data: Climate Watch. 2020. GHG Emissions. Washington, DC: World Resources Institute. Available at: License : Attribution-NonCommercial 4.0 International (CC BY-NC 4.0) *191 9. The Climate Change Performance Index (CCPI) 2022 / Overall Results / Jan Burck, Thea Uhlich, Christoph Bals, Niklas Höhne, Leonardo Nascimento / Germanwatch, NewClimate Institute & Climate Action Network *60 * Total number of countries participating in ranking Figure 9. Environmental Indices of Greece |
Greece is among the countries with high carbon dioxide emissions, both overall (0.25) and per capita (0.28), which partly explains its low ranking in the National Footprint Accounts (0.22).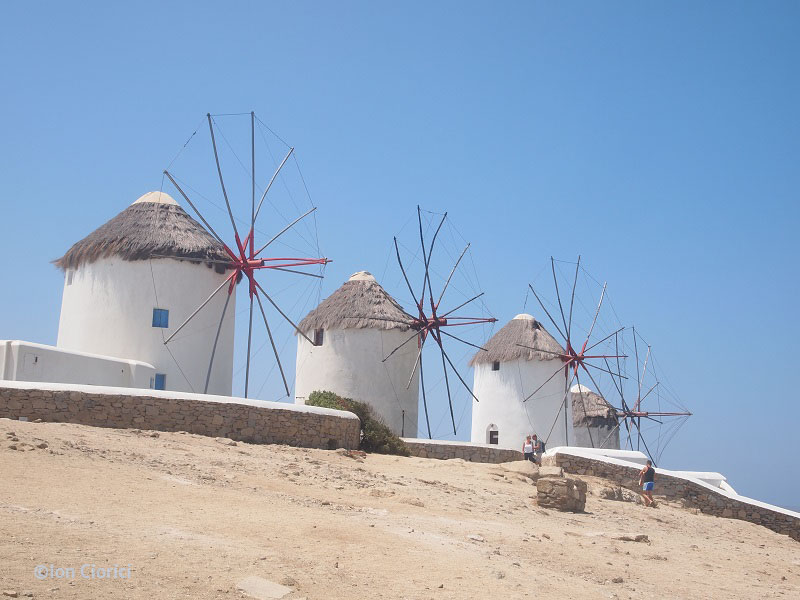
Old windmills. Credit I.Ciorici
On the other hand, positive indicators include the country's high positions in terms of Annual freshwater withdrawals (0.91) and Environmental Performance Index (0.86). The forest area indicator in the country is at the world average level (0.50). The same applies to methane emissions (0.49). In general, as can be seen from the above graph, the environmental situation in the country requires significant improvement.
References
[1] List of sovereign states and dependencies by area / Wikipedia / https://en.wikipedia.org/wiki/List_of_countries_and_dependencies_by_area
[2] List of countries and dependencies by population density / Wikipedia / https://en.wikipedia.org/wiki/List_of_countries_and_dependencies_by_population_density
[3] Greece / The world factbook / Library / Central Intelligence Agency / http://www.cia.gov/
[4] GDP, PPP (constant 2011 international $) / World Bank, International Comparison Program database. License: CC BY-4.0 / Data / The World Bank / www.worldbank.org
[5] GDP per capita, PPP (current international $) / World Bank, International Comparison Program database. License: CC BY-4.0 / Data / The World Bank / www.worldbank.org
[6] International Energy Statistic / Geography / U.S. Energy Information Administration (Dec 2022) / https://www.eia.gov/international/
[7] Solar resource data obtained from the Global Solar Atlas, owned by the World Bank Group and provided by Solargis / Global Solar Atlas / https://globalsolaratlas.info
[8] Greece Wind Map / Global Wind Atlas 2.0, a free, web-based application developed, owned and operated by the Technical University of Denmark (DTU) in partnership with the World Bank Group, utilizing data provided by Vortex, with funding provided by the Energy Sector Management Assistance Program (ESMAP). For additional information: https://globalwindatlas.info
[9] Agricultural land (% of land area) /Food and Agriculture Organization, electronic files and web site. License: CC BY-4.0 / Data / The World Bank / www.worldbank.org
[10] Forest area (% of land area) /Food and Agriculture Organization, electronic files and web site. License: CC BY-4.0 / Data / The World Bank / www.worldbank.org
[11] 2016 Annual U.S. & Global Geothermal Power Production Report (PDF) / Geothermal Energy Association / https://www.geo-energy.org/
[12] Municipal waste statistics Updated / Statistics Explained / Eurostat / https://ec.europa.eu/eurostat/statistics-explained/index.php?title=Main_Page
[13] BP Statistical Review of World Energy 2020-2022 (PDF) / BP / www.bp.com
[14] Trends in electricity production – August 2023 / The Green Tank / thegreentank.gr/en/2023/09/26/admie-august2023-en/
[15] Terna Energy / Wind Energy / www.terna-energy.com/activities-en/wind-energy/
[16] National Energy and Climate Plan (PDF) / Ministry of the Environment and Energy / energy.ec.europa.eu/system/files/2020-03/el_final_necp_main_en_0.pdf
The sources of charts and curves are specified under the images.
For more information about the energy industry in Greece see here