
Contents
General State of the Economy
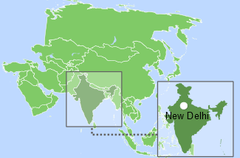
The country is the 3rd largest in the region and 7th largest in the world in terms of area, is home to around 1.4 billion people, as of 2022 (the second largest country in the world in terms of population, after China). In terms of population density, the country is 32nd in the world out of the 248 countries surveyed [1,2,3]. The total length of the country’s coastline is 7 000 km [3].
| India / Republic of India | ||
|---|---|---|
| Capital: New Delhi | Density: 422.2/km2 | Currency: Indian rupee (₹) (INR) |
| Official languages: Hindi, English | Life expectancy at birth: 70.15 years | GDP (PPP): $13.119 trillion (2023 est.) |
| National Day: 15 August | Area: 3,287,263 km2 | GDP - per capita (PPP): $9,183 (2023 est.) |
| Population: 1,428,627,663 (2023 est.) | Coastline: 7,517 km | Internet country code: .in |
Source: [1,2,3.4.5]
The administrative map of India is divided into 29 states and 7 union territories, and the political form of government is a federal parliamentary republic. The official languages are Hindi and English [3]. The economy of India is one of the fastest growing in the world, which is gradually developing into an economy commensurate in terms of its openness, variety of products and volumes of production to the highest developed countries of the world.
| Sources: 1. GDP (purchasing power parity), 2020 est. / The World Factbook/Library/Central Intelligence Agency *228 2. GDP - per capita (PPP), 2020 / The World Factbook/Library/Central Intelligence Agency *229 3. Inflation rate (consumer prices), 2019 est. / The World Factbook/Library/Central Intelligence Agency *228 4. Charges for the use of intellectual property, receipts (BoP, current US$), 2020 / International Monetary Fund, Balance of Payments Statistics Yearbook, and data files. / License: CC BY-4.0 *88 5. The Global Competitiveness Index 2019 / Rankings / Reports / World Economic Forum *141 6. High-technology exports (current US$) 2019-2020 / United Nations, Comtrade database through the WITS platform / License: CCBY-4.0 / Data *134 7. 2021 Index of Economic Freedom / International Economies / The Heritage Foundation *178 8. Reserves of foreign exchange and gold, 2017 est. / The World Factbook / Library / Central Intelligence Agency *195 9. Annual average GDP growth in %, for the last 10 years (2011-2020) / World Bank national accounts data, and OECD National Accounts data files / License: CC BY-4.0 *206 10. Public debt (% of GDP), 2017 est. / The World Factbook / Library / Central Intelligence Agency(from smallest to largest) *210 * Total number of countries participating in ranking Figure 1. Economic Indices of India |
Services and industrial production account for almost two-thirds of GDP in India and around one-third of the labour force and are the main drivers of the country's economic growth. The agricultural sector provides jobs for one third of the able-bodied population and plays an important role in the economic employment of the country’s inhabitants. For a number of indicators, India is among the ten strongest economies in the world, which is reflected in the diagram presented – Figure 1. For five out of ten indices, India places in the top 25% of the leading countries in the world included in the rating. However, for such indicators as GDP per capita, inflation and the index of economic freedom, the country lags far behind the world average.
Since the early 1990s the country has experienced sustained GDP growth at purchasing power parity, both in general and per capita [4,5]. However, GDP at purchasing power parity has decreased slightly over three years for which the most recent data exist from $8.88 trillion in 2018 to $8.44 trillion (3rd in the world) in 2020 [3]. GDP at purchasing power parity per capita is significantly lower (163rd in 2020). The dynamics of this indicator is as follows: from $6 500 in 2018 to $6 100 in 2020 [3]. The inflation rate changed from 3.3% in 2017 to 3.7% in 2019. According to this indicator, the country is 159th in the world out of 227 countries surveyed, ranked from low to high; this indicator is how, however, necessarily a true reflection on the state of a nation’s economy [3].
According to The Global Competitiveness Report 2019, presented by the World Economic Forum, India placed 68th out of a total of 141 countries considered, behind Japan and Taiwan. This rating measures the effectiveness of the use of the country’s own resources for sustainable development. In addition to a number of economic indicators this index also takes into account such variables as education, health, level of innovation, etc. Over the last year the country has lost 1 position in the rating.
In terms of high-technology exports India ranked 22nd in the year 2019-2020, behind Japan and South Korea, but ahead of other emerging economies such as the Russian Federation and Brazil. According to the Index of Economic Freedom in 2021, which takes into account business freedom, freedom from government intervention, protection of property, and freedom from corruption, India was 121st out of 178 countries: a low result. In terms of reserves of foreign exchange and gold at the end of 2017, India was 8th, behind such BRIC countries as China and Russia. According to average GDP growth in percentage over the last 10 years (2011-2020), in 2020 the country was 26th out of 206 countries. In terms of public debt, calculated as a percentage of the country's GDP, India was ranked 48th out of 210 countries considered in 2017.
Energy Resources
India has significant fossil energy resources; the most important being coal. According to proven reserves of oil and natural gas, the country is ranked 23rd and 22nd in the world, respectively [3]. According to data for 2021, in terms of tons of oil equivalent proved coal reserves accounted for 97.6%, natural gas for 1.6%, and oil for 0.8% (Fig. 5). The matrix of unconventional resources looks somewhat different: shale gas accounted for 77.9%, shale oil for 15.9%, and coal mine methane utilization potential for 6.2% (Fig.6).
According to BP [6], as of the end of 2020, the proven oil reserves were 5.3 billion barrels, and according to [3], they were estimated at 4.495 billion barrels in 2018. According to the Indian Central Statistics Office crude oil reserves were estimated at 603.37 million tonnes as of 2020 [7].
Table 1. Fossil energy resources of India
| Resource / Explanations | Crude oil* | Natural gas* | Coal* | Shale Gas** | Tight Oil** | Coal mine methane |
|---|---|---|---|---|---|---|
| Value | 4.605(0.27%) | 47.3(0.65%) | 122 413(10.5%) | 96.4 | 3.8 | 966-2 421 |
| Unit | billion barrels | Tcf | million short tons | Tcf | billion barrels | Bcm |
| Year | 2021 | 2020 | 2021 | 2013 | 2013 | 2018 |
| Source | [19] | [19] | [19] | [12] | [12] | [6,9] |
*share of the country’s reserves in world total is provided in brackets
**unproved technically recoverable
In 2018 proven natural gas reserves in India, according to [3], were 1.29 Tcm. According to [6], the natural gas reserves in the country at the end of 2020 were 1.3 Tcm. According to the Energy Statistics 2021, in March 2020, estimated natural gas reserves in India totalled 1 371.89 Bcm [7].
The main fossil resource in India is coal and the country has the fifth largest coal reserves in the world; in 2020 proved coal reserves were estimated at 111 052 million tons [6]. In the Energy Statistics Report 2021 [7], the estimated coal reserves in the country were estimated at 344.02 billion tons, as on 01.04.2020.
The country has the third largest shale gas reserves in the region, which as of 2013, totalled 96.4 Tcf. Reserves of tight oil were 3.8 billion barrels [8].
According to Advanced Energy Technologies calculations, the methane utilization potential (according to the methodology based on methane emissions from coal mining [9] and its reserves) [6] was 966-2 421 Bcm in 2017. Conventional Oil & Gas, CBM and Shale Gas/Oil Opportunities in India [10], coalbed methane resources in India were estimated at 1.4-2.6 Tcm, while according to the Federal Institute for Geosciences and Natural Resources (BGR) [11] they totalled about 2 300 Bcm in 2014.
India has a variety of renewable sources for energy production. A selection of basic indicators of this type of resource is presented in Table 2.
Table 2. Renewable energy resources of India
| Resource/ Explanations | Solar Potential (DNI)* | Wind Potential (50 м)* | Hydro energy Potential** | Bio Potential (agricultural area) | Bio Potential (forest area) | Geothermal Potenial | Municipal Solid Waste |
|---|---|---|---|---|---|---|---|
| Value | 3.3-4.4 | <5.0 | 2 638 000 | 60.5 | 23.1 | 10 000 | 0.34 |
| Unit | kWh/m2/day | m/s | GWh/year | % of land area | % of land area | GWe | kg/per capita/day |
| Year | 2018 | 2018 | 2013 | 2018 | 2018 | 2010 | 2012 |
| Source | [12] | [13] | [14] | [15] | [16] | [17] | [18] |
*for most of the territory of the country
**economically exploitable potential
The level of direct solar irradiation for the majority of the country is between 3.3-4.4 kWh/m2/day, the maximum level of solar radiation of 5.5 kWh/m2/day can be registered in the north-eastern part of the country, along the Chinese border [12], and in the west of the country.
The distribution of wind resources is as follows: for the majority of the country the wind speed does not exceed 5.0 м/s; along the coast of The Laccadive Sea and in the south of Tamil Nadu state it can reach 7.0-9.0 м/s [13].
Gross theoretical hydro capability of the country was estimated at 2 638 000 GWh/year in 2013 [14], the third largest in the world after China and Brazil, which would allow for the intensive use of hydro resources for electricity production. About 60.5% of India is covered by agricultural land [15], and about 23.1% is forested. This indicator has grown by almost 5% over the last 25 years [16].
According to [17] the potential of geothermal resources of India is 10 GWe — one of the highest in the world, exceeding that of the USA, Iceland and the Philippines; nevertheless geothermal technologies have not received significant implementation in India.
The level of municipal waste generation in India is 0.34 kg per person per day, significantly lower than, for example, in China (1.02 kg per person per day) and in South Korea (1.24 kg per person per day). A small increase of up to 0.7 kg per person per day is predicted by 2025. This resource is a valuable raw material for recycling or energy production. Given the size of the population of India, however, it requires serious legislative, financial and social measures for its development [18].
Energy Balance
According to the Statistical Review of World Energy 2021, primary energy consumption in India in 2020 amounted to 31.98 Exajoules and was dominated by coal – 54.8% , followed by oil – 28.2%, gas – 6.7%, renewables – 4.5% and nuclear power – 1.3% [6].
Using data from [3,6] we calculated an estimated value of GDP per unit of energy use in India in 2017 at $12,5 taking into account the PPP in 2011 (the equivalent of energy contained in one kg of oil), which is higher than regional energy efficiency of GDP. Estimated value of GDP per unit of energy use in Japan is $11.8, in China – $7.4, and South Korea – $6.9 ($/kgoe).
India was the third largest consumer of oil and oil products in the world after the United States and China in 2019 [19].
Oil production between 2001 and 2019 increased by almost 25% reaching a level of 986 thousand barrels/day in 2019 [20].
The volume of oil consumption in the country since 2001 has shown a steady growth (Figure 2) and in 2019 was 4 920 thousand barrels/day [20].
Source: U.S. Energy Information Administration (Sep 2023) / www.eia.gov
Figure 2. The Production and consumption of fossil fuels in India (coal – left, gas – in the center, oil – right)
BP indicated that crude oil production in India in 2020 was at 771 thousand barrels per day and consumption was 4 669 thousand barrels/day [6].
India imported 4.4 million barrels of oil per day in 2019 [19]. The main suppliers of oil to India are Iraq and Saudi Arabia, but Indian authorities are trying to diversify imports and increase the share of imports from countries in Africa, Venezuela, and to increase the volume of oil imports from Iran [19].
Natural gas consumption in India increased rapidly between 2001 and 2010, reaching 2 277 Bcf compared to 851 Bcf in 2001, but then declined to 1 958 Bcf by 2017 [20], rising again to 2 177 in 2020. According to the BP Statistical Review of World Energy 2021 [6] estimated consumption was 59.6 Bcm in 2020.
The production of natural gas in India has been increasing since 2001, reaching 1 848 Bcf in 2010 compared to 851 Bcf in 2001, but had also declined to 979 Bcf by 2020 [20]. According to [6], gas production in the country was 23.8 Bcm in 2020. India imported 23.96 Bcm of natural gas in 2017 [3].
India is the fourth largest importer of LNG in the world – about 1.2 Tcf (7% of global trade) in 2019 [19]. The main suppliers are Qatar, Nigeria, Egypt and Yemen [19].
Sources: U.S. Energy Information Administration (Sep 2023) / www.eia.gov | ||
| Figure 3. Electricity production in India |
India is the third largest producer of coal in the world. Coal consumption in the country gradually grew from 2001 to 2019, totalling 978 million short tons in 2019 [20]; in 2018 according to BP's report consumption amounted to 17.54 Exajoules [6]. Production also grew steadily, reaching 715 million short tons in 2020 [20], and 12.68 Exajoules in 2020 [6]. Historically, India has had a high share of fossil fuels in its electricity production (Fig. 3).
In 2020, according to the U.S. Energy Information Administration, electricity production in the country was 1 452.23 TWh. Production was dominated by fossil fuels – 75.5%. The share of hydropower was 10.7%, the share of renewable resources – 11%, and the share of nuclear energy was 2.8% (Figure 7) [8].
India‘s position in the comparative diagram of energy index is shown in Figure 4. Despite significant fossil energy resources (indices 1,2,3), the production and consumption ratio of these resources is below the world average, which may stimulate the development of renewable energy and the use of energy-saving technologies.
| Sources: 1. Crude oil proved reserves, 2021 / International Energy Statistic/Geography / U.S. Energy Information Administration (Nov 2021)*98 2. Natural gas proved reserves 2021 / International Energy Statistic / Geography / U.S. Energy Information Administration (Nov 2021) *99 3. Total recoverable coal reserves 2019 / International Energy Statistic / Geography / U.S. Energy Information Administration (Nov 2021) *81 4. Combination production-consumption for Crude oil 2018 / International Energy Statistic / Geography / U.S. Energy Information Administration (Nov 2021) *219 5. Combination production-consumption for Natural gas 2019 / International Energy Statistic / Geography / U.S. Energy Information Administration (Nov 2021) *123 6. Combination production-consumption for Coal 2019 / International Energy Statistic / Geography / U.S. Energy Information Administration (Nov 2021) *128 7. Electricity – from other renewable sources (% of total installed capacity), 2017 est. / The World Factbook / Library / Central Intelligence Agency *170 8. GDP per unit of energy use (PPP per unit of oil equivalent), 2020 *66 Primary energy consumption - BP Statistical Review of World Energy 2021/BP;GDP (purchasing power parity) - The World Factbook/Library/Central Intelligence Agency 9. Energy use (primary energy use of oil equivalent per capita) 2020 *127 Primary energy consumption – BP Statistical Review of World Energy 2021; Population - United Nations, Department of Economic and Social Affairs, Population Division (2019). World Population Prospects 2019, custom data acquired via website. Retrieved 15 November 2021*66 10. The Global Energy Architecture Performance Index Report (EAPI) 2017 / Rankings / Reports / World Economic Forum 11. Electric power consumption (kWh per capita), 2016 *217 Electricity Consumption - The World Factbook / Library / Central Intelligence Agency; Population - United Nations, Department of Economic and Social Affairs, Population Division (2019). World Population Prospects 2019, custom data acquired via website. Retrieved 15 November 2021 12. Combination of electricity production-consumption (kWh)/The World Factbook/Library/Central Intelligence Agency *216 * Total number of countries participating in ranking Figure 4. Energy indices of India |
In terms of the share of electricity production from renewable energy sources (excluding hydropower), India is 52nd, out of 170 countries selected for consideration. India is ranked 87th, behind Malaysia but ahead of China, in the EAPI of 2017 (Energy Architecture Performance Index), which is based principally on the level of economic growth, environmental safety, and energy independence of the country, including access to energy. Over the last 8 years the country has gained 4 positions in the rating.
In terms of GDP per unit of energy use, India is 32nd out of 66 countries , but places lower by this indicator per capita – 62nd place. In terms of electricity consumption per capita, the country is 146th in the world, however, for the indicator of combined electricity production-consumption, India is 2nd in the ranked list of 216 countries.
Energy Infrastructure
A territorial map showing the distribution of the largest infrastructure projects of the fossil fuel sector in India is shown in Figure 5. As previously mentioned, the proven reserves of coal account for 97.6%, of the total energy potential of the country's mineral resources, with natural gas reserves accounting for 1.6%, and crude oil reserves for 0.8% (Fig.5).
The main oil and gas fields of India are predominantly in offshore fields. In 2020, oil production from the Mumbai High Oil Field was 170 000 barrels/day [21].
In 2021, Indian refineries had a total installed capacity of 4.619 million barrels/day [22] (Fig. 5). The largest refinery in the country is the Jamnagar I-II complex owned by Reliance Industry Limited, with an installed capacity of 60 million tons per year [23].
India's largest oil terminal is Vopak Terminal Kandla (254 727 m³) [24], and its main oil storage facility is Padur (18.7 million barrels) [25]. As of 2021, crude oil is transported via oil pipelines with a total length of 8 943 km; refined products are transported via pipelines with a total length of 11 069 km; and the liquid petroleum gas pipeline is 2 054 km long (Fig. 5).
Figure 5. Basic infrastructural facilities of the fossil fuel sector in India
The main gas field of the country is the Bassein gas field in the Arabian Sea. The peak production from this field was recorded at 29 million m3 per day in 2010. On the basis of economic assumptions, production will continue until the field reaches its economic limit in 2042 [26].
Gas imports are carried out via 4 LNG terminals, with a capacity of more than 300 000 m3 each, the largest of which is Petronet’s Dahej, with a total capacity of 592 000 m3 [27]. Gas is transported throughout the country via a network of pipelines with a total length of 13 581 km, and 9 km of condensate gas pipeline (Fig. 5).
Extraction of oil and gas on the coastal shelf is also carried out by means of FPSO vessels, the largest of which is Dhirubhai-1 owned by Reliance Industry Limited and operated by Aker Floating Production AS. The installed capacity of FPSO Dhirubhai-1 is 80 000 barrels of liquid per day (bpld) of oil, and 12 million m3 of associated gas, 25% of which is reinjected into oil wells [28].
The infrastructure for natural gas processing is represented by several plants, the largest of which is Hazira with an installed capacity of 42.352 million m3 per day [29].
The largest coal field in India is at Raniganj which produces 33.9 million tons per year [30]. The uranium resources in the country totalled 229 499 tons in July 2017, and uranium mining from the mines in Meghalaya, West Khasi Hills district and the Mawthabah enrichment plant is 340 tU/year [31]. sector in India")
Figure 6. Basic infrastructure facilities of the unconventional fuel sector in India
The proven reserves of shale gas account for 77.9% of the total energy potential of the country's mineral resources, tight oil accounts for 15.9%, and the potential for utilization of coal mine methane for 6.2% (Fig. 6).
The largest reserves of these non-traditional fossil resources are in the Cambay Basin (30 TCF of technically recoverable shale gas, 2.7 billion bbl of technically recoverable shale oil) [32].
Oil India Ltd has discovered heavy oil fields in Baghawala, a sandy desert area in Rajasthan's Barmer district; these reserves are estimated at 130 million tons [33].
In the Indian Ocean and the Arabian Sea area, a number of gas hydrate occurrences have been discovered [34].
India is a large producer of coal mine methane, and the volumes of production are increasing every year. The largest coal mine methane field is Raniganj, and extraction totalled 0.35 million m3/day in 2007 [35].
A map of the territorial distribution of India's largest infrastructure facilities for electricity generation is presented in Figure 7.
Electricity production in India in 2020 was 1 452.23 TWh, and was dominated by fossil fuels – 75.5% (Fig. 7).
The country has a significant number of stations that produce electricity from hydrocarbons, including six oil stations with a capacity of more than 100 MW, six gas-fired power plants with a capacity of more than 1 000 MW, twelve coal-fired power plants with a capacity of more than 3 000 MW, four combined-type plants of 100 MW, and seven nuclear power plants with a capacity of more than 400 MW (Fig. 7).
Figure 7. Electricity production in India
The largest gas power plant is Samalkot, with total capacity of 2 400 MW [36]; the largest oil power plant is GMR Vasavi (Basin Bridge), with installed capacity of 200 MW [37]; the largest combined power plant is NTPC Dadri Combined Power Plant with a capacity of 2 637 MW; the largest coal power plant is Vindhyachal, with installed capacity of 4 760 MW [38]; and the largest nuclear power plant is Kudankulam with a capacity of 2 000 MW [39].
Hydropower in India does not play a pronounced role (10.7% of the total generation) in electricity generation, and is represented by several hydro and pumped storage power plants, which in 2020 produced 155 TWh (Fig. 7). The country's largest hydroelectric power station is Koyna with an installed capacity of 1 960 MW [40]; the largest pumped storage plant is Sardar Sarovar, with an installed capacity of 1 450 megawatts [41]. India has a huge theoretical hydro potential, which requires exploration in terms of technical feasibility and economic feasibility. In addition there were about 1 000 small hydroelectric power stations with a total capacity of 4 506.95 MW registered in India in 2018 (Fig. 7).
In Figure 8, you can see the main facilities of the Indian infrastructure for the production of energy from renewable sources.
As noted above, apart from hydropower, renewable energy in India does not have a significant influence on electricity generation, but is gaining a stronger foothold every year. The total production of electricity from renewable sources in 2019, excluding hydropower, was 126 TWh (Fig. 8).
In the west of India, where there are areas of relatively high wind activity, there are 12 large wind farms with a capacity of more than 140 MW each. As of 2021 India has the 4th largest installed wind power capacity in the world, after China, the U.S. and Germany [42]. The largest of these is Muppandal in Tamil Nadu with an installed capacity of 1 500 MW [43].
As previously mentioned, the level of direct solar radiation in some areas of the country can reach more than 5.5 kWh/m2/day, which is a vast potential resource for energy production. As a result, there is a number of solar energy facilities installed in the area, including 11 photovoltaic stations with a capacity of more than 100 MW each. Three stations convert solar energy into thermal energy through parabolic concentrators (four more similar stations with a total capacity of 275 MW, including three with thermal storage facilities, are under construction) (Fig. 8). There is also a solar thermal power plant using the Dresden-developed Dhursar linear and low-cost concentrators, with a capacity of 125 MW [44], and another, the Dadri ISCC, is under construction and will have a capacity of 14 MW [45].The largest photovoltaic station is the Kurnool Ultra Mega Solar Park with an installed capacity of 1 000 MW [46], the largest parabolic station is Godawari with a capacity of 50 MW [47], and the largest CSP tower power plant is Bikaner, with an installed capacity of 2.5 MW [48]. in India")
Figure 8. Renewable energy in India: wind, solar and hydrogen
India is actively engaged in the production and use of hydrogen as an energy source for vehicles. As of August 2017, there are three large hydrogen filling stations in operation in the country (Figure 8). In India, there are several Compressed Hydrogen Plants, the largest of which is Kochi (184 195 Nm³/hr), owned by Air Products, which started production in 2016 [49].
Figure 9 shows the main bioenergy facilities in India for energy production.
Bioenergy is being actively developed in India and, according to IRENA, the installed capacity of enterprises operating in this energy sector was around 10.53 GW in 2020 (Fig. 9). The country has biomass and municipal waste processing plants, biogas, biodiesel, bioethanol, pellet, and waste gasification and biomass plants. 
Figure 9. Renewable energy in India: bioresources
The country has more than 47 thousand enterprises, including private ones, producing biogas, but most of them are small (Fig.9).
The installed capacity of biomass power plants in India in March 2016 was 5.940 GW. Maharashtra state has the largest number of power plants, with a total installed capacity of 1 122.78 GW [50]. The largest biogas plant is Namakkal with an installed capacity of 2.4 MW, which processes up to 120 000 tons of organic waste per year: mainly chicken manure and sugar industry waste [51].
Radico Khaitan Ltd can produce 125 million litres of ethanol annually at the country's largest enterprise – Rampur Distillery [52]. Pune is a second generation bioethanol production plant managed by Praj Industries and has an installed capacity of 1 million litres of fuel; it uses agricultural waste (straw, cotton stalk, bagasse, cane trash, corn cobs) for processing [53].
In the state of West Bengal near Haldia, Emami Agrotech Limited produces biodiesel at the largest East India Emami Agrotech Biodiesel plant with an installed capacity of 300 tpd [54].
Several enterprises process municipal waste in the country, including 5 enterprises with a capacity of more than 7 MW. In March 2017, the largest WTE Narela-Bawana plant, with an installed capacity of 24 MW, was put into operation and the plant is capable of processing more than 2 000 tons of waste [55]. In addition, there are several waste gasification companies in India, the largest of which is Concord Blue's Pune I with an installed capacity of 10 MW [56]. The Nagpur plasma gasification plant has a capacity of processing up to 30-75 tonnes of hazardous waste per day [57]. There are several biomass gasification plants in the country, the largest is Faridabad, Nuchem Biomass Gasification Plant with an installed capacity of 4 MW [58]. Pellets in India are produced at the Siddaramanagara plant, 60 km south of Bengaluru in southern India (200 000 tons per year) [59] and Dholpur/Gwailor (3 000 mt per month) [60].
According to India’s Draft National Energy Policy, by the year 2022 it is planned to provide 100% of the population with access to electricity, create 100 smart cities (Smart Cities), increase the installed capacity of the renewable energy sector to 175 GW and the share of renewable energy in the production of electricity to 40% by 2030 [61].
One of the most important tasks is to increase the volume of domestic oil production and to this end a decrease in imports of this resource by 10% by 2022 is planned. The government has also approved the construction of 10 new PHWR nuclear reactors, each with a capacity of 700 MW, and an increase in hydropower capacity by 2 GW [62]. The largest projects in India in the field of hydropower are Parbati-II (800 MW) in Himachal Pradesh and Kishanganga HEP (330 MW) in Jammu and Kashmir, owned by the state NHPC [62].
In order to reach these goals, the country is expanding the renewable energy sector. There are three projects under construction in the field of solar energy – Diwakar CSP Parabolic with storage type plant (100 MWe), KVK Energy CSP Parabolic with storage type plant (100 MWe),and Gujarat Solar One CSP Parabolic with storage type plant (25 MWe) [63,64,65]. In 2019 the "hybrid station" project, which combines a solar station and a coal-fired plant, was implemented. The 15 MWh solar station using Fresnel technology was integrated into a 210 MW unit in the Dadri complex, and will produce about 14 GW a year. The plant is located in Uttar Pradesh in the north-west of India, where the direct solar radiation level is 1 169 kWh/m2 per year [66].
Regarding wind power, notable enterprises include ABB India and Gamesa, which are absolute leaders in the wind turbine market. In 2016, ABB India surpassed the mark of 2 000 wind turbines with a total capacity of 4.5 GW delivered to the domestic market of the country [67].
In 2017, Gamesa received an order for the supply of turbines with a total capacity of 278 MW from seven different developers [68].
However, according to the government's statement, the implementation of about 41 projects in the field of hydropower, with a total capacity of 11 792.5 MW, will not be completed by on time. According to official representatives, the reasons for the delay are natural disasters, difficulties with land acquisition and problems relating to law and order [62].
Education and Innovation
According to the Global Innovation Index 2021, India is ranked 46th out of 132 countries (see diagram for links). According to the second and third index, India can be attributed to the number of countries with a sufficiently high level of patent activity. According to the number of patents granted to Indian nationals, both domestically and abroad, the country ranks 17th in the world, behind a number of European countries, but nonetheless higher than the world average. Similarly, by the number of valid patents, the country is above the world average – 23rd place, indicating the country's favourable conditions for innovation.
| Sources: 1. The Global Innovation Index 2021, Rankings / Knowledge / World Intellectual Property Organization / Cornell University, INSEAD, and WIPO (2021): Energizing the World with Innovation. Ithaca, Fontainebleau, and Geneva *132 2. Patent Grants 2011-2020, resident & abroad / Statistical country profiles / World Intellectual Property Organization *185 3.Patents in Force 2020 / Statistical country profiles / World Intellectual Property Organization *109 4. QS World University Rankings 2022 *97 5. SCImago Country Rankings (1996-2020) / Country rankings / SCImago, (n.d.). SIR-SCImago Journal & Country Rank [Portal]. Retrieved 17 Nov 2021 *240 6. Internet users in 2018 / The World Factbook / Central Intelligence Agency *229 7. Internet users in 2018 (% Population) / The World Factbook / Central Intelligence Agency *229 8. Government expenditure on education, total (% of GDP), 2019 / United Nations Educational, Scientific, and Cultural Organization (UNESCO) Institute for Statistics. License: CCBY-4.0 / Data as of September 2021*177 9. Research and development expenditure (% of GDP), 2018 / UNESCO Institute for Statistics. License: CCBY-4.0 / Data *119 10. Scientific and technical journal articles, 2018 / National Science Foundation, Science and Engineering Indicators. License: CCBY-4.0 / Data *197 * Total number of countries participating in ranking Figure 10. The indices of education and innovation in India |
In terms of government expenditure on education, as a percentage of the country's GDP, the country demonstrates a result below the world average – 118th out of 177 countries selected for consideration. Nevertheless, 36 universities in India are included in the QS University Rating. It should also be noted that the country's GDP is high, therefore, in absolute terms, the costs of education and research are, nevertheless, significant. In terms of the amount of government expenditure on research and development, as a percentage of GDP, the country is 44th in the world. India is well positioned when considering the number of publications of specialists in scientific and technological journals and patent activities. India is 7th out of 240 participating countries in the Scimago ranking, and in Scientific and Journal Activities it is ranked 3rd out of 197 countries, China and the USA. The country is also among the leaders in terms of its number of internet users.
Indian universities, such as the University of Delhi, the Indian Institute of Technology Delhi, the Indian School of Mines, and the Indian Institute of Technology Madras train specialists in various fields of energy, including Electrical and Electronics Engineering, Petroleum Geology, Environmental Studies and Geology, etc.
In the field of synthetic fuel production, extraction and processing of unconventional oil, the leaders in patenting among Indian companies are Council of Scientific and Industrial Research (CSIR), Reliance Industries Limited. Research and development in this field is carried out by Indian Institute of Technology, National Institute of Technology, CSIR Indian Institute of Petroleum.
The Council of Scientific and Industrial Research (CSIR) is also actively engaged in research in the field of extraction and processing of unconventional oil. Essar Oil Ltd., the Indian Institute of Technology, and the Indian School of Mines are leading research organizations in the field of coalbed methane.
The leaders among Indian researchers in such an important area as gas hydrates are companies and organizations – the Council of Scientific and Industrial Research (CSIR), the National Geophysical Research Institute, the National Institute of Oceanography, the Oil and Natural Gas Corporation (ONGC); and in the field of hydrocarbon production from reservoirs with low permeability – the Indian School of Mines, the Central Institute of Mining and Fuel Research, and the Indian Institute of Technology at Madras. The leading patent holders in the field of associated gas is the Oil and Natural Gas Corporation (ONGC), and the Indian Institute of Technology Madras is conducting research in this field.
The leading patent holders in the field of bioenergy are Council of Scientific and Industrial Research (CSIR), Nagarjuna Energy Private Limited, Lignoil Technologies Private Limited. Research and development in this field is carried out by Indian Institute of Technology, CSIR Indian Institute of Chemical Technology and others.
A large number of Indian companies patent technical solutions in the field of energy production from renewable sources. In the field of solar energy – the Council of Scientific and Industrial Research (CSIR), Scorpius Trachers Private Limited. Leading research organizations in this field are the Indian Institute of Technology, the National Institute of Technology, the Indian Institute of Technology Bombay, and the Indian Institute of Technology Madras.
Green energy India Private Ltd. are ahead in the number of patents in the field of wind power, and the National Institute of Technology, the Indian Institute of Technology, and Amrita Vishwa Vidyapeetham University conduct research in this area.
Ecology and Environment Protection
The country demonstrates a relatively high level of CO2 emissions in general. In terms of emissions per capita, it is above the average of the 208 countries surveyed, given that India is one of the most densely populated countries. India is at the bottom of the list in terms of methane emissions; this gas is 20 times more hazardous compared to CO2.
| Sources: 1. CO2 total emission by countries 2020 / European Commission / Joint Research Centre (JRC) / Emission Database for Global Atmospheric Research (EDGAR)*208 2. CO2 per capita emission 2020/European Commission/Joint Research Centre (JRC) / Emission Database for Global Atmospheric Research (EDGAR) *208 3. Forest area 2020 (% of land area) / The Global Forest Resources Assessment 2020 / Food and Agriculture Organization of the United Nations *234 4. Forest area change 2010-2020 (1000 ha/year) / The Global Forest Resources Assessment 2020 / Food and Agriculture Organization of the United Nations *234 5. The Environmental Performance Index (EPI) 2020 / Rankings / Yale Center for Environmental Law & Policy / Yale University *180 6. Annual freshwater withdrawals (m3 per capita), 2017 *179 Annual freshwater withdrawals, total (billion m3), 2017 – Food and Agriculture Organization, AQUASTAT data. /License: CC BY-4.0; Population – United Nations, Department of Economic and Social Affairs, Population Division (2019). World Population Prospects 2019, custom data acquired via website. Retrieved 15 November 2021 7. The National Footprint Accounts 2017 (Biocapacity Credit / Deficit) / Global Footprint Network *188 8. Methane emissions (kt of CO2 equivalent), 2018 / Data for up to 1990 are sourced from Carbon Dioxide Information Analysis Center, Environmental Sciences Division, Oak Ridge National Laboratory, Tennessee, United States. Data from 1990 are CAIT data: Climate Watch. 2020. GHG Emissions. Washington, DC: World Resources Institute. Available at: License : Attribution-NonCommercial 4.0 International (CC BY-NC 4.0) *191 9. The Climate Change Performance Index (CCPI) 2022 / Overall Results / Jan Burck, Thea Uhlich, Christoph Bals, Niklas Höhne, Leonardo Nascimento / Germanwatch, NewClimate Institute & Climate Action Network *60 * Total number of countries participating in ranking Figure 11. India‘s environmental indices |
India is regarded as one of the 61 countries responsible for more than 90% of global CO2 emissions related to energy in the Climate Change Performance Index 2022 (CCPI). In this rating India ranked 10th , likely owing to the fact that emissions over the last years have increased; at the same time emissions per capita is still low.
In terms of forest area as a percentage of the country, India is 131st in the world, but, nevertheless demonstrates a positive trend in the forest area change – 3rd in the world.
India has a relatively low rating in the Environmental Performance Index 2020 (EPI), which focuses primarily on assessing the environmental performance of national governments. Here, the country is 168th out of 180 countries surveyed.
References
[1] List of sovereign states and dependencies by area / Wikipedia / https://en.wikipedia.org/wiki/List_of_sovereign_states_and_dependencies_by_area
[2] List of countries and dependencies by population density / Wikipedia / https://en.wikipedia.org/wiki/List_of_countries_and_dependencies_by_population_density
[3] India / The world factbook / Library / Central Intelligence Agency / https://www.cia.gov/
[4] GDP, PPP (constant 2011 international $) / World Bank, International Comparison Program database. License: CC BY-4.0 / Data / The World Bank / http://www.worldbank.org/
[5] GDP per capita, PPP (current international $)/ World Bank, International Comparison Program database. License: CC BY-4.0 / Data / The World Bank / http://www.worldbank.org/
[6] BP Statistical Review of World Energy 2021 (PDF) / BP / https://www.bp.com/
[7] Energy Statistics India 2021 (PDF) / National Statistical Office Ministry of Statistics and Programme Implementation Government of India / www.mospi.gov.in
[8] Shale Gas / U.S. Energy Information Administration (11/28/2018 )/ https://www.eia.gov/
[9]2006 IPCC Guidelines for National Greenhouse Gas Inventories, Volume 2, Energy, Fugitive Emissions (PDF) / The Intergovernmental Panel on Climate Change (IPCC) / www.ipcc-nggip.iges.or.jp
[10] Conventional Oil & Gas, CBM and Shale Gas / Oil Opportunities in India / World Petrocoal / http://worldpetrocoal.com/
[11] BGR (2017) : Energiestusdie 2017. Daten und Entwicklungen der deutschen und globalen Energieversorgung (21).—184S., Hannover. (PDF) / Bundesanstalt für Geowissenschaften und Rohstoffe (BGR) / http://www.bgr.bund.de/
[12] Solar resource data obtained from the Global Solar Atlas, owned by the World Bank Group and provided by Solargis / Global Solar Atlas / http://globalsolaratlas.info/
[13] Wind Map / Global Wind Atlas 2.0, a free, web-based application developed, owned and operated by the Technical University of Denmark (DTU) in partnership with the World Bank Group, utilizing data provided by Vortex, with funding provided by the Energy Sector Management Assistance Program (ESMAP). For additional information: https://globalwindatlas.info
[14] Hydro (PDF) / World Energy Council / https://www.worldenergy.org/
[15] Agricultural land (% of land area) / Food and Agriculture Organization, electronic files and web site. License : CC BY-4.0 / Data / The World Bank / http://www.worldbank.org
[16] Forest area (% of land area) /Food and Agriculture Organization, electronic files and web site. License: CC BY-4.0 / Data / The World Bank / http://www.worldbank.org/
[17] 2016 Annual U.S. & Global Geothermal Power Production Report (PDF) / Geothermal Energy Association / http://geo-energy.org/
[18] What a Waste 2012 / Food and Agriculture Organization, electronic files and web site. License: CC BY-4.0 / Data / The World Bank / http://www.worldbank.org
[19] International Energy Statistic / Geography / U.S. Energy Information Administration / www.eia.gov/beta/international/
[20] Reserves and Capacity / International Energy Statistics / Geography / U.S. Energy Information Administration (January 2020) /http://www.eia.gov/beta/international/
[21] Mumbai High / SubSeaIQ / http://www.subseaiq.com/
[22] OPEC Annual Statistical Bulletin 2017 (PDF)/ Organization of the Petroleum Exporting Countries (OPEC) / http://www.opec.org/
[23] Refineries / Petroleum Planning & Analysis Cell (PPAC) / http://ppac.org.in/
[24] Vopak Terminal Kandla / Terminals / Vopak / http://www.vopak.com/
[25] Gloabl strategic petroleum reserves / Wikipedia / https://en.wikipedia.org/wiki/Global_strategic_petroleum_reserves#India
[26] Bassein Conventional Gas Field, India/ Dec 6, 2021 / Offshore Technology / https://www.offshore-technology.com/
[27] Petronet - Dahej LNG Terminal / Industry About / http://www.industryabout.com/
[28] Dhirubhai-1 / Aker Floating Production AS http://www.akerfloatingproduction.com/
[29] Hazira / Enivronmental Clearance / http://environmentclearance.nic.in/
[30]Eastern Coalfields Raniganj coal mines / Sourcewatch / http://www.sourcewatch.org/
[31] India / World Nuclear Association / http://www.world-nuclear.org/
[32] Technically Recoverable Shale Oil and Shale Gas Resources: An Assessment of 137 Shale Formations in 41 countries outside the United States / U.S. Energy Information Administration (June 2013) / http://www.eia.gov
[33] Oil finds heavy oil deposits in Rajasthan / Indian Express / http://archive.indianexpress.com/
[34] International Gas Hydrate Research (March 2014) (PDF) / U.S. Department of Energy / http://energy.gov/
[35] Hydrocarbon Resoruces Coal Bed Methane (CBM) / National Data Repository / https://www.ndrdgh.gov.in/
[36] Reliance Power synchronises two units of 2,400 MW Samalkot project / The Economic Times / https://economictimes.indiatimes.com/
[37] GMR Vasavi Diesel Power Plant / Wikipedia / https://en.wikipedia.org/wiki/GMR_Vasavi_Diesel_Power_Plant
[38] The top 10 biggest thermal power plants in India / Power Technology / http://www.power-technology.com/
[39] Kudankulam Nuclear Power Plant / Wikipedia / https://en.wikipedia.org/wiki/Kudankulam_Nuclear_Power_Plant
[40] Koyna Hydroelectric Project / Wikipedia / https://en.wikipedia.org/wiki/Koyna_Hydroelectric_Project
[41] Sardar Sarovar Dam / Industry About / http://www.industryabout.com/
[42] Wind power by country / Wikipedia / https://en.wikipedia.org/wiki/Wind_power_by_country
[43] Top 5 largest wind farm and windmill parks in India / Walk Through India / http://www.walkthroughindia.com/
[44] Dhursar / National Renewable Energy Laboratory (NREL) / http://www.nrel.gov/
[45] National Renewable Energy Laboratory (NREL) / Dadri ISCC Plant / http://www.nrel.gov/
[46] Kurnool Ultra Mega Solar Park / Wikipedia / https://en.wikipedia.org/wiki/Kurnool_Ultra_Mega_Solar_Park
[47] Godawari Solar Project / National Renewable Energy Laboratory (NREL) / http://www.nrel.gov/
[48] ACME Solar Tower / National Renewable Energy Laboratory (NREL) / http://www.nrel.gov/
[49] Merchant Hydrogen Plant Capacities in Asia / HYARC / Hydrogen Tools / https://h2tools.org/
[50] Overview of biomass power sector in India / Biomass Knowledge Portal / http://biomasspower.gov.in/
[51] Biogas Waste Plant in Namakkal, India / MabagasGmbh& Co. KG / http://www.mabagas.com/
[52] Distilleries and Units : Rampur Distillery / Radico Khaitan Ltd. / http://www.radicokhaitan.com/
[53] Country’s first bio refinery plant inaugurated in Pune / Affairs Cloud / https://www.affairscloud.com/
[54] Manufacturing Units / Emami Agrotech Ltd. / http://www.emamiagrotech.in/
[55] March launch for biggest waste plant / The Times of India / https://timesofindia.indiatimes.com/
[56] Facilities / Concord Blue Energy / http://www.concordblueenergy.com/
[57] Hazardous Waste management / Plasma / ALTERNRG / http://www.alternrg.com/
[58] Key Indian Players in the Biomass Energy Sector / Energy Alternatives India (EAI) / http://www.eai.in/
[59] Climate Change & Environment / Bioenergy Times / http://www.abelloncleanenergy.com/
[60] About us / 3e Savers India LLP / http://www.biomassbriquettes.net/
[61] Draft National Energy Policy (PDF) / National Institution for Transforming India, Government of India / http://niti.gov.in/
[62] Government Says 41 Hydroelectricity Projects Are Running Behind Time / 31 Jul 2017 / Alternative Energy Stocks / https://www.ndtv.com/
[63] Diwakar / National Renewable Energy Laboratory (NREL) / http://www.nrel.gov/
[64] KVK Energy Solar Project / National Renewable Energy Laboratory (NREL) / http://www.nrel.gov/
[65] Gujarat Solar One / National Renewable Energy Laboratory (NREL) / http://www.nrel.gov/
[66] Fresnel developer builds India supply base to serve 1.7 GW CSP-coal market / 25 Jan 2017 / New Energy Update / http://analysis.newenergyupdate.com/
[67] ABB India reaches 4.5GW milestone in delivering wind power generators made in India / 3 Mar 2017 / Windfair / http://w3.windfair.net/
[68] Gamesa reaffirms its leadership in India with orders for the supply of 278 MW at seven wind developments / 16 Feb 2017/ Gamesa / http://www.gamesacorp.com/
The sources of charts and curves are specified under the images.
For more information about the energy industry in India see here