
Contents
General State of the Economy
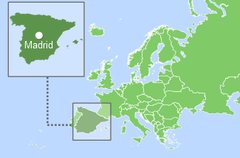
Spain, officially the Kingdom of Spain, is a state in the south-west of Europe, which includes the Canary Islands, the Balearic Islands and other smaller islands among its territory. The country borders Portugal (to the west), France and Andorra (to the north), as well as Morocco to the south across the Alboran sea. The country has access to the Atlantic Ocean and the Mediterranean Sea.
According to 2022 statistics Spain, which in terms of the size of its territory is 54th in the world and 3rd in Europe, is home to around 47 million people. In terms of population density, the country is 121st in the world [1,2,3]. The total length of the country's coastline is 4,964 km [3]. The political form of government is a unitary parliamentary constitutional monarchy and the official language is Spanish. The administrative map of the country is divided into 17 autonomous regions [3].
| Sources: 1. GDP (purchasing power parity), 2020 est. / The World Factbook/Library/Central Intelligence Agency *228 2. GDP - per capita (PPP), 2020 / The World Factbook/Library/Central Intelligence Agency *229 3. Inflation rate (consumer prices), 2019 est. / The World Factbook/Library/Central Intelligence Agency *228 4. Charges for the use of intellectual property, receipts (BoP, current US$), 2020 / International Monetary Fund, Balance of Payments Statistics Yearbook, and data files. / License: CC BY-4.0 *88 5. The Global Competitiveness Index 2019 / Rankings / Reports / World Economic Forum *141 6. High-technology exports (current US$) 2019-2020 / United Nations, Comtrade database through the WITS platform / License: CCBY-4.0 / Data *134 7. 2021 Index of Economic Freedom / International Economies / The Heritage Foundation *178 8. Reserves of foreign exchange and gold, 2017 est. / The World Factbook / Library / Central Intelligence Agency *195 9. Annual average GDP growth in %, for the last 10 years (2011-2020) / World Bank national accounts data, and OECD National Accounts data files / License: CC BY-4.0 *206 10. Public debt (% of GDP), 2017 est. / The World Factbook / Library / Central Intelligence Agency (from smallest to largest) *210 * Total number of countries participating in ranking Figure 1. Economic Indices of Spain |
Spain is a member of the European Union and has a balanced modern market economy, reflected in the diagram presented in Figure 1. By almost all economic indicators the kingdom ranks higher than the world average, in the top quarter of the graph (i.e. among the 25% of the best countries in the world included in the rating).
From the early 1990s until 2008 the country experienced steady growth in GDP at purchasing power parity, both in general and per capita. This growth was halted following the global economic crisis but since 2013 both indicators have demonstrated steady growth [4,5]. GDP at purchasing power parity increased from $1.674 trillion in 2015 to $1.714 trillion (16th place in the world) in 2020 [3]. The country’s GDP at purchasing power parity per capita is lower (53rd place in the world in 2020), but has also been demonstrating negative positive dynamics: from $40,300 in 2018 to $36,200 in 2020 [3].
The level of inflation in Spain changed from – 1.9% in 2017 to 0.7% in 2019 [3].
According to The Global Competitiveness Report 2019, presented by the World Economic Forum, Spain is 23rd out of a total of 141 countries surveyed. Notably, this represents a drop of two places compared to the previous year's rating, and is behind the majority of European countries. This rating evaluates the effectiveness of the use of the country’s own resources for sustainable development. In addition to a number of economic indicators, this index also takes into account such variables as education, health, level of innovation, etc.
In the list of countries that exported high-tech products in 2019-2020, the country was 27th out of 134 countries, ahead of the world average. According to the Index of Economic Freedom 2021, which is based on freedom of business, freedom from government action, property protection, and freedom from corruption, Spain was 41st in 2018 out of the 177 countries considered. In terms of gold reserves and foreign exchange reserves in 2017 Spain was 32nd in the world, in the same group as Denmark, Sweden and Norway.
In terms of average GDP growth in % over the last 10 years, the country was 179th out of 206 countries in 2020, behind France. In terms of public debt, calculated as a percentage of the country's GDP, Spain was ranked 18th out of 210 countries considered in 2017.
Energy Resources
Spain does not possess significant fossil fuel resources (Table 1), especially in comparison with those in the largest producer countries. According to proven reserves of oil and natural gas, the country is 62nd and 96th in the world, respectively [3]. In terms of tons of oil equivalent, according to 2021 data, conventional proved reserves by fuel were 97.3 % – coal, with 2.4% – oil, and 0.3% – gas (Fig.5). The matrix of unconventional fossil resources of 2014-2015 looks somewhat different: shale gas for 77.7%, oil shale for 15.1%, tight oil for 4.8%, and coal mine methane utilization potential for 2.4% (Fig.5). According to [3], as at the beginning of 2021 proven oil reserves were 150 million barrels.
Table 1. Fossil energy resources of Spain
| Resource /Explanations | Crude oil | Natural gas | Coal | Shale Gas* | Tight Oil* | Coal mine methane | Oil Shale |
|---|---|---|---|---|---|---|---|
| Value | 150 | 2.549 | 1,187 | 8.4 | 0.1 | 8.8-22.3 | 280 |
| Unit | million barrels | Bcm | million tonnes | Tcf | billion barrels | Bcm | million barrels |
| Year | 2021 | 2021 | 2020 | 2013 | 2013 | 2018 | 2008 |
| Source | [3] | [3] | [6] | [9] | [9] | [6,8] | [10] |
*unproved technically recoverable
According to [3], proved natural gas reserves in Spain were estimated at 2.549 Bcm, as of 2021.
It should be noted that the consumption of oil and gas in Spain significantly exceeds existing production levels.
According to BP’s 2022 report, coal resources in 2021 were estimated at 1,187 million tons [6], and according to the U.S. Energy Information Administration at 1,308 million short tons in 2021 [7]. According to calculations by www.aenert.com, the methane utilization potential, according to the methodology based on methane emissions from coal production [8] and its reserves from [6], was 8.8 – 22.3 Bcm. Spain has small reserves of shale gas – 8.4 Tcf, tight oil – 0.1 billion barrels and oil shale – 280 million barrels [9,10].
Spain, due to its geographical location, has a variety of renewable resources for energy production. A selection of basic indicators is presented in Table 2.
Table 2.Renewable energy resources of Spain
| Resource/ Explanations | Solar Potential (DNI)* | Wind Potential (50 м)* | Hydro energy Potential** | Bio Potential (agricultural area) | Bio Potential (forest area) | Geothermal Potenial | Municipal Solid Waste |
|---|---|---|---|---|---|---|---|
| Value | 4.1-5.7 | 5.5-6.5 | 162 | 54.1 | 36.8 | 1 922 | 455 |
| Unit | kWh/m2/day | m/s | GWh/year | % of land area | % of land area | MW | kg per capita |
| Year | 2017 | 2017 | 2016 | 2016 | 2016 | 2015 | 2020 |
| Source | [11] | [13] | [14] | [3] | [3] | [18] | [19] |
*for most of the country’s territory
**gross theoretical capability
The level of direct solar radiation in most of the country can reach 4.1-5.7 kWh/m2/day [11]. In Cadiz and the Canary Islands this figure can reach up to 6.0 kWh/m2/day [11]. The average annual duration of daylight sunshine is about 8 hours a day (in the Madrid area) [12], which, coupled with a high level of direct solar radiation, accounts for the intensive development of concentrating solar energy technologies in Spain.
The distribution of wind resources is as follows: in most of the country the wind speed is 5.5-6.5 m/s [13], while along the coast of the North Atlantic, the Lyons Strait, and in the north-west and south-west of the Canary Islands, wind speed can reach 7.5 m/s at a height of 90 metres.
The gross theoretical capability of hydropower in the country is low – 162 GW/year [14]. The wave energy potential along the northern coast of the country can reach 40-60 KW/m per year (Fig.7) [15]. In 2018, 54.1% of the territory of Spain was covered by agricultural land [3]. This area has been steadily decreasing during the last half-century, but forested areas have seen a growth up to 36.8% of the country's territory [3]. The geothermal potential of the country in 2015 was estimated at 1,922 MWe [18].
The level of municipal waste generation in Spain in 2020 was 455 kg per capita, which is lower than in Portugal – (508 kg per capita), and in Italy – (487 kg per capita) [19]. This resource is a valuable raw material for recycling or energy production, both areas having seen extensive technological development in Spain.
Energy Balance
According to the BP Statistical Review of World Energy 2022, total primary energy consumption in Spain in 2021 was 5.59 exajoules, about 43.8% of which was oil, 21.8% – natural gas, 17.3% – renewable energy, 9.1% – nuclear energy, 2.9% – coal, 5% – hydropower [6].
Using the data from [3,6] we calculated Spanish GDP per unit of primary energy use in 2020 to be $14.4 per unit of energy expended (the equivalent of energy contained in one kg of oil equivalent/$ PPP per kg of oil equivalent), which is significantly higher than the world average level of GDP energy efficiency.
Oil production between 2001-2018 slightly grew reaching 78 thousand barrels/day in 2021; in 2018 it was 68 thousand barrels/day [20]. The volume of oil consumption in the country declined from 2007 to 2013 (Fig.2), before showing a gradual increase, reaching 1,297 thousand barrels/day in 2017 and declining again to 1,188 in 2021 [20].
Source: U.S. Energy Information Administration (Dec 2021) / www.eia.gov
Figure 2. The production and consumption of fossil fuels in Spain (coal – left, gas – in the center, oil – right)
To satisfy domestic demand, the country has to import most of its oil and petroleum products, mainly from Mexico, Nigeria, Saudi Arabia, and Russia [22]. In 2018 Spain’s oil imports totalled 1.364 million barrels/day according to [3], and according to [21] imports in 2021 amounted to 56,172 thousand tons.
The consumption of natural gas in the country grew rapidly between 2001-2008, reaching 1,424 Bcf; before declining to 1,131 Bcf in 2020 [20].
The production of natural gas in 2021, according to [21], was 400 GWh, while consumption amounted to 377.157 GWh.
Spain is the seventh largest consumer of gas in Europe; half of the gas consumed is delivered via the Maghreb-Europe pipeline (mainly from Algeria), the second half comes in the form of LNG from Algeria, Qatar and Nigeria [22].
According to [3], Spain imported 32.48 Bcm of natural gas in 2020, with exports of 1.185 Bcm. According to [21], natural gas imports in 2021 were 415.625 GWh.
Coal production in the country has been gradually decreasing since 2007; in 2017 it was 3.06 million short tons, ceasing completely in 2019. Consumption gradually decreased between 2007 to 2020, subsequently showing a slight increase with annual fluctuations; in 2020 it amounted to 3.96 million short tons [20]. According to BP's report in 2021, coal consumption amounted to 0.16 exajoules, while production was zero [6].
| Sources: U.S. Energy Information Administration (Dec 2021) / www.eia.gov | ||
| Figure 3. Electricity production in Spain |
In recent years Spain has been actively using renewable energy sources for the production of electricity (Fig 3). According to the U.S. Energy Information Administration, in 2020 Spain produced 254.12 TWh of electricity. Fossil fuels accounted for 32.5%, renewables for 32.9%, nuclear energy for 22%, and hydropower for 12.6% (Fig.6).
According to Red Eléctrica de España, in 2021 electricity production reached 259.905 GWh, where fossil fuels (including nuclear energy) accounted for 51.6%, and renewables (including hydropower) for 48.4% [23].
Spain’s position in the comparative diagram of energy index is shown in Figure 4. Spain is at the bottom of the list of countries in terms of the production/consumption ratio of fossil fuels, ranked from high to low, and for all major resource components – oil and gas. At the same time, in terms of coal reserves, the country's positioning looks strong.
| Sources: 1. Crude oil proved reserves, 2021 / International Energy Statistic/Geography / U.S. Energy Information Administration (Nov 2021)*98 2. Natural gas proved reserves 2021 / International Energy Statistic / Geography / U.S. Energy Information Administration (Nov 2021) *99 3. Total recoverable coal reserves 2019 / International Energy Statistic / Geography / U.S. Energy Information Administration (Nov 2021) *81 4. Combination production-consumption for Crude oil 2018 / International Energy Statistic / Geography / U.S. Energy Information Administration (Nov 2021) *219 5. Combination production-consumption for Natural gas 2019 / International Energy Statistic / Geography / U.S. Energy Information Administration (Nov 2021) *123 6. Combination production-consumption for Coal 2019 / International Energy Statistic / Geography / U.S. Energy Information Administration (Nov 2021) *128 7. Electricity – from other renewable sources (% of total installed capacity), 2017 est. / The World Factbook / Library / Central Intelligence Agency *170 8. GDP per unit of energy use (PPP per unit of oil equivalent), 2020 *66 Primary energy consumption - BP Statistical Review of World Energy 2021/BP;GDP (purchasing power parity) - The World Factbook/Library/Central Intelligence Agency 9. Energy use (primary energy use of oil equivalent per capita) 2020 *127 Primary energy consumption – BP Statistical Review of World Energy 2021; Population - United Nations, Department of Economic and Social Affairs, Population Division (2019). World Population Prospects 2019, custom data acquired via website. Retrieved 15 November 2021*66 10. The Global Energy Architecture Performance Index Report (EAPI) 2017 / Rankings / Reports / World Economic Forum 11. Electric power consumption (kWh per capita), 2016 *217 Electricity Consumption - The World Factbook / Library / Central Intelligence Agency; Population - United Nations, Department of Economic and Social Affairs, Population Division (2019). World Population Prospects 2019, custom data acquired via website. Retrieved 15 November 2021 12. Combination of electricity production-consumption (kWh)/The World Factbook/Library/Central Intelligence Agency *216 * Total number of countries participating in ranking Figure 4. Energy indices of Spain |
In the list of countries showing levels of electricity production from renewable sources (excluding hydropower), in 2017 Spain was 14th, behind Portugal, and Italy, among 170 countries considered.
In the Energy Architecture Performance Index 2017, which is based on the level of economic growth, environmental safety, access to energy, and energy independence, Spain is in 7th place. It should be noted that during the last 8 years the country has gained 4 ranking positions.
Spain is in the top quarter for such indicators as GDP per unit of energy expended in 2020 – 16th; however, for energy consumption per capita in 2017 Spain is situated slightly lower – 32nd. In terms of electricity consumption per capita, the country is 56th in the world. Spain ranked 24th out of 216 countries considered according to the combination of electricity production-consumption indicator.
Energy Infrastructure
A territorial map showing distribution of the largest infrastructure projects of the fossil-fuel sector in Spain is displayed in Figure 5.
As previously mentioned, coal reserves account for 97.3%, and the share of oil for 2.4%, and natural gas accounted for 0.3% (Fig.5). The main Spanish coal mine, Asturias, is located in the north of the country, produced 1.2 million tons in 2015 [24], but for now, Spain has closed all the coal mines.
The main oil and gas fields in Spain are predominantly offshore. The largest oil field is Ayoluengo, which produced 100-150 barrels per day in 2017 [25]. One of the leading gas fields is La Rioja, which previously produced 300,000 m3 per day, but who’s levels of production had declined to 80,000 m3 by 2017[26].
The installed capacity of oil refineries in Spain in 2016 was 1,427.5 thousand barrels/day [27]. The largest refinery, Gibraltar San Roque, is owned by CEPSA with an installed capacity of 240,000 barrels/day [28] (Fig. 5).
One of the main oil terminals in Spain is A Coruna, and the largest oil storage is Barcelona Meroil (650,000 m3) [29,30]. Transportation of crude oil and petroleum products is carried out via pipelines with a length of 616 km and 3,461 km, respectively (Fig. 5).
Figure 5. Basic infrastrucural facilities of the fossil fuel sector in Spain
The Spanish gas system consists of the Viura gas processing plant with an installed capacity that ranges from 200,000 to 1 million Nm3/d [31] and four gas storage facilities [32]. Gas is transported within the country via a network of pipelines with a total length of 10,481 km (Fig.5).
Gas imports are carried through seven LNG terminals, the largest of these is the Barcelona Enagas LNG Terminal, with an installed capacity of 17.1 Bcm (N)/y [33].
There are two gasification plants in the country: Cartagena Syngas Plant (22 MWth), which uses natural gas as feedstock; and the Puertollano IGCC Plant (335 MWth), which can process coal and petroleum coke [34,35].
As noted above, the Cantabrian field may contain 8.4 Tcf of technically recoverable shale gas and 0.1 billion barrels of tight oil as of 2013 [8,36,37]. Clusters of natural gas hydrates were found in the north, south-east and south-west of Spain [38].
A territorial map showing the distribution of the largest infrastructure facilities for electricity generation in Spain is shown in Figure 6.
The share of fossil fuels in electricity generation in Spain in 2020, was about 32.5% (Fig. 6).
The country has a significant number of stations for the production of electricity from hydrocarbons, including six oil, eleven gas, ten coal and five nuclear stations with a capacity of more than 100 MW (Fig.6).
The largest Spanish power plants are: the complex of gas stations Besos 3, 4, 5, with a total installed capacity of 1,660 MW [39,40]; Granadilla oil power plant, with a capacity of 797.4 MW; As Pontes (Puentes de Garcia Rodrigues) coal power plant, with an installed capacity of 1,468.5 MW; and Almaraz nuclear power plant, with an installed capacity of 2,093.9 MW [41,42,43].
Figure 6. Electricity production in Spain
Hydropower in Spain accounts for 12.6% of electricity generation, and is represented by both pumped storage plants and large and small hydropower plants (Fig. 6). The largest pumping station is Cortes-La Muela, with an installed capacity of 2,000 MW. The main hydroelectric power plant is Alcantara (Jose Maria de Oriol), with an installed capacity of 916 MW [44,45].
In Spain in 2016, there were 1,091 small hydropower stations, with a total installed capacity of 2,104 MW [46]. In 2011, a tidal power plant Mutriku with an installed capacity of 300 kW began operation in Spain [47].
Figure 7 shows the main infrastructure facilities in Spain for the production of renewable energy.
As noted above, renewable energy in Spain accounts for 32.9% of electricity generation. The total production of electricity from renewable sources excluding hydropower was 83.6 TWh in 2020 (Fig. 7).
In 2021, Spain had 28,139 MW total installed capacity of wind power. The regions with the highest cumulative wind capacity at the end of 2021 were Castilla y León, Aragón, Castilla La Mancha and Galicia [48]. The largest is the Maranchon Wind Park with an installed capacity of 208 MW [49]. Spanish-German manufacturer Siemens Gamesa the world's second producer of wind turbines, generating over 122GW of wind power all over the world as of 2022, whereby 15 GW of wind energy is installed across Spain [50].
As noted above, the level of direct solar radiation in some parts of the country can reach 8 kWh/m2, which is an excellent resource for energy production [13]. In addition, Spain, especially the southern part of the country, has a large number of cloudless sunny days. As a consequence, numerous solar energy facilities, both photovoltaic type and thermal type with solar energy concentrators, are located in this territory. These include two CSP tower stations – Planta Solar 10 & 20 (31.0 MW) and Gemasolar (19.9 MW) [52,53,54] and the two largest CSP stations complexes, Andasol 1-3 and Extresol 1-3, which use tanks of molten salt as thermal energy storage, and have a capacity of 150 MW each and are capable of operating for long periods without any interruptions [55,56]. The largest parabolic solar station is Extremadura Solaben, with an installed capacity of 200 MW [57], and the largest photovoltaic station is Olmedilla de Alarcon Solar, with a capacity of 60 MW [58]. About 3% of the electricity in Spain is produced by photovoltaic stations. Spain is the global leader in the total capacity of CSP stations (mainly parabolic), exceeding 2,300 MW. It should be noted however, that in recent years new capacities have not been commissioned, which may be due to problems with government support, as well as the financial problems of the Spanish renewable energy leader, Abengoa Solar. Spain is also the world leader in the development of technologies for the thermal storage of solar energy using salt solutions, with around a 60% share of all thermal storages globally. In 2015, CSP stations in Spain produced 2.3 TWh of electricity (nearly 5% of total electricity generated from renewable sources). in Spain")
Figure 7. Renewable energy in Spain: wind, solar, marine, hydrogen
In the north of Spain in the Bay of Biscay, there are substantial natural resources for the development of wave and tidal energy technology. In 2012, Voith Hydro Wavegen put into operation one of the first stations of this type – Mutriku, with a capacity of 300 MW [59], converting the energy of waves into electricity. Magallanes Renovables SL (MRSL) plans to develop tidal stations in Galicia [60].
Spain is active in developing hydrogen as an energy source for vehicles. As of November 2017, there are about 4 hydrogen filling stations in operation in the country (Figure 7). There are also several plants producing hydrogen, including the largest one in Tarragona, owned by Air Products, with an installed capacity of 66,980 Nm3/hr [61].
Figure 8 shows the main bioenergy facilities in Spain for energy production.
Bioenergy is actively developing in Spain and in 2020 the installed capacity of bioenergy was 1.13 GWe (1.9%) (Fig.8). The country has biomass and municipal waste processing plants; biogas, biodiesel, bioethanol, pellet and landfill gas production.
Plants for the production of energy from biomass, as well as the production of biodiesel have become widespread in Spain. Ence is the operator of the largest biomass power plant, Navia, with an installed capacity of 77 MW [62]. The main enterprise of Spain in the field of production of biomass fuels is Castellon, with an annual production capacity of between 300,000-600,000 tons of biodiesel [63].
Spain is actively engaged in the production of bioethanol, and Babilafuente (Castilla y León) managed by Abengoa Bioenergia, produces 158 000 mt annually [64]. Second generation bioethanol from cellulose is produced at the largest plant, PERSEO, which has an installed capacity of 14,300 t/y. The production of biodiesel from algae is carried out at the All Gas demonstration plant with an installed capacity of 1,000 tons per year [65].
Other notable facilities include: the Enamora CHP biomass gasification plant, with a capacity of 750 KW [66]; A Coruna, which was producing about 70,000 tons of pellets per year in 2012 [67]; and Caparroso, with an installed capacity of 2.9 MW [68]. The latter is the largest plant for the processing of agricultural waste and manure.
The leader in the generation of electricity from municipal waste is Sogama, with an installed capacity of 49 MW [69]. Additionally, the Urnieta (San Sebastian) torrefaction plant produces about 20,000 tons of bio-coal per year [70] and Valdemin gómez (Madrid) Landfill Gas-to-Energy Plant generates about 18.9 MW of electricity from landfill gas [71].
Figure 8. Renewable energy in Spain: bioenergy
The National Energy Efficiency Action Plan for 2014-2020 aimed to support sustainable development and ensure energy supply, to achieve further economic growth and competitiveness of the economy, while reducing the impact of production, transformation and end-use of energy on the environment [72]. The current energy strategy up to 2030 includes the following objectives: 23% reduction in greenhouse gas emissions from 1990 levels, 42% share of renewables in energy end use, 39.5% improvement in energy efficiency, and 74% share of renewables in electricity generation. [73].
Spain plans to increase wind power capacity by 17,000 MW by 2030, bringing the total capacity to 40,000 megawatts, bringing the share of wind energy in electricity production to more than 30%: in 2017 this figure was 18.2%. In the future, it is planned to increase the share of wind energy to 92% by 2040 and complete transition to wind energy by 2050 [74].
In the field of solar energy two notable large facilities are under construction. The solar photovoltaic park in Talaván (Cáceres) will occupy an area of 511 hectares and produce about 300 megawatts of energy, the cost of investment may amount to more than 300 million euros [75]. The second, Mula, with a capacity of 450 MW, will be one of the largest solar parks not only in Spain, but in all Europe, and will occupy a territory of 900 hectares with a total cost of 450 million euros [76].
In March 2017, Grupo Ence announced the commencement of construction of a new plant in Huelva, that will use biomass fuel and have an installed capacity of 50 MW [77].
By 2025, it is planned to add 38 additional hydrogen filling stations [78].
At the biogas plant Ecoparc 2 in Barcelona, owned by AMB, and under the management of FCC Medio Ambiente, MethaMorphosis technology is being tested to increase the production of biogas from leachate resulting from the treatment of municipal waste by changing the treatment methods. This technology will achieve a high level of efficiency while simultaneously reducing greenhouse gas emissions by 70% and CO2 emissions by 80% compared to conventional systems [79].
Education and Innovation
The set of indices reflecting the position of Spain relative to other countries in the field of education and innovation can be seen in Figure 9.
Spain placed 30th out of 132 countries considered in the Global Innovation Index 2021 (see diagram). According to the number of patents granted to Spanish residents, both inside the country and abroad, the country ranks 20th in the world. Similarly, by the number of patents in force, the country is 11th in the world, indicating the country's favorable conditions for innovation.
In terms of government expenditure on education as a percentage of the country's GDP, the country demonstrates a result close to the world average – 82nd out of 177 countries selected for consideration. Nevertheless, 29 Spanish universities are included in the QS University Rating of the world leading universities. It should also be noted that the country's GDP is high, therefore, in absolute terms, the government’s expenditure on education is significant.
| Sources: 1. The Global Innovation Index 2021, Rankings / Knowledge / World Intellectual Property Organization / Cornell University, INSEAD, and WIPO (2021): Energizing the World with Innovation. Ithaca, Fontainebleau, and Geneva *132 2. Patent Grants 2011-2020, resident & abroad / Statistical country profiles / World Intellectual Property Organization *185 3.Patents in Force 2020 / Statistical country profiles / World Intellectual Property Organization *109 4. QS World University Rankings 2022 *97 5. SCImago Country Rankings (1996-2020) / Country rankings / SCImago, (n.d.). SIR-SCImago Journal & Country Rank [Portal]. Retrieved 17 Nov 2021 *240 6. Internet users in 2018 / The World Factbook / Central Intelligence Agency *229 7. Internet users in 2018 (% Population) / The World Factbook / Central Intelligence Agency *229 8. Government expenditure on education, total (% of GDP), 2019 / United Nations Educational, Scientific, and Cultural Organization (UNESCO) Institute for Statistics. License: CCBY-4.0 / Data as of September 2021*177 9. Research and development expenditure (% of GDP), 2018 / UNESCO Institute for Statistics. License: CCBY-4.0 / Data *119 10. Scientific and technical journal articles, 2018 / National Science Foundation, Science and Engineering Indicators. License: CCBY-4.0 / Data *197 * Total number of countries participating in ranking Figure 9. The indices of education and innovation in Spain |
In terms of public expenditure on research and development as a percentage of GDP, Spain is 29th, ahead of a number of European countries, but behind Italy and Portugal. Spain is very well positioned in terms of the number of publications of specialist scientific and technological journals and patent activities. Spain is 11th out of 240 participating countries in the Scimago ranking, and in Scientific and Technical Journal Activities is ranked 13th out of 197 countries. The country is also among the leaders in the region in terms of the number of Internet users.
Spanish Universities, such as the Autonomous University of Barcelona, the University of Barcelona, the University of Navarra, the Technical University of Madrid, and the Polytechnic University of Valencia train specialists in various fields of energy, including Environmental Engineering, Hydraulic Engineering and Environment, Civil Engineering, Chemical Engineering, Energy Engineering, Mechanical Engineering, etc.
In the field of synthetic fuel production, leaders in patenting among Spanish companies are Guradoor, S.L. and the Fundacio Institut Catala D’investigacio Quimica (Iciq). Research and development in this field is carried out by the Instituto de Catalisis y Petroleoquimica, the University of the Basque Country (UPV/EHU), and Unversidad de Castilla-La Mancha.
Universidad de Granada, Universitat Autonoma de Barcelona (UAB) are actively engaged in research in the field of gas hydrates.
The leading patent holders in the field of bioenergy are Universidad Politecnica de Madrid, Guradoor, S.L. , Soluciones Extractivas Alimentarias SL, Endesa Generacion S A. Unversidad de Salamanca, Centro de Investigaciones Energeticas Medioambientales y Tecnologicas (CIEMAT), University of the Basque Country (UPV/EHU) are conducting research in this area.
A large number of Spanish companies patent technical solutions in the field of energy production from renewable sources. In the field of solar energy Abengoa Solar New Technologies, S.A. , Universidad Politecnica de Madrid, Riogass Solar, S.A. , SENER Ingenieria y Sistemas S.A. rank prominently in terms of patent activity. Leading research organizations in this field are Centro de Investigationes Energeticas Medioambientales y Tecnologicas (CIEMAT), Universidad Politecnica de Madrid, Platforma Solar de Almeria, and the IMDEA Energy Institute. Gamsea Innovation and Technology S.L. , Alstom Wind S.L.U., Alstom Renovables Espana S.L. , Acciona Windpower S.A. have the largest number of patents in the field of wind power; research in this field is being conducted by Universidad Politecnica de Catalune (UPC), Universidade de Coruna, Catalonia Institute for Energy Research (IREC), and the University of Santiago de Compostela.
Ecology and Environment Protection
The diagram of environmental indices presented in Figure 10, alludes to the negative ecological situation in Spain.
First of all, the country demonstrates a relatively high level of CO2 emissions both in general, and per capita. Nevertheless, in 2014, the level of CO2 emissions resulting from coal mining and processing amounted to 11 mt, which is much less than, for example, in Poland – 129 mt and Germany – 256 mt [80]. On average, the cost of mitigating the consequences of this kind of emission costs Spain more than 869 million euros (health costs, pollution costs). For comparison in Austria this figure was 19 million euros, in Belgium - 29 million euros, and in the Czech Republic – 1,452 million euros [80]. It is also necessary to note a relatively high level of methane emissions in Spain. Spain is 31th of the 61 countries responsible for more than 90% of global CO2 emissions related to energy in the Climate Change Performance Index (CCPI) 2021; its rating is categorized as "low".
| Sources: 1. CO2 total emission by countries 2020 / European Commission / Joint Research Centre (JRC) / Emission Database for Global Atmospheric Research (EDGAR)*208 2. CO2 per capita emission 2020/European Commission/Joint Research Centre (JRC) / Emission Database for Global Atmospheric Research (EDGAR) *208 3. Forest area 2020 (% of land area) / The Global Forest Resources Assessment 2020 / Food and Agriculture Organization of the United Nations *234 4. Forest area change 2010-2020 (1000 ha/year) / The Global Forest Resources Assessment 2020 / Food and Agriculture Organization of the United Nations *234 5. The Environmental Performance Index (EPI) 2020 / Rankings / Yale Center for Environmental Law & Policy / Yale University *180 6. Annual freshwater withdrawals (m3 per capita), 2017 *179 Annual freshwater withdrawals, total (billion m3), 2017 – Food and Agriculture Organization, AQUASTAT data. /License: CC BY-4.0; Population – United Nations, Department of Economic and Social Affairs, Population Division (2019). World Population Prospects 2019, custom data acquired via website. Retrieved 15 November 2021 7. The National Footprint Accounts 2017 (Biocapacity Credit / Deficit) / Global Footprint Network *188 8. Methane emissions (kt of CO2 equivalent), 2018 / Data for up to 1990 are sourced from Carbon Dioxide Information Analysis Center, Environmental Sciences Division, Oak Ridge National Laboratory, Tennessee, United States. Data from 1990 are CAIT data: Climate Watch. 2020. GHG Emissions. Washington, DC: World Resources Institute. Available at: License : Attribution-NonCommercial 4.0 International (CC BY-NC 4.0) *191 9. The Climate Change Performance Index (CCPI) 2022 / Overall Results / Jan Burck, Thea Uhlich, Christoph Bals, Niklas Höhne, Leonardo Nascimento / Germanwatch, NewClimate Institute & Climate Action Network *60 * Total number of countries participating in ranking Figure 10. Environmental Indices of Spain |
In terms of forest area as a percentage of the country, Spain was 93rd in the world in 2020; however, between 2010-2020 there was a trend towards reforestation and according to this indicator the country is 48th in the world.
The situation is brightened by a very high valuation of Spain in the Environmental Performance Index rankings (EPI) 2020, which focuses primarily on assessing the environmental performance of national governments. Here, the country is 14th out of 180 countries, behind Finland, Sweden, Denmark and Switzerland.
However, according to the Environmental Vulnerability Index, which is based on long term observations and 50 indicators that include, for example, changing climatic characteristics or the quality of water resources, waste volumes, oil spills and other hazardous substances, etc. Spain is 183rd out of 234 countries, and is characterized as "extremely vulnerable". The overall negative picture is aggravated by the Ecological Footprint Atlas rating, according to which Spain is among a number of ecological debtors.
References
[1] List of sovereign states and dependencies by area / Wikipedia / en.wikipedia.org/wiki/List_of_sovereign_states_and_dependencies_by_area
[2] List of countries and dependencies by population density / Wikipedia / en.wikipedia.org/wiki/List_of_countries_and_dependencies_by_population_density
[3] Spain / The world factbook / Library / Central Intelligence Agency / www.cia.gov
[4] GDP, PPP (constant 2011 international $) / World Bank, International Comparison Program database. License: CC BY-4.0 / Data / The World Bank / www.worldbank.org
[5] GDP per capita, PPP (current international $)/ World Bank, International Comparison Program database. License: CC BY-4.0 / Data / The World Bank / www.worldbank.org
[6] BP Statistical Review of World Energy 2019-2022 (PDF) / BP / www.bp.com
[7] Coal reserves / International Energy Statistic / Geography / U.S. Energy Information Administration (Dec 2018) / www.eia.gov/beta/international/
[8] 2006 IPCC Guidelines for National Greenhouse Gas Inventories, Volume 2, Energy, Fugitive Emissions (PDF) / The Intergovernmental Panel on Climate Change (IPCC) / www.ipcc-nggip.iges.or.jp
[9] World Shale Resource Assessments (PDF)/ U.S. Energy Information Administration (11/28/2018 )/ www.eia.gov
[10] 2010 Survey of Energy Resources (PDF) / World Energy Council / www.worldenergy.org
[11] Solar resource data obtained from the Global Solar Atlas, owned by the World Bank Group and provided by Solargis / Global Solar Athlas / globalsolaratlas.info
[12] Clima Temps / www.madrid.climatemps.com
[13] Wind Map / Global Wind Atlas 2.0, a free, web-based application developed, owned and operated by the Technical University of Denmark (DTU) in partnership with the World Bank Group, utilizing data provided by Vortex, with funding provided by the Energy Sector Management Assistance Program (ESMAP). For additional information: globalwindatlas.info
[14] Hydro (PDF) / World Energy Council / www.worldenergy.org
[15] Wave Power / Wikipedia / en.wikipedia.org/wiki/Wave_power
[16] Agricultural land (% of land area) / Food and Agriculture Organization, electronic files and web site. License : CC BY-4.0 / Data / The World Bank / www.worldbank.org
[17] Forest area (% of land area) /Food and Agriculture Organization, electronic files and web site.License : CC BY-4.0 / Data / The World Bank / www.worldbank.org
[18] 2016 Annual U.S. & Global Geothermal Power Production Report / geoenergy.org
[19] Municipal waste statistics Updated / 19 July 2018 / Full list / Statistics Explained / Eurostat / ec.europa.eu
[20] International Energy Statistic / Geography / U.S. Energy Information Administration (Jan 2020) / www.eia.gov/beta/international/
[21] Informe Estadistico Annual 2021/ CORES / www.cores.es
[22] Spain / Geography / U.S. Energy Information Administration / www.eia.gov/beta/international/
[23] EL SISTEMA ELÉCTRICO ESPAÑOL 2021 (PDF) / Red Eléctrica de España / www.ree.es
[24] Hard Coal / Spain / EURACOAL / euracoal.eu
[25] El único yacimiento de petróleo de la España peninsular, a punto de desaparecer / 30/01/2017 SER / cadenaser.com
[26] Unión Fenosa desviará el punto de extracción del gas en Sotés para remontar la producción / 23/06/2017 / La Rioja / www.larioja.com
[27] OPEC Annual Statistical Bulletin 2017 (PDF) / Organization of the Petroleum Exporting Countries (OPEC) / www.opec.org
[28] Annual Report 2016 (PDF) / Compañía Española de Petróleos (CEPSA)/ www.cepsa.com
[29] Port of A Coruna / World Port Service / www.worldportsource.com
[30] Europetrole / www.euro-petrole.com
[31] Gas processing plant Viura / Viura / www.streicher-perspektiven.de
[32] Spain Natural Gas Storage/ Storage Map: Information by point / Gas Infrastructure Europe (GIE) / www.gie.eu
[33] Spain LNG Terminals / Storage Map: Information by point / Gas Infrastructure Europe (GIE) / www.gie.eu
[34] Gasification / National Energy Technology Laboratory / www.netl.doe.gov
[35] Puertollano IGCC Power Plant Spain / Global Energy Observatory / globalenergyobservatory.org
[36] France shale gas potential basins / The Economist / www.economist.com
[37] Technically Recoverable Shale Oil and Shale Gas Resources: Spain / U.S. Energy Information Administration (September 2015) / www.eia.gov
[38] Gas hydrate distribution Europe / Migrate Marine Gas Hydrate / www.migrate-cost.eu
[39] Besos power station / Wikipedia / es.wikipedia.org/wiki/Central_de_ciclo_combinado_del_Bes%C3%B3s
[40] Besos power station / Wikipedia / en.wikipedia.org/wiki/Bes%C3%B3s_V_power_station
[41] Central termica de Granadilla /Wikipedia / es.wikipedia.org/wiki/Central_t%C3%A9rmica_de_Granadilla
[42] CT As Pontes / Endesa Educa / www.endesaeduca.com
[43] Almaraz Nuclear Power Plant / Wikipedia / en.wikipedia.org/wiki/Almaraz_Nuclear_Power_Plant
[44] HRH The Prince of Asturias and Iberdrola chairman dedicate Cortes-La Muela Pumped-Storage Scheme in Valencia (Spain)"/ Iberdrola S.A. / www.iberdrola.com
[45] La central hidroelectrica Jose Maria De Oriol, un de las mas grandes de Espana / Iberdola / www.iberdrola.com
[46] Small hydropower sector overview and potential (PDF)/ Small Hydropower World / www.smallhydroworld.org
[47] Mutriku Breakwater Wave Plant / Wikipedia / en.wikipedia.org/wiki/Mutriku_Breakwater_Wave_Plant
[48] Wind Energy in Spain / AEE / https://aeeolica.org/en/
[49] View from Wind Turbine / Greenpeace / media.greenpeace.org
[50] Siemens Gamesa. Wind Turbines and Services / Siemens Gamesa / https://www.siemensgamesa.com/en-int
[51] Spain / Gamesa Corporation / www.gamesacorp.com
[52] Planta Solar 10 / Wikipedia / en.wikipedia.org/wiki/PS10_solar_power_plant
[53] Planta Solar 20 / Wikipedia / en.wikipedia.org/wiki/PS20_solar_power_plant
[54] GemasolarThermosolar Plant / Wikipedia / en.wikipedia.org/wiki/Gemasolar_Thermosolar_Plant
[55] Andasol Solar Power Station / Wikipedia / en.wikipedia.org/wiki/Andasol_Solar_Power_Station
[56] Extresol Solar Power Station/ Wikipedia / en.wikipedia.org/wiki/Extresol_Solar_Power_Station
[57] Extremadura Solar Complex / Power Technology / www.power-technology.com
[58] Map of Largest Operating European PV Plant Locations from 2007 to 2011 (PDF)/ PV Insider / www.pv-insider.com/map.pdf
[59] Voith Hydro's Mutriku wave energy project earns honors / Hydro World.com / www.hydroworld.com
[60] Spain enters commercialization of tidal energy with US$1.2 million ATIR prototype / Hydro World.com / www.hydroworld.com
[61] Merchant Hydrogen Production Capacities in Europe/ Hydrogen Tools / h2tools.org
[62] Navia / Ence / www.ence.es
[63] Large Industrial Biomass Users (PDF) / IEA Bioenergy Task 40 / www.bioenergytrade.org
[64] Spain’s Bioethanol Standing Report, 2012 (PDF)/ USDA’S Global Agricultural Information Network / gain.fas.usda.gov
[65] Liste des principales unites de production de biocarburants avances en Europe. Juin 2013 / ValBiom / www.valbiom.be
[66] BioProm – BioEnergy Promotion Publishable result-oriented Report January 2005 – June 2007 (PDF)/ European Comission / ec.europa.eu
[67] El mercado del pellet en Espana se consolida en 2012 / Bioenergy International Edicion Espanol /
issuu.com/avebiom/docs/_bie_19_web
[68] La planta de biogas de Caparroso se ampliara con otras actividades / Diario de Navarra / www.diariodenavarra.es
[69] Sogama - Cerceda Incineration Plant / Industry About / www.industryabout.com
[70] Still more future hope than reality / Sun&Wind Energy/ www.sunwindenergy.com
[71] Case Study: Valdemingomez Landfill Site, Madrid, Spain / GE Power & Water Distributed Power / www.ge-distributedpower.com
[72] Spain 2014–2020 NATIONAL ENERGY EFFICIENCY ACTION PLAN / European Commission / ec.europa.eu
[73] Energy Policies of IEA Countries 2021 Review Spain / International Energy Agency /©OECD/IEA 2018, IEA Publishing, Licence: www.iea.org/t&c/ www.iea.org
[74] La eólica española prevé suministrar más de un 30% de la electricidad en 2030 con una potencia de 40.000 MW/ 17 Nov 2017/Spanish wind plans to supply more than 30% of electricity in 2030 with a power of 40,000 MW / El Periódico de la Energía / elperiodicodelaenergia.com
[75] El Gobiernoautorizauna planta fotovoltaica de 300 MW enCáceres/26 Jun 2017/The Government authorizes a 300 MW photovoltaic plant in Cáceres / El Periódico de la Energía / elperiodicodelaenergia.com
[76] La CNMC da el vistobueno al megaproyectofotovoltaico de Mula (Murcia) / El Periódico de la Energía / elperiodicodelaenergia.com
[77] Ence inicia los trabajos para la construcción de una nueva planta de biomasa de 50 MW en Huelva/08 Mar 2017/Ence begins work on the construction of a new 50 MW biomass plant in Huelva / El Periódico de la Energía/ elperiodicodelaenergia.com
[78] Spain: Naturgy plans to build 38 Hydrogen Stations by 2025 / 11 February 2011 / fuelcellsworks.com
[79] New system to increase efficiency of biogas production in waste treatment plants demonstrated/27 Jun 2017/ Bioenergy Insight / www.bioenergy-news.com
[80] Coal is a climate problem - European Coal Map (PDF) / www.coalmap.eu
The sources of charts and curves are specified under the images.
For more information about the energy industry in Spain see here