
Contents
General State of the Economy
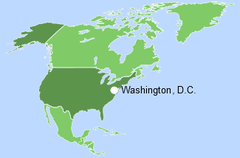
The United States of America, is a country in North America. Its capital city is Washington DC. The country has borders with Canada (to the north) and Mexico (to the south), and a maritime border with Russia. The United States has access to the Pacific, Atlantic and Arctic oceans.
The U.S. is the 4th largest country in the world, and is home to more than 337 million people, as of 2022. In terms of population density the country is 185th in the world from 248 countries considered [1,2,3]. The total length of the country's coastline is 19 924 km [3].
| the United States | ||
|---|---|---|
| Capital: Washington, D.C. | Density: 33.6/km2 | Currency: United States ($) |
| Official languages: English | Life expectancy at birth: 77.28 years | GDP (PPP): $26.855 trillion (2023 est.) |
| National Day: 04 July | Area: 9,833,520 km2 | GDP - per capita (PPP): $80,035 (2023 est.) |
| Population: 333,287,557 (2022 est.) | Coastline: 20,083 km | Internet country code: .us |
Source: [1,2,3,4,5]
The United States is the largest highly developed economy in the world [3], which is reflected in Figure 1. By almost all indices the US places in the top quarter of the graph, among the top 25% countries in the world included in the rating. For almost half the indicators the US occupies the top position.
| Sources: 1. GDP (purchasing power parity), 2020 est. / The World Factbook/Library/Central Intelligence Agency *228 2. GDP - per capita (PPP), 2020 / The World Factbook/Library/Central Intelligence Agency *229 3. Inflation rate (consumer prices), 2019 est. / The World Factbook/Library/Central Intelligence Agency *228 4. Charges for the use of intellectual property, receipts (BoP, current US$), 2020 / International Monetary Fund, Balance of Payments Statistics Yearbook, and data files. / License: CC BY-4.0 *88 5. The Global Competitiveness Index 2019 / Rankings / Reports / World Economic Forum *141 6. High-technology exports (current US$) 2019-2020 / United Nations, Comtrade database through the WITS platform / License: CCBY-4.0 / Data *134 7. 2021 Index of Economic Freedom / International Economies / The Heritage Foundation *178 8. Reserves of foreign exchange and gold, 2017 est. / The World Factbook / Library / Central Intelligence Agency *195 9. Annual average GDP growth in %, for the last 10 years (2011-2020) / World Bank national accounts data, and OECD National Accounts data files / License: CC BY-4.0 *206 10. Public debt (% of GDP), 2017 est. / The World Factbook / Library / Central Intelligence Agency(from smallest to largest) *210 * Total number of countries participating in ranking Figure 1. Economic Indices of the United States of America |
Since the early 1990s (apart from a slight decline in 2008) the country experienced sustained GDP growth in purchasing power parity both in general and per capita, which in 2020 amounted to $19.84 trillion (2nd place in the world) [3,4,5]. The country’s GDP at purchasing power parity per capita is lower (17th place in the world), but has also been demonstrating positive dynamics: from $58,400 in 2015 to $59,800 in 2017 and $60,200 in 2020 [3]. The level of inflation changed from 1.3% in 2016 to 2.1% in 2017 and 1.8% in 2019 [3].
According to The Global Competitiveness Report 2019, presented by the World Economic Forum, the U.S. was 2nd only to Singapore (out of a total of 141 countries considered). This rating measures the effectiveness of the country’s use of its own resources for sustainable development. In addition to a number of economic indicators this index also takes into account such variables as education, health, level of innovation, etc.
According to the Index of Economic Freedom, which is based on freedom of business, freedom from government intervention, property protection, and freedom from corruption, the country was 20th in 2021, out of 178 countries considered. In terms of gold reserves and foreign exchange reserves in 2017 the U.S. was 21st, behind South Korea, Russia and China.
According to the indicator for the average GDP growth in percentage over the last 10 years (2011-2020), in 2017 the country was 131st out of 206 countries. In terms of public debt, calculated as a percentage of the country's GDP, the USA was ranked 36th out of 210 countries considered in 2017. The top Global 500 companies include US oil and gas enterprises such as Exxon Mobil, Chevron, Valero Energy, Marathon Petroleum, Schlumberger, ConocoPhilips, and Duke Energy, and the large energy company General Electric. In S & P Global Platts 2017 Top 250 ranking of the largest energy companies several dozen US companies are listed, including those already mentioned, as well as NextEra Energy, Inc., Phillips 66, The Southern Co, Dominion Energy, Xcel Energy Inc., and many others.
Energy Resources
The U.S. has significant reserves of fossil and unconventional energy resources (Table 1). In terms of oil and gas reserves, the country was 9th and 5th in the world, respectively; in terms of coal reserves the country was the absolute leader [6,7].
According to data for 2021, in terms of tons of oil equivalent proved coal reserves were 89.7%, natural gas – 6.7%; and oil – 3.6% (Fig.5). The Matrix of unconventional resources for 2021 looks somewhat different: oil shale (kerogen) represented 95.1%, shale gas – 2.7%, shale (tight) oil – 1.7%, associated gas – 0.4%, coal mine methane utilization potential – 0.1% (Fig.7).
In 2020, according to the U.S. Energy Information Administration, proven oil reserves in the U.S. were estimated at 35.8 billion barrels [7].
Table 1. Fossil energy resources of the United States of America
| Resource /Explanations | Crude oil* | Natural gas* | Coal* | Shale Gas** | Tight Oil** | Coal mine methane | Extra Heavy Oil*** | Oil Shale*** |
|---|---|---|---|---|---|---|---|---|
| Value | 44.4(2.61%) | 465(6.41%) | 252(21.66%) | 317.7 | 78.2 | 11,878 | 19 | 3 706 825 |
| Unit | billion barrels | Tcf | billion short tons | Bcf | billion barrels | Bcf | million barrels | million barrels |
| Year | 2021 | 2020 | 2021 | 2020 | 2015 | 2020 | 2008 | 2008 |
| Source | [7] | [7] | [7] | [13] | [14] | [12] | [16] | [16] |
* share of the country’s reserves in world total is provided in brackets
**unproved technically recoverable
***in-place resources
BP’s annual report provides a higher figure for the end of 2020 – 68.8 billion barrels [6]. Proven natural gas reserves in the U.S. in 2020 according to [6] were 12.6 Tcm. According to the U.S. Energy Information Administration they totalled 495 Tcf [7]. The proven reserves of associated and dissolved natural gas in 2017 grew by 38% and were estimated at 99.4 Tcf [8].
According to the U.S. Energy Information Administration, recoverable coal reserves were estimated at 252 billion short tons, of which about 58% is coal mined underground [8]. According to the BP report, coal reserves were 248,941 million tonnes, as of 2020, [6]; according to Bundesanstalt für Geowissenschaften und Rohstoffe (BGR), they were estimated at 219,534 million tons of hard coal in 2018[10].
According to Advanced Energy Technologies calculations, the methane utilization potential (according to the methodology based on methane emissions from coal mining [11] and its reserves in 2017 [6]), was 2 210-5 564 Bcm. According to the U.S. Energy Information Administration [12] ,proven reserves of coalbed methane were estimated at 11.878 Bcf at the end of 2017; source [10] places coal methane reserves in 2016 at 4,470 Bcm.
The U.S. has the largest reserves of shale gas, with proven reserves at the end of 2020 of 317,756 Bcf [13]. Unproven technically recoverable reserves of shale gas and shale oil in 2015 were estimated at 622.5 Tcf and 78.2 billion barrels, respectively [14]. The country has the world's largest reserves of kerogen oil (oil shale) – 6 trillion barrels, which are concentrated in the Green River deposit (Utah, Colorado and Wyoming), and make up about 80% of the world’s total reserves [15]. In-place resources of kerogen oil in 2008 were estimated at 3,706,825 million barrels, and reserves of extra heavy oil at 19 million barrels [16].
The United States of America, due to its geographic location, has a variety of renewable sources for energy production. A selection of basic indicators of this type of resource is presented in Table 2
Table 2. Renewable energy resources of the United States of America
| Resource/ Explanations | Solar Potential (DNI)* | Wind Potential (50 м)* | Hydro energy Potential** | Bio Potential (agricultural area) | Bio Potential (forest area) | Geothermal Potenial | Municipal Solid Waste |
|---|---|---|---|---|---|---|---|
| Value | 4.1-5.5 | 5.5-7.7 | 528, 923 | 44.5 | 33.3 | 9 057 | 2.58 |
| Unit | kWh/m2/day | m/s | GWh/year | % of land area | % of land area | MWe | kg/per capita/day |
| Year | 2018 | 2018 | 2016 | 2018 | 2018 | 2008 | 2012 |
| Source | [17] | [19] | [22] | [23] | [24] | [25] | [26] |
* for the majority of the territory of the country
** economically exploitable capability
The level of direct solar irradiation for the majority of the country is between 4.1-5.5 kWh/m2/day [17]. In the southeast of the country and in the states of California, Nevada, Arizona, New Mexico and Hawaii, this figure can reach maximum values of 6.8 - 8.2 kWh/m2/day [17]. According to the U.S. Department of Energy, the potential of solar energy in these states is more than 600 watt hour/feet2/day [18]. When combined with the high frequency of cloudless days, this region is one of the most promising in the world for the development of all types of solar energy.
The distribution of wind resources is as follows: for the majority of the country the wind speed is 5.5-7.7 m/sec; in the north-west and north-east of the country it can reach 8.7-9.7 m/sec; and in the Aleutian and Hawaiian Islands it exceeds 9.7 m/s at 50 metres [19]. According to [20], the total wind energy potential at 80 metres is 10,640,080 MW, with Texas demonstrating the highest potential at 1.3 million MW. According to NREL, onshore wind potential (excluding offshore wind power) in 2012 was estimated at 22,195 TWh [21].
The total hydropower potential of the U.S., according to the World Energy Resources Hydropower report in 2016, was 528 923 GWh/year; only 52% of this is being utilized [22]. Oak Ridge National Laboratory in 2012 estimated the total hydro potential at 278 TWh [21].
According to data for 2018, 44.5% of the territory of the country is occupied by agricultural land, the area of which has been steadily decreasing during the last half-century [23] There has been a slight decrease in forest area to 33.3% of the country's territory in 2018 [24]. The total potential of bioenergy in 2011 was estimated at 445 TWh [21]. The geothermal potential of the country in 2008 was 9,057 MW [25].
The level of municipal waste generation in the U.S. in 2012, was 2.58 kg per capita per day, which is higher than in many developed countries, such as Germany – (2.11 kg per capita per day), and France – (1.92 kg per capita per day). By 2025 this figure is projected to grow to 2.3 kg per capita per day [26]. This resource is a valuable raw material for recycling or energy production, the technologies of which have reached a high level of development in the U.S.
Energy Balance
According to the BP Statistical Review of World Energy 2021, primary energy consumption in the U.S. in 2020 amounted to 87.79 Exajoules and was dominated by oil - 37%, followed by natural gas - 29.9%, coal -9.2%, nuclear energy - 8.4%, renewable energy - 7%, and hydropower 2.9% [6]. An estimated value of the energy efficiency of GDP in the U.S., based on the data from [3,6] was $8.7 in 2016 taking into account the PPP in 2011 prices per unit of energy expended (the equivalent of energy contained in one kg of oil), which is lower than the world average. Production of oil and condensate in the U.S. between 2001 and 2020 increased significantly, reaching 18,609 thousand barrels/day, compared with 8,957 thousand barrels/day in 2001 [8,27]. The consumption of liquid hydrocarbons during the same period did not change significantly: the minimum level was 18,487 thousand barrels/day and in 2019 amounted to 20,542 thousand barrels/day [27]. BP shows lower figures of oil and condensate production in the U.S. in 2020 - 11,315 thousand barrels/day, with consumption at 18,120 thousand barrels/day [6]. Nevertheless, the U.S. was the first largest producer of crude oil in 2017 according to [3]. Imports of oil to the U.S. in 2017, according to [3] totalled 7.969 million barrels/day, making the country the largest importer of oil in the world; exports levels were 1.158 million barrels/day. The U.S. is the largest producer, consumer and exporter of petroleum products in the world.
Source: U.S. Energy Information Administration (Sep 2023) / www.eia.gov
Figure 2. The production and consumption of fossil fuels in the United States of America (coal – left, gas – in the center, oil – right)
In terms of the import of petroleum products, the U.S. is in second place in the world, behind the aggregate indicators of the EU [28].
The United States is also the largest consumer and producer of natural gas in the world [3]. The consumption of natural gas in the U.S. has grown slightly since 2006 and in 2020 reached 30,482 Bcf, production also grew during this period, reaching 33,436 Bcf in 2020 [27]. According to the BP Statistical Review of World Energy 2021 [6], natural gas consumption in the country totalled 832 billion m3 in 2020, while production was 914 billion m3. According to [3] gas exports were 89.7 billion m3 and natural gas imports were 86.15 billion m3. In terms of natural gas imports, the country was 4th in the world [3].
Production and consumption of coal in the country has decreased since 2008, and in 2020 totalled 1171.8 and 706.3 million short tons, respectively [27]. According to BP, in 2020 coal consumption amounted to 9.20 Exajoules, while production reached 10.71 Exajoules [6]. The extraction of coal mine methane in 2017 was 980 Bcf; around 35% less than in 2013 – 1,466 Bcf [8].
Fossil sources predominate in the production of electricity in the U.S., although in recent years there has been a gradual increase in the share of renewable energy sources and a decrease in the share of fossil fuels (Figure 3).
Sources: U.S. Energy Information Administration (Sep 2023) / www.eia.gov | ||
| Figure 3. Electricity production in the United States of America |
In 2020, according to the U.S. Energy Information Administration, electricity generation totalled 4050.83 TWh, and was dominated by fossil fuels – 59.7%, followed by nuclear power – 19.5%, renewable sources – 13.7%, and hydropower – 7.1% (Fig. 9).
The U.S. position in the comparative diagram of energy index is shown in Figure 4.
| Sources: 1. Crude oil proved reserves, 2021 / International Energy Statistic/Geography / U.S. Energy Information Administration (Nov 2021)*98 2. Natural gas proved reserves 2021 / International Energy Statistic / Geography / U.S. Energy Information Administration (Nov 2021) *99 3. Total recoverable coal reserves 2019 / International Energy Statistic / Geography / U.S. Energy Information Administration (Nov 2021) *81 4. Combination production-consumption for Crude oil 2018 / International Energy Statistic / Geography / U.S. Energy Information Administration (Nov 2021) *219 5. Combination production-consumption for Natural gas 2019 / International Energy Statistic / Geography / U.S. Energy Information Administration (Nov 2021) *123 6. Combination production-consumption for Coal 2019 / International Energy Statistic / Geography / U.S. Energy Information Administration (Nov 2021) *128 7. Electricity – from other renewable sources (% of total installed capacity), 2017 est. / The World Factbook / Library / Central Intelligence Agency *170 8. GDP per unit of energy use (PPP per unit of oil equivalent), 2020 *66 Primary energy consumption - BP Statistical Review of World Energy 2021/BP;GDP (purchasing power parity) - The World Factbook/Library/Central Intelligence Agency 9. Energy use (primary energy use of oil equivalent per capita) 2020 *127 Primary energy consumption – BP Statistical Review of World Energy 2021; Population - United Nations, Department of Economic and Social Affairs, Population Division (2019). World Population Prospects 2019, custom data acquired via website. Retrieved 15 November 2021*66 10. The Global Energy Architecture Performance Index Report (EAPI) 2017 / Rankings / Reports / World Economic Forum 11. Electric power consumption (kWh per capita), 2016 *217 Electricity Consumption - The World Factbook / Library / Central Intelligence Agency; Population - United Nations, Department of Economic and Social Affairs, Population Division (2019). World Population Prospects 2019, custom data acquired via website. Retrieved 15 November 2021 12. Combination of electricity production-consumption (kWh)/The World Factbook/Library/Central Intelligence Agency *216 * Total number of countries participating in ranking Figure 4. Energy indices of the United States of America |
As previously mentioned, the U.S. possesses exceptionally rich reserves of all types of fossil fuels. In terms of the production and consumption ratio of coal, The U.S. is among the top 25% leading countries; however the production and consumption ratio of oil and gas is below the world average.
In terms of the share of electricity production from renewable energy sources (excluding hydropower), the U.S. was 64th out of 170 countries selected for consideration in 2017. The U.S. was 52nd in the EAPI of 2017 (Energy Architecture Performance Index), which is based principally on the level of economic growth, environmental safety, and energy independence of the country, including access to energy. Over the last 8 years the country has gained two positions in the rating.
The U.S. was below the world average in terms of GDP per unit of energy use in 2017 – 40th out of 66 countries considered, but this indicator per capita is higher – 10th place in the world.
In terms of electricity consumption per capita, the country is 10th in the world, however, for the indicator of combined electricity production-consumption the U.S. is 3rd in the ranked list of 216 countries, after India and China.
Energy Infrastructure
A territorial map showing the distribution of the largest infrastructure projects of the fossil-fuel sector in the U.S. is shown in Figure 5.
The proven reserves of coal account for 89.7% of total fossil fuel resources, followed by natural gas (6.7%), and oil (3.6%) (Fig.5). The largest reserves of crude oil and condensate are concentrated in the state of Texas, where they amount to 15.6 billion barrels; production in 2021 was 1,741 million barrels [8]. The top five states in terms of production capacity and oil reserves is rounded off by North Dakota, California, New Mexico and Oklahoma (Figure 5). In 2017, 141 U.S. refineries had a total installed capacity of 18.62 million barrels/day [29] and 17.9 mbd operable capacity in 1Q 2022 [8]. The country's largest refinery, Port Arthur, is located in Texas and has an installed capacity of 603,000 bbl/day; it is operated by TX Motiva Enterprises [30] (Fig. 5). The import of oil and oil products is carried out via 8 key oil terminals, and the largest storage of petroleum products is Bryan Mound (237.4 million barrels). The total installed capacity of oil storage facilities in the country is 713.5 million barrels [31]. Refined products are transported via pipelines with a total length of 240,711 km (Fig. 5).
In addition to its oil reserves, Texas has substantial gas reserves. According to American experts in 2020, Texas fields contained 102.4 Tcf, of which 10.5 Tcf was extracted in that same year [8]. sector in USA")
Figure 5. Basic infrastructure facilities of the fossil fuel sector in the United States of America: conventional oil
Pennsylvania, Oklahoma and Wyoming were also included in the top five states in terms of natural gas reserves and production (Fig. 6).
The American gas system is represented by 1,400 gas compressor stations, 500 gas processing plants, and 415 underground gas storage facilities. Gas is transported within the country via a network of pipelines with a total length of 1,984,321 km (Fig. 6).
 sector in USA")
Figure 6. Basic infrastructure facilities of the fossil fuel sector in the United States of America: conventional natural gas
Gas is imported via 11 LNG terminals, the largest of which is Sabine, LA with a throughput of 4.0 Bcfd [32]. The significant increase in the production of the country’s own shale gas in the last decade has generated new demand for export terminals. Three export terminals, including the Sabine Pass, LA with an installed capacity of 2.8 Buff, ship LNG [32]; 4 more export terminals are under construction (Fig. 6). The leading gas processing plant is the Aux Sable Grundy with an installed capacity of 2,100 Mccfd [33]. The largest number of underground gas storage facilities are located in Pennsylvania, 49 of which have a total capacity of more than 760,000 million cubic feet [34].
The Matrix of unconventional resources for 2015-2017 was dominated by oil shale (kerogen) - 95%; shale gas accounted for 2.7%, shale (tight) oil for 1.7%; associated gas for 0.4%; and coal mine methane utilization potential for 0.1% (Fig.7).
One of the leading oil shale fields is Red Leaf Resources Seep Ridge, in Utah [35]. The U.S. is the undisputed world leader in the development of technologies for the extraction of unconventional and enhanced oil recovery. This was reflected in the rapid development of the production of shale oil, the resuscitation of old fields, the development of oil production in the Arctic, the expansion of heavy and high-viscosity oil production. The country’s largest oilfield - Eagle Ford - is located in Texas which produced 1.17 million barrels/day [36].
The U.S. territory also has a large number of heavy oil fields, the majority of which are located in California. Aera Energy South Belridge (Tulare) produces around 80,000 barrels per day of oil equivalent [37]. In Utah there are a number of ongoing projects for the extraction of oil sands (Fig. 7). The infrastructure of unconventional oil is represented by several vertical oil shale retorting plants (Fig. 7).
Shale gas accounts for about 2.7% of the potential of the country's unconventional natural resources. The largest shale gas field is Marcellus (123.8 Tcf), with production volume about 7.0 Tcf [8].
 in USA")
Figure 7. Basic infrastructure facilities of the fossil fuel sector in the United States of America: unconventional oil
Potential reserves of coalbed methane are distributed throughout the country, but the main basins are located in the Rocky Mountains in the west, in the Appalachian region, and in the east of the country [38] (Fig. 8). The leading extraction field is in Colorado, whose reserves as of 2017 were 3,257 Bcf, with production at 338 Bcf [8]. It should be noted that the reserves and production of coal mine methane have significantly decreased in recent years. Natural gas hydrate clusters have been discovered in offshore areas (Fig. 8), which may offer a very promising energy resource in the future.
 in USA")
Figure 8. Basic infrastructure facilities of the fossil fuel sector in the United States of America: unconventional gas
The production of synthetic fuels is developing somewhat slowly in the U.S; there are only a few relatively small enterprises of this type. For example, in Oklahoma and Alaska, there are a small number of Gas-to-Liquid plants, for example Ponca City, owned by ConocoPhillips, which has an installed capacity of 300 barrels/day [39]. Oberon Fuels Brawley in California produces around 10,000 gallons of DME daily, using biogas or natural gas as raw materials [40]. The coal gasification infrastructure is represented by several stations, including the Great Plains Synfuels Plant in North Dakota, with a capacity of 16 thousand tons of coal per day [41], and an underground CIRI Stone Horn Ridge Station with an installed capacity of 100 MW [42].
A map of the territorial distribution of the U.S. largest infrastructure facilities for electricity generation is presented in Figure 9.
 in USA")
Figure 9. Electricity production in the United States of America: thermal power plants
As already noted, the share of coal in the potential of fossil resources is significant. In total there are more than 680 coal mines in the country, with an annual production more than 700 million short tons (Fig.9). Coal mines are mainly concentrated in the eastern and central regions of the country. Wyoming has the richest coal resource base; coal mining in this state in 2021 produced 239 million short tons [43]. The majority of export terminals are located in the south and east of the country; the largest is Lamberts Point, VA with a capacity of 48 million tons [44].
According to the U.S. Energy Information Administration, the share of fossil resources in electricity production in the U.S. in 2020 was 59.7% (Fig. 9). The country has a significant number of stations for the production of electricity from hydrocarbons, including power plants with a capacity of more than 1000 MW: four oil stations, eleven gas, eleven coal and six combined-type stations (Fig. 9). The largest thermal power plants in the U.S. are: FPL's Martin County gas power plant, with a capacity of 3.750 MW [45]; Manatee oil power plant, with an installed capacity of 2.485 MW [46]; Robert W. Scherer coal power plant with an installed capacity of 3.564 MW; and James M. Barry combined power plant with an installed capacity of 2,671 MW [47,48].
Hydropower in the U.S. produces about 7.1% of total electricity generation, and is represented by pumped storage plants, and large and small hydroelectric plants (Fig. 10). The largest pumped storage plant is the Bath County Pumped Storage Station with an installed capacity of 3,003 MW [49]; and the largest hydroelectric power plant is the Grand Coulee Dam with an installed capacity of 6,809 MW [50]. In 2017, there were more than 1,646 small hydropower stations registered in the U.S., the installed capacity of which was 3,612 MW (Fig.10).
The main uranium mines are located in the north-west of the country; the largest is Smith Ranch-Highland which produced around 358 tons in 2016 [51]. The leading nuclear power plant is Palo Verde with an installed capacity of 3,937 MW [52]. There are also significant reserves of raw materials for lithium production, which is currently being used to produce batteries primarily for the electronics and automotive industries. In the Clayton Valley of Nevada at the Silver Peak mine, 3,500 tons of lithium was mined in 2017, with the possibility of expanding its production to 6,000 tons [53]. in USA")
Figure 10. Electricity production in the United States of America: hydro and nuclear power plants
In Figure 11, you can see the main facilities of the U.S. for the production of energy from renewable sources.
Renewable energy in the U.S., excluding hydropower, is responsible for only 13.7% of electricity generation (Fig. 10). The total production of electricity from renewable sources in 2017, excluding hydropower, was 555.89 TWh (Fig. 10).
In zones of high wind activity there are around 10 large wind parks, with a capacity of more than 550 MW each. In 2020 a total generating capacity of wind power in the United States was around 135 thousand MW [54]. Alta Wind Energy Center in California, also known as Mojave Wind Farm has an installed capacity of 1,547 MW and is largest in the U.S. and third largest in the world [55]. The main producers of wind turbines in the US are GE Energy, Urban Green Energy, REpower USA Corp., Northwind, Suzion and Harvistor LLC (Fig.11).
")
Figure 11. Renewable energy in the United States of America: marine, solar, wind
Two U.S. companies have implemented notable large-scale wind energy projects in recent years: in December 2017, wind turbine manufacturer Vestas received an order for the construction of wind farms with a total capacity of 190 MW; and in 2018 Gamesa announced the implementation of two wind farm projects with a total capacity of 330 MW [56, 57]. As previously mentioned the level of solar radiation in some areas of the country can reach 8.2kWh/m2, which is a vast resource for energy production [19]. As a result there are a number of solar energy facilities installed in these areas, including PV power plants, CPV and CSP power plants (Fig.11). The largest photovoltaic station is Solar Star with a capacity of 747.3 MWp, and the largest CPV station is Alamosa with a capacity of 35.2 MWp [58,59]. About 0.5% of electricity from renewable sources in the U.S. is generated by CSP stations. Among parabolic type CSP stations, the largest is SEGS California Complex with a capacity of 393.8 MW [60]. Solana Generating Station (280 MW) is the largest parabolic type station with thermal storage [61]. The largest tower station is Ivanpah (392 MW), and the largest tower type station with thermal storage is Crescent Dunes (110.0 MW) [62,63]. Kimberlina STEP CSP Linear Fresnel type plant has a capacity of 5 MW and Tooele Army Depot CSP Dish-Stirling type plant has a capacity of 1.5 MW [64,65]. The potential of wave energy is estimated at between 20-40 kWh. In some areas, primarily in the Hawaiian Islands, the development of ocean technology is underway. Thus, there are a number of power plants installed in the coastal zones: Hawaii Azura Wave Energy Project Power Plant (40 kW) [66], the RITE Project, NY Verdant Power Tidal Power Plant (1.05 MW) and MOE / NELHA Hawaii OTEC Plant (100 kW) [67,68].
The U.S. is the world's largest producer of electrical and thermal energy from geothermal sources. The current installed capacity of geothermal power in the U.S. is 3,673 MW from 93 power plants of various types [95] (Fig. 12), however, in most cases, the geothermal steam properties allow for the use of dry steam technologies.
Figure 12. Renewable energy in the United States of America: geothermal and hydrogen
Binary type geothermal power plants, of which the largest is Steamboat Hills with a capacity of 135.8 MW, have developed significantly. Steamboat Hills Single Flash Geothermal Power Plant, with an installed capacity of 14.4 MW, is located in Nevada [69,70]. The Imperial Valley Complex is a powerful enterprise utilizing Double Flash technology, which consists of several stations with a total capacity of 327 MW [71]. In the west of the country and in Hawaii there are geothermal stations of a combined type – the Heber Complex has a total capacity of 217.7 MW [72]. The Geysers Complex Dry Steam Geothermal Plant located in California has an installed capacity of 1,000 MW [73].
The U.S. is actively developing hydrogen power and is an undisputed world leader by such indicators as production volumes of commercial hydrogen, production of electricity from fuel cells, length of hydrogen pipelines, number of hydrogen fuelling stations, and others. As of March 2018, there were more than 50 hydrogen filling stations in operation in the country (Figure 12). There are hydrogen production facilities in the country, the largest of which is Texas City with an installed capacity of 372,856 Nm³/hr, owned by TX Praxair [74] and Hydrogen Fuel Cell plants, including Newark, owned by Delmarva Power, with an installed capacity of 30 megawatts [75]. Hydrogen is transported via pipelines with a total length of 2,320 km (Fig. 12).
Figure 13 shows the main bioenergy facilities of the country for energy production.

Figure 13. Renewable energy in the United States of America: Bioenergy
Bioenergy is being actively developed in the U.S. In 2021 the installed capacity was 13.57 GW (4.2%) (Fig.13). The country has biomass and municipal waste processing plants, biodiesel, and pellet production, amongst others (Fig. 13).
FL manages the largest biomass power plant - Okeelanta 1-2 - with an installed capacity of 120.0 MW [76]. The main enterprise in the United States in the field of fuel production from biomass is RBF Port Neches Biodiesel Plant with an installed capacity of 180 MW [77].
The U.S. is actively engaged in the production of bioethanol, being the world leader in this energy sector; ADM Cedar Rapids has an installed capacity of 540 Million gallons per year (MGY) [78]. Second-generation bioethanol from cellulose is produced at the DuPont Nevada plant, which has an installed capacity of 30.0 Million gallons per year (MGY) [79]. Hometown BioEnergy, located in La Sueur with a capacity of 8 MW, uses biogas obtained via anaerobic fermentation [80].
Other notable enterprises include: Plainfield Renewable Energy Biomass Gasification Plant that anually burns about 350 000 tons of wood [81]; Enerkem Pontotoc waste gasification plant, with the ability to produce 10 million gallons of ethanol per year [82]; GM Defiance waste gasification by plasma plant, with a capacity of 50 tpd [83]; and Georgia Biomass Waycross with a capacity of 800,000 tons of pellets per year [84].
The leader in generation of electricity from municipal waste, Palm Beach 2, processes about 3,000 tons of waste a day [85]. In the U.S. there is one of the most developed networks of enterprises for the production of electricity from landfill gas. One such enterprise, Fairless Hills, generates about 60 MW of electricity from municipal waste from the production and utilization of landfill gas [86]. The UOP Kapolei Rapid Pyrolysis Demonstration Plant has an installed capacity of 168 g/day [87], and the largest BTL-FT plant, GTI Des Plaines, has a capacity of 5 MWth [88]. Torrefaction plants are located mainly in the south-east of the country, and the largest is Zilkha Biomass Energy Selma, capable of producing 275,000 metric tons per year [89].
Within the framework of the "Energy Domination" program, voiced both during the election campaign and presidency of President Donald Trump, a number of directions of reform have been identified. First of all, the reforms will affect the coal industry – President Trump promised to remove the legislative obstacles against the production of "clean coal" and revise the moratorium on leasing coal-fired power plants in the federal states. Nevertheless, analysts at Ernst and Young believe that utilities or financial investors switching to inexpensive natural gas will not fundamentally adjust their recent business models in favour of investing in coal production, even in the absence of federal cuts [90]. In the course of his election campaign, Trump also repeatedly stressed that he was going to lift restrictions on the extraction of shale gas and kerogen oil in federal states [91]. Oil companies can now freely access subsoil resources, for example, in Alaska [92]. In March 2017, the president issued a decree revising all existing rules, orders, guidelines that could potentially harm the development or use of energy resources consumed domestically, with special attention to oil, natural gas, coal and nuclear energy resources [91].
Another aspect of energy policy is the increase in the share of oil imports from Canada and Mexico, and the decrease of dependence on Middle Eastern suppliers.
In the field of renewable energy, the turning point was Trump's decision to terminate the participation of the U.S. in the "2015 Paris Agreement" that aims to mitigate the effects of climate change, as it, according to the president, undermines the economy of the U.S. and puts the country in a permanently unfavourable position [93]. However, from his first days in office, President Biden said that the United States would rejoin the Paris Agreement, and it did so on February 19, 2021. Biden's new climate plan is the most comprehensive the U.S. president has ever adopted [94].
Education and Innovation
| Sources: 1. The Global Innovation Index 2021, Rankings / Knowledge / World Intellectual Property Organization / Cornell University, INSEAD, and WIPO (2021): Energizing the World with Innovation. Ithaca, Fontainebleau, and Geneva *132 2. Patent Grants 2011-2020, resident & abroad / Statistical country profiles / World Intellectual Property Organization *185 3.Patents in Force 2020 / Statistical country profiles / World Intellectual Property Organization *109 4. QS World University Rankings 2022 *97 5. SCImago Country Rankings (1996-2020) / Country rankings / SCImago, (n.d.). SIR-SCImago Journal & Country Rank [Portal]. Retrieved 17 Nov 2021 *240 6. Internet users in 2018 / The World Factbook / Central Intelligence Agency *229 7. Internet users in 2018 (% Population) / The World Factbook / Central Intelligence Agency *229 8. Government expenditure on education, total (% of GDP), 2019 / United Nations Educational, Scientific, and Cultural Organization (UNESCO) Institute for Statistics. License: CCBY-4.0 / Data as of September 2021*177 9. Research and development expenditure (% of GDP), 2018 / UNESCO Institute for Statistics. License: CCBY-4.0 / Data *119 10. Scientific and technical journal articles, 2018 / National Science Foundation, Science and Engineering Indicators. License: CCBY-4.0 / Data *197 * Total number of countries participating in ranking Figure 14. The indices of education and innovation in the United States of America |
The U.S. is 3rd out of 132 countries considered in the ranking of countries in the Global Innovation Index 2021 (see diagram). According to the number of patents granted to the U.S. nationals, both domestically and abroad, the country ranks 3rd in the world, behind Japan and China. However, by the number of valid patents in force, the U.S. ranks first, indicating the country's favourable conditions for innovation.
Nevertheless, 177 American universities are included in the rating of the world leading universities - “QS University Rating”. It is also worth noting that the country's GDP is high, therefore, in absolute terms the level of government expenditure on education is still considerable. In terms of public expenditure on research and development as a percentage of GDP, the country is 10th out of 119, behind South Korea and a number of EU countries. The U.S. is very well positioned when considering the number of publications of specialists in scientific and technological journal and patent activities. The country is 1st out of 240 participating countries in the Scimago ranking, and in Scientific and Technical Journal Activities it is ranked 2nd out of 197 countries. The country is also among the leaders in the region in terms of the number of Internet users.
U.S universities such as the Massachusetts Institute of Technology, Stanford University, California Institute of Technology, Yale University, Harvard University, Princeton University, the University of California, and Berkeley train specialists in various fields of energy, including Energy Engineering, Environmental Engineering Science, Geological Engineering, and Sustainable Energy, etc.
In the field of synthetic fuel technology, ExxonMobil Research and Engineering Company, Chevron USA, Inc., Exxon Research and Engineering Company, General Electric, ConocoPhilips Company, Shell Oil Company actively patent their inventions. Research in this area is carried out by the University of Kentucky National Technological Laboratory (NETL), Princeton University, Texas A & M University, Pasific Northwest National Laboratory (PNNL).
In the field of unconventional oil, Halliburton Energy Services, Inc., Shell Oil Company, ExxonMobil Upstream Research Company, M-I LLC, the Harris Corporation, Baker Hughes Inc., and ConocoPhilips are leading by number of patents. Studies in this area are conducted by Texas A & M University, US Geological Survey (USGS), Schlumberger Company, Stanford University, and the Colorado School of Mines.
In the sector of associated petroleum gas, the largest number of inventions have been registered by Velocys Inc., ExxonMobil Upstream Research Company, ExxonMobil Research and Engineering Company, Siluria Technologies Inc., Velocys Inc., the University of North Dakota, the University of Texas and Austin actively publishes scientific works in this field.
ExxonMobil Upstream Research Company, Halliburton Energy Services, Inc., CDX Gas LLC, Baker Hughes Inc. are leading in the number of patents in coalbed methane mining technologies, and studies are conducted by Pennsylvania State University, Texas A & M University, Schlumberger Company, and Halliburton. In the field of hydrocarbon production from low-permeability reservoirs, the absolute leaders in patenting are Halliburton Energy Services, Inc., Baker Hughes Incorporated, Schlumberger Technology Corporation, Rohm and Haas Company, and studies are also conducted by the University of Texas and Austin, Schlumberger Company, Texas A & M University, and the University of Oklahoma.
Chevron USA, Inc., ExxonMobil Upstream Research Company, KJT Enterprises, Inc., Halliburton Energy Services, Inc., Schlumberger Technology Corporation patent their developments in the field of gas hydrate production technologies. US Geological Survey (USGS), Lawrence Berkeley National Laboratory, National Energy Technology Laboratory (NETL), Texas A & M University conduct research in this field.
Patents in bioenergetic technologies are possessed by Xyleco Inc, Celanese International Corporation, Solyzame, Inc., Heliae Development LLC, UOP LLC. Scientific research in the same field is conducted by the National Renewable Energy Laboratory (NREL), the Unversity of California, Iowa State University, and Purdue University.
A large number of companies patent inventions and conduct research in the field of renewable energy technologies. In the field of solar energy - SunPower Corporation, 3M Innovative Properties Company, Boeing Company, PPG Industries Ohio, Inc. are leading by number of inventions. Most publications come from the National Renewable Energy Laboratory (NREL), Sandia National Laboratories, the University of California, and the Massachusetts Institute of Technology (MIT). The inventions in the field of wind energy are patented by General Electric, Frontier Wind, LLC., Clipper Windpower LLC, Modular Wind Energy Inc. and conducted by the National Renewable Energy Laboratory (NREL), the University of Massachusetts, Texas A & M University, and Sandia National Laboratories.
Ecology and Environment Protection
The country demonstrates a relatively high level of CO2 emissions, both in general and per capita. It is also necessary to note the very high level of methane emissions in the country.
| Sources: 1. CO2 total emission by countries 2020 / European Commission / Joint Research Centre (JRC) / Emission Database for Global Atmospheric Research (EDGAR)*208 2. CO2 per capita emission 2020/European Commission/Joint Research Centre (JRC) / Emission Database for Global Atmospheric Research (EDGAR) *208 3. Forest area 2020 (% of land area) / The Global Forest Resources Assessment 2020 / Food and Agriculture Organization of the United Nations *234 4. Forest area change 2010-2020 (1000 ha/year) / The Global Forest Resources Assessment 2020 / Food and Agriculture Organization of the United Nations *234 5. The Environmental Performance Index (EPI) 2020 / Rankings / Yale Center for Environmental Law & Policy / Yale University *180 6. Annual freshwater withdrawals (m3 per capita), 2017 *179 Annual freshwater withdrawals, total (billion m3), 2017 – Food and Agriculture Organization, AQUASTAT data. /License: CC BY-4.0; Population – United Nations, Department of Economic and Social Affairs, Population Division (2019). World Population Prospects 2019, custom data acquired via website. Retrieved 15 November 2021 7. The National Footprint Accounts 2017 (Biocapacity Credit / Deficit) / Global Footprint Network *188 8. Methane emissions (kt of CO2 equivalent), 2018 / Data for up to 1990 are sourced from Carbon Dioxide Information Analysis Center, Environmental Sciences Division, Oak Ridge National Laboratory, Tennessee, United States. Data from 1990 are CAIT data: Climate Watch. 2020. GHG Emissions. Washington, DC: World Resources Institute. Available at: License : Attribution-NonCommercial 4.0 International (CC BY-NC 4.0) *191 9. The Climate Change Performance Index (CCPI) 2022 / Overall Results / Jan Burck, Thea Uhlich, Christoph Bals, Niklas Höhne, Leonardo Nascimento / Germanwatch, NewClimate Institute & Climate Action Network *60 * Total number of countries participating in ranking Figure 15. Environmental Indices of the United States of America |
The U.S. ranked 28th in the Climate Change Performance Index (CCPI) 2022, which includes the 64 countries responsible for more than 90% of global energy-related CO2 emissions; the U.S. is considered as a "medium" performer, having significantly improved its position over the past three years.
In terms of forest area as a percentage of the country, the U.S. in 2020 was 106th out of 234; however, the trend associated with its change from 2010-2020 looks very positive; by this metric the country is 7th in the world, behind China, Australia and Chile.
In the Environmental Performance Index rankings (EPI), which focuses primarily on assessing the environmental performance of national governments, the country was 24th out of 180 countries in 2020.
The overall negative picture is aggravated by the Ecological Footprint Atlas rating, according to which the U.S. is among a number of major ecological debtors.
References
[1] List of sovereign states and dependencies by area / Wikipedia / https://en.wikipedia.org/wiki/List_of_sovereign_states_and_dependencies_by_area
[2] List of countries and dependencies by population density / Wikipedia / https://en.wikipedia.org/wiki/List_of_countries_and_dependencies_by_population_density
[3] United States / The world factbook / Library / Central Intelligence Agency / https://www.cia.gov/
[4] GDP, PPP (constant 2011 international $) / World Bank, International Comparison Program database. License: CC BY-4.0 / Data / The World Bank / http://www.worldbank.org/
[5] GDP per capita, PPP (current international $)/ World Bank, International Comparison Program database. License: CC BY-4.0 / Data / The World Bank / http://www.worldbank.org/
[6] BP Statistical Review of World Energy 2021 (PDF) / BP / https://www.bp.com/
[7] Reserves and Capacity / International Energy Statistics / Geography / U.S. Energy Information Administration / http://www.eia.gov/beta/international/
[8] Sources and Uses/ U.S. Energy Information Administration (2020 – Jan. 13, 2022) / https://www.eia.gov/
[9] How much coal is in the United States? / Coal / Energy Explained / U.S. Energy Information Administration (November 15, 2018 ) / https://www.eia.gov/
[10] BGR (2019) : Energiestusdie 2019. Daten und Entwicklungen der deutschen und globalen Energieversorgung (21).—202S., Hannover. (PDF) / Bundesanstalt für Geowissenschaften und Rohstoffe (BGR) / http://www.bgr.bund.de/
[11] 2006 IPCC Guidelines for National Greenhouse Gas Inventories, Volume 2, Energy, Fugitive Emissions (PDF) / The Intergovernmental Panel on Climate Change (IPCC) / www.ipcc-nggip.iges.or.jp
[12] Coalbed Methane / Data / U.S. Energy Information Administration (Jan. 13, 2022) / https://www.eia.gov/
[13] Shale Gas / U.S. Energy Information Administration (Jan. 13, 2022)/ https://www.eia.gov/
[14] World Shale Resource Assessments / Analysis / U.S. Energy Information Administration (September 24, 2015) / https://www.eia.gov/
[15] 2016 Survey of Energy Resources (PDF) / 2016 / Uploads / World Energy Council / https://www.worldenergy.org/
[16] 2010 Survey of Energy Resources (PDF) / 2010 / Uploads / World Energy Council / https://www.worldenergy.org/
[17] Solar resource data obtained from the Global Solar Atlas, owned by the World Bank Group and provided by Solargis / Global Solar Athlas / http://globalsolaratlas.info/
[18] Solar Energy Potential / Maps / U.S. Department of Energy / https://www.energy.gov/
[19] Wind Map / Global Wind Atlas 2.0, a free, web-based application developed, owned and operated by the Technical University of Denmark (DTU) in partnership with the World Bank Group, utilizing data provided by Vortex, with funding provided by the Energy Sector Management Assistance Program (ESMAP). For additional information: https://globalwindatlas.info
[20] U.S. Potential Wind Capacity in Megawatts at 80 M / U.S. Department of Energy / https://windexchange.energy.gov/
[21] Estimating Renewable Energy Economic Potential in the United States (PDF) / NREL / https://www.nrel.gov/
[22] Hydro (PDF) / World Energy Council / https://www.worldenergy.org/
[23] Agricultural land (% of land area) / Food and Agriculture Organization, electronic files and web site. License: CC BY-4.0 / Data / The World Bank / http://www.worldbank.org
[24] Forest area (% of land area) /Food and Agriculture Organization, electronic files and web site. License: CC BY-4.0 / Data / The World Bank / http://www.worldbank.org/
[25] 2016 Annual U.S. & Global Geothermal Power Production Report (PDF) / Geothermal Energy Association / http://geo-energy.org/
[26] What a Waste 2012 / Food and Agriculture Organization, electronic files and web site. License: CC BY-4.0 / Data / The World Bank / http://www.worldbank.org
[27] International Energy Statistic / Geography / U.S. Energy Information Administration (Jan. 13, 2022) /https://www.eia.gov/
[28] COUNTRY COMPARISON :: REFINED PETROLEUM PRODUCTS - IMPORTS / The world factbook / Library / Central Intelligence Agency / https://www.cia.gov/
[29] AFPM United States Refining and Storage Capacity report (PDF) / American Fuel & Petrochemical Manufacturers (AFPM) / https://www.afpm.org/
[30] Top 10 U.S. refineries* operable capacity / Energy Explained / U.S. Energy Information Administration (September 28, 2018) / https://www.eia.gov/
[31] SPR Quick Facts and FAQs / Strategic Petroleum Reserve / U.S. Department of Energy / https://www.energy.gov/
[32] North American LNG Import – Existing – As of January 24, 2018 (PDF) / Export Terminals / Federal Energy Regulatory Commission (FERC) / https://www.ferc.gov/
[33] Our Business / Aux Sable / http://www.auxsable.com/
[34] Table 14: Underground natural gas storage capacity by state (PDF) / U.S. Energy Information Administration (December 31, 2016) / http://www.eia.gov/
[35] Red Leaf Resources / Wikipedia / https://en.wikipedia.org/wiki/Red_Leaf_Resources
[36] U.S. Tight Oil Production 2017 / All about Shale / http://www.allaboutshale.com/
[37] Belridge Producing Complex / Aera / https://www.aeraenergy.com/
[38] Coal Mine Methane (CMM) Recovery Opportunities Map / United States Environmental Protection Agency / https://www.epa.gov/
[39] GAS -to liquid (GTL): is it an attractive route for gas monetization? Part III / Egypt Oil and Gas / http://egyptoil-gas.com/
[40] Three Options for Output, Feedstock, and Footprint / Oberon Fules / http://oberonfuels.com/
[41] Dakota Gasification Company / Wikipedia / https://en.wikipedia.org/wiki/Dakota_Gasification_Company
[42] Underground Coal Gasification: Test drilling confirms large commercial coal resource / CIRI / http://www.ciri.com/
[43] Wyoming State Geological Survey / https://www.wsgs.wyo.gov/
[44] Lamberts Point Coal Terminal, Norfolk, VA / Norfolk Southern / http://www.nscorp.com/content/nscorp/en.html
[45] Florida Power & Light / Wikipedia / http://en.wikipedia.org/wiki/Florida_Power_&_Light#Gas_plants
[46] Manatee Oil Power Plant / Industry About / https://www.industryabout.com/
[47] Scherer Steam Generating Station / Source Watch / http://www.sourcewatch.org/
[48] James M. Barry Electric Generating Plant / Wikipedia / http://en.wikipedia.org/wiki/James_M._Barry_Electric_Generating_Plant
[49] Bath County Pumped Storage Station / DOE Global Energy Storage Database / http://www.energystorageexchange.org/
[50] Projects & Facilities / U.S. Department of the Interior | Bureau of Reclamation / http://www.usbr.gov/
[51] US Uranium Mining and Exploration / World Nuclear Association / http://www.world-nuclear.org/
[52] 5 Largest Nuclear Power Plants in America / Maxx Chatsko / Jan 15, 2014 / The Motley Fool / http://www.fool.com/
[53] Nevada's Silver Peak Lithium Mine Prepares To Ramp Up Production / Wednesday, February 1st 2017, 4:28 PM PST by Paul Nelson / 2News / http://www.ktvn.com/
[54] Wind power in the United States / Wikipedia / https://en.wikipedia.org/wiki/Wind_power_in_the_United_States
[55] Alta Wind Energy Center / Wikipedia / http://en.wikipedia.org/wiki/Alta_Wind_Energy_Center
[56] Vestas’ receives 190 MW order in the U.S. and passes 10.5 GW in global order intake for 2017 / 30 Dec 2017 / Vestas / https://www.vestas.com/
[57] Siemens Gamesa awarded two wind turbine projects totaling 330 MW of G132-3.465 MW turbines in the U.S./ Siemens Gamsea / http://www.siemensgamesa.com/
[58] Solar Star / Wikipedia / https://en.wikipedia.org/wiki/Solar_Star
[59] United States / CPV Consortium / http://cpvconsortium.org/
[60] SEGS California Complex CSP Parabolic type plant / National Renewable Energy Laboratory: CSP Projects / https://www.nrel.gov/
[61] Solana Generating Station / National Renewable Energy Laboratory: CSP Projects / https://www.nrel.gov/
[62] Ivanpah Solar Power Facility / National Renewable Energy Laboratory: CSP Projects / https://www.nrel.gov/
[63] Crescent Dunes Solar Energy Project / National Renewable Energy Laboratory: CSP Projects / https://www.nrel.gov/
[64] Kimberlina Solar Thermal Energy Plant / Wikipedia / https://en.wikipedia.org/wiki/Kimberlina_Solar_Thermal_Energy_Plant
[65] Infinia begins commissioning 1.5 MW dish Stirling solar Concentrating Solar Power plant in Utah / 15-06-2013 / Helios CSP / http://helioscsp.com/
[66] Ocean Energy The Ocean is a Vast, Largely Untapped Energy Resource / Hawaiian Electric / https://www.hawaiianelectric.com/
[67] Current and future tidal power schemes / Wikipedia / https://en.wikipedia.org/wiki/Tidal_power#Current_and_future_tidal_power_schemes
[68] Ocean Thermal Energy Conversion (OTEC) / Natural Energy Laboratory of Hawaii Authority (NELHA) / http://nelha.hawaii.gov/
[69] Steamboat Complex (63.8 MW) / Richard Burdett (27 MW) / Galena II-III (45 MW) / OpenEI / https://openei.org
[70] Nevada Geothermal Power Plants / Geothermal Energy Association / http://www.geo-energy.org/
[71] Imperial Valley / BHE Renewables / https://www.bherenewables.com/
[72] California Geothermal Power Plants (PDF) / Geothermal Energy Association / http://www.geo-energy.org/
[73] Calpine: Americas’s largest geothermal energy producer / U.S. Department of Energy / http://energy.gov/
[74] Merchant Hydrogen Plant Capacities in North America / HYARC / Hydrogen Tools / https://www.h2tools.org/
[75] The Business case for Fuel Cells: Delivering Sustainable Value (PDF) / Thomas G.Benjamin Argonne National Laboratory; Jennifer Gangi, Fuel Cell and Hydrogen Energy Association; Sandra Curtin, Fuel Cell and Hydrogen Energy Association / U.S. Department of Energy / http://energy.gov/
[76] U.S. Biomass Power Facilities (PDF) / Biomass Power Association / http://usabiomass.org/
[77] Biodiesel / Biodiesel Magazine / http://www.biodieselmagazine.com/
[78] Biorefinery Locations / Renewable Fuels Association / http://www.ethanolrfa.org/
[79] U.S. Ethanol Plants / Ethanol Producer Magazine / http://www.ethanolproducer.com/
[80] Le Sueur (PDF) / American Biogas Council / https://americanbiogascouncil.org/
[81] Plainfield / Greenleaf Power / http://www.greenleaf-power.com/
[82] Gasification of Non-Recycled Plastics From Municipal Solid Waste In the United States / August 13, 2013. / Gershman, Brickner & Bratton, Inc.. / American Chemistry Council, Inc. (PDF) / https://plastics.americanchemistry.com/
[83] Alter NRG Plasma Gasification: The Next Generation of Waste-To-Energy Solutions (PDF) / Pronto Marketing / https://d2oc0ihd6a5bt.cloudfront.net/
[84] Large Industrial Users of Energy Biomass, September 2013 (PDF)/ Year 2013 / Publications / IEA Bioenergy Task 40 / http://bioenergytrade.org/
[85] Energy Recovery Council: 2016 Directory of Waste-to-energy Facilities (PDF) / Energy Recovery Council / http://energyrecoverycouncil.org/
[86] Burning landfill gas has environmental and economic benefits / Power / http://www.powermag.com/
[87] DOE Bioenergy Technologies Office (BETO) 2015 Project Peer Review (PDF) / U.S. Department of Energy / https://www.energy.gov/
[88] Projects / IEA Bioenergy Task 39: Commercializing Liquid Biofuels from Biomass / http://demoplants.bioenergy2020.eu/
[89] Thermogen switches technology to Zilkha / Anna Simet / March 12, 2014 / Biomass Magazine / http://biomassmagazine.com/
[90] US energy policy in the Trump Administration and 115th Congress (PDF) / January 2017 / EY / http://www.ey.com/
[91] The Trump Energy Plan: A Sea Change in U.S. Energy Policy / David Blackmon / November 14, 2017 / Shale Magazine / https://shalemag.com/
[92] The Trump Administration Keeps Trying to Sell Federal Land for Oil Drilling. But Nobody Wants It / TIME / http://time.com/
[93] United States withdrawal from the Paris Agreement / Wikipedia / https://en.wikipedia.org/wiki/United_States_withdrawal_from_the_Paris_Agreement
[94] Paris Climate Agreement: Everything You Need to Know / February 19, 2021 / NRDC / https://www.nrdc.org/
[95] 2021 U.S. Geothermal Power Production and District Heating Market Report (PDF) / July 2021 / NREL / https://www.nrel.gov/
The sources of charts and curves are specified under the images.
For more information about the energy industry in United States see here