
Contents
General State of the Economy
The Slovak Republic is located in Central Europe and borders Austria, the Czech Republic, Poland, Ukraine, and Hungary. Slovakia is a landlocked country. The country is home to about 5.5 million people with a population density of 111/km2. Slovakia is a parliamentary republic. The country became independent in 1993 following the splitting of Czech and Slovak Federative Republic. The capital of Slovakia is Bratislava, where about 450 thousand people live.
| Slovakia / the Slovak Republic | ||
|---|---|---|
| Capital: Bratislava | Density: 111/km2 | Currency: (€) (EUR) |
| Official languages: Slovak | Life expectancy at birth: 78.31 years | GDP (PPP): $173.582 billion (2021 est.) |
| National Day: 01 January | Area (land): 49,035 km2 | GDP - per capita (PPP): $31,900 (2021 est.) |
| Population: 5,460,185 (2022 est.) | Coastline: 0 km | Internet country code: .sk |
Source: [1,2,3,4,5]
Rating positions of Slovakia relative to other countries have been determined for an extensive list of economic, energy, innovative and educational indices, as well as for metrics reflecting the state of the environment. The economic indices include, for example, GDP per capita, annual average GDP growth, high-technology exports, and others. The list of energy indices includes proven reserves of oil, gas and coal, production-consumption ratio combined, and energy use, etc. Each of the indices has a ranked list of included member countries. Since the number of countries in each rating is different for each index, the positioning of the country of interest is displayed on a special chart, where the vertical axis is a uniform relative scale from 0 to 1, whereas the horizontal axis denominates the various indices and respective numbers relating to the descriptions given underneath.
Thus, in such a relative “0-1” diagram, the country’s position is marked with a dot in proportion to its location in the original rating list. If the country is among the leaders regarding the selected indicator, it will be marked close to 1 in the upper green zone on the relevant chart “0-1”, if the country is an outsider in the rating list, then it will be marked in the lower red zone of the chart “0-1”, etc.
Ranking position of Slovakia for list of economic indices:
| Sources: 1. GDP (purchasing power parity), 2020 est. / The World Factbook/Library/Central Intelligence Agency *228 2. GDP - per capita (PPP), 2020 / The World Factbook/Library/Central Intelligence Agency *229 3. Inflation rate (consumer prices), 2019 est. / The World Factbook/Library/Central Intelligence Agency *228 4. Charges for the use of intellectual property, receipts (BoP, current US$), 2020 / International Monetary Fund, Balance of Payments Statistics Yearbook, and data files. / License: CC BY-4.0 *88 5. The Global Competitiveness Index 2019 / Rankings / Reports / World Economic Forum *141 6. High-technology exports (current US$) 2019-2020 / United Nations, Comtrade database through the WITS platform / License: CCBY-4.0 / Data *134 7. 2021 Index of Economic Freedom / International Economies / The Heritage Foundation *178 8. Reserves of foreign exchange and gold, 2017 est. / The World Factbook / Library / Central Intelligence Agency *195 9. Annual average GDP growth in %, for the last 10 years (2011-2020) / World Bank national accounts data, and OECD National Accounts data files / License: CC BY-4.0 *206 10. Public debt (% of GDP), 2017 est. / The World Factbook / Library / Central Intelligence Agency (from smallest to largest) *210 * Total number of countries participating in ranking Figure 1. Economic Indices of Slovakia |
For most of the indicators shown in the chart, Slovakia is in the middle of the rankings. The relatively weak spots within Slovakia's economic indicators are Inflation rate, Annual average GDP growth, Charges for the use of intellectual property, where the country takes up a position just below the middle of the rankings. Slovakia has the best indices among the presented ones for GDP per capita and High-technology exports.
Energy Resources
Slovakia has no significant reserves of fossil fuels. For example, the share of coal reserves in Slovakia relative to the world's is 0.013%, natural gas – 0.007%, and oil even less [6]. In terms of tons of oil equivalent, according to 2022 data, conventional proved reserves by fuel type were: 87.1% – coal, 11.8% – gas, and 1.1% – gas (Fig.5).
Table 1. Fossil energy resources of Slovakia
| Resource /Explanations | Crude oil | Natural gas | Coal | Shale Gas | Tight Oil | Coalmine methane |
|---|---|---|---|---|---|---|
| Value | 9 | 14.158 | 135 | - | - | - |
| Unit | million bbl | billion cubic meter | million tonnes | - | - | - |
| Year | 2021 | 2021 | 2019 | - | - | - |
| Source | [3] | [3] | [3] | - | - | - |
Solar resource potential in Slovakia is also relatively low. In most of the country GHI is 3.0-3.3 kWh/m2/day, which means that the efficiency of solar power generation is not overwhelming. The situation with wind resources looks more promising. In the middle part of the country there are areas where the wind speed at a height of 50 m/s is more than 6 m/s, which is quite suitable for the location of industrial wind farms.
Table 2.Renewable energy resources of Slovakia
| Resource/ Explanations | Solar Potential (GHI)* | Wind Potential (50 м)* | Bio Potential (agricultural area) | Bio Potential (forest area) | Municipal Solid Waste |
|---|---|---|---|---|---|
| Value | 3.0-3.3 | <5.0 | 39.2 | 40.1 | 433 |
| Unit | kWh/m2/day | m/s | % of land area | % of land area | kg per capita |
| Year | 2020 | 2020 | 2020 | 2020 | 2020 |
| Source | [7] | [8] | [9] | [10] | [11] |
*for most of the territory of the countr
Below is a diagram of the wind speed distribution in the middle part of Slovakia at Telgart near Poprad, based on multi-year observations by the National Oceanic and Atmospheric Administration U.S. Department of Commerce.
TELGART (Latitude: 48.85, Longitude: 20.18), height: 10 m
Average speed: 3.91 m/s, Operational share: 63%
Wind speed, m/s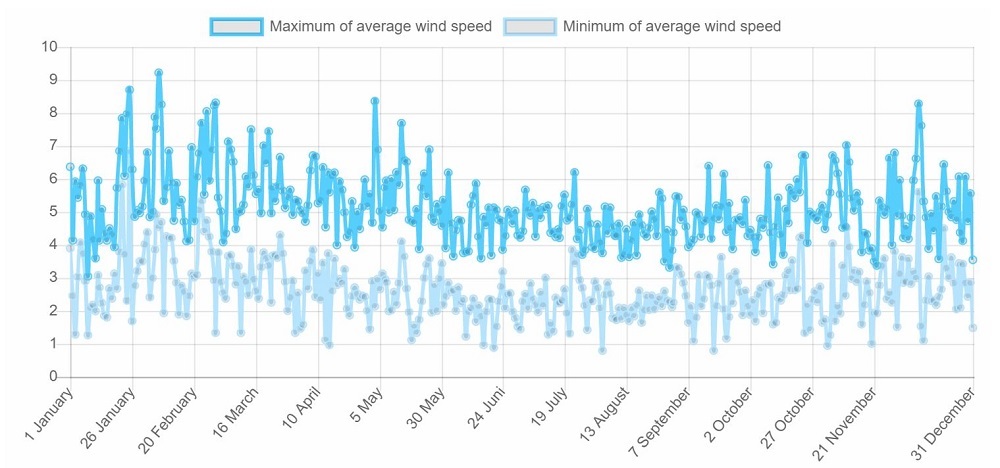
About 80% of the country's territory is covered by agricultural and forest areas. Industrial waste from these areas can provide a sufficient resource base for the development of various bioenergy sectors.
Energy Balance
According to [6], in 2021 in Slovakia the total production of primary energy was 0.247 Btu, while consumption was at the level of 0.744 Btu. The share of domestic production in primary energy consumption was 33%. Thus, Slovakia is a country critically dependent on energy imports. Primary energy consumption is dominated by nuclear and renewables – 32.3%, followed by gas – 27%, oil – 26%, and coal – 14.5%.
Source: U.S. Energy Information Administration (Dec 2022) / www.eia.gov
Figure 2. The production and consumption of fossil fuels in Slovakia (coal – left, gas – in the center, oil – right)
Over the last twenty years, the consumption of natural gas and coal in Slovakia has decreased significantly, while the consumption of oil has slightly increased. At the same time, consumption of oil and gas has exceeded domestic production many times.
Slovakia has been generating 25 to 26 TWh of electricity over the past 10 years, of which approximately 60% is provided by nuclear power. The share of electricity from renewable sources, excluding hydropower, has been growing, but remains modest. At the same time, this segment is dominated by energy generation from biomass and waste, which accounts for 75%.
Sources: U.S. Energy Information Administration (Dec 2022) / www.eia.gov | ||
| Figure 3. Electricity production in Slovakia |
In recent years, there has been a tendency in Slovakia to fully supply the country with electricity from domestic generation.
Graph of the energy indices of Slovakia is presented in the figure below:
| Sources: 1. Crude oil proved reserves, 2021 / International Energy Statistic/Geography / U.S. Energy Information Administration (Nov 2021)*98 2. Natural gas proved reserves 2021 / International Energy Statistic / Geography / U.S. Energy Information Administration (Nov 2021) *99 3. Total recoverable coal reserves 2019 / International Energy Statistic / Geography / U.S. Energy Information Administration (Nov 2021) *81 4. Combination production-consumption for Crude oil 2018 / International Energy Statistic / Geography / U.S. Energy Information Administration (Nov 2021) *219 5. Combination production-consumption for Natural gas 2019 / International Energy Statistic / Geography / U.S. Energy Information Administration (Nov 2021) *123 6. Combination production-consumption for Coal 2019 / International Energy Statistic / Geography / U.S. Energy Information Administration (Nov 2021) *128 7. Electricity – from other renewable sources (% of total installed capacity), 2017 est. / The World Factbook / Library / Central Intelligence Agency *170 8. GDP per unit of energy use (PPP per unit of oil equivalent), 2020 *66 Primary energy consumption - BP Statistical Review of World Energy 2021/BP;GDP (purchasing power parity) - The World Factbook/Library/Central Intelligence Agency 9. Energy use (primary energy use of oil equivalent per capita) 2020 *127 Primary energy consumption – BP Statistical Review of World Energy 2021; Population - United Nations, Department of Economic and Social Affairs, Population Division (2019). World Population Prospects 2019, custom data acquired via website. Retrieved 15 November 2021*66 10. The Global Energy Architecture Performance Index Report (EAPI) 2017 / Rankings / Reports / World Economic Forum 11. Electric power consumption (kWh per capita), 2016 *217 Electricity Consumption - The World Factbook / Library / Central Intelligence Agency; Population - United Nations, Department of Economic and Social Affairs, Population Division (2019). World Population Prospects 2019, custom data acquired via website. Retrieved 15 November 2021 12. Combination of electricity production-consumption (kWh)/The World Factbook/Library/Central Intelligence Agency *216 * Total number of countries participating in ranking Figure 4. Energy indices of Slovakia |
Slovakia's limited fossil resources are definitely reflected in the energy index chart, where the country is positioned at the bottom of the chart for fossil fuel-related indexes. In terms of such indices as The Global Energy Architecture Performance Index, Energy use, and Electric power consumption Slovakia is among the leaders. Slovakia is not well- positioned in the Combination of electricity production-consumption index, but in the last three years, due to a decrease in total electricity consumption and an increase in renewable generation, the situation has improved.
Energy Infrastructure
Slovakia's oil and gas infrastructure includes several small fields in the west of the country, oil and gas main pipelines running from the Ukrainian border in the east to the borders in the west. The gas pipeline branches off to Austria and the Czech Republic, and the oil pipeline branches off to the oil refinery Slovnaft and the Czech Republic. There are also several gas storage facilities, several regional and gas-distributing pipelines and a network of oil storages on the territory of Slovakia. The only large oil refinery Slovnaft is located in Bratislava and has a capacity of 110,000 bpd [12,13]. 
Figure 5. Basic infrastrucural facilities of the fossil fuel sector in Slovakia (click on the map to view a PDF version)
As mentioned above, electricity generation in Slovakia is largely provided by nuclear power plants located in the west of the country. Bohunice nuclear power plant has a starting total capacity of 1010 MW, and Mochovce nuclear power plant has a starting total capacity of 940 MW (the first two units). The third unit of the Mochovce plant was put into test operation at the end of 2022 [14].
In addition, Slovakia has several Hydro power plants, the largest of which is The Gabčíkovo-Nagymaros Dams on the Danube with a capacity of 720 MW, as well as a number of Pumped storage plants.
Apart from that, power generation in the country is provided by several gas and coal power plants.
The national power grid is represented by lines with a capacity of 400 KV.
Figure 6. Electricity production in Slovakia (click on the map to view a PDF version)
Slovakia's renewable energy industry is represented primarily by a large number of medium-sized bioenergy companies. The production of electricity by burning biomass, pellets, and biogas has developed dynamically. In addition, there are several companies which use more modern technologies – biomethane production, biomass gasification, production of second-generation bioethanol. Rich forest resources of Slovakia, as well as significant agricultural areas contribute to a good resource base for bioenergy [15,16]. 
Figure 7. Renewable energy in Slovakia (click on the map to view a PDF version)
In recent years, a large number of solar power plants have been built in southern Slovakia, however, the amount of solar power generation is still insignificant. Obviously, wind power has not been properly developed in Slovakia, despite the existence of areas with high wind speeds.
In December 2019, the Slovak government adopted a Slovak national energy and climate plan. In this document, the total share of renewable energy for 2030 is planned to amount to 19.2%, below the EU's 2030 goal of 32%. By that same year, Slovakia's share of renewable energy for transportation is projected at 14%. Approximate investments in the development of this program are expected to be 3.3 billion euros. The plan is expected to be updated by mid-2023 [17].
Education and Innovation
The following chart shows the position of Slovakia in terms of education and innovation:
Sources: 1. The Global Innovation Index 2021, Rankings / Knowledge / World Intellectual Property Organization / Cornell University, INSEAD, and WIPO (2021): Energizing the World with Innovation. Ithaca, Fontainebleau, and Geneva *132 2. Patent Grants 2011-2020, resident & abroad / Statistical country profiles / World Intellectual Property Organization *185 3.Patents in Force 2020 / Statistical country profiles / World Intellectual Property Organization *109 4. QS World University Rankings 2022 *97 5. SCImago Country Rankings (1996-2020) / Country rankings / SCImago, (n.d.). SIR-SCImago Journal & Country Rank [Portal]. Retrieved 17 Nov 2021 *240 6. Internet users in 2018 / The World Factbook / Central Intelligence Agency *229 7. Internet users in 2018 (% Population) / The World Factbook / Central Intelligence Agency *229 8. Government expenditure on education, total (% of GDP), 2019 / United Nations Educational, Scientific, and Cultural Organization (UNESCO) Institute for Statistics. License: CCBY-4.0 / Data as of September 2021*177 9. Research and development expenditure (% of GDP), 2018 / UNESCO Institute for Statistics. License: CCBY-4.0 / Data *119 10. Scientific and technical journal articles, 2018 / National Science Foundation, Science and Engineering Indicators. License: CCBY-4.0 / Data *197 * Total number of countries participating in ranking | ||
| Figure 8. The indices of education and innovation in Slovakia |
Slovakia shows no extremes in the education and innovation sector - almost all indices are located in the middle part of the chart. Among them, the best indicators for Slovakia relate to SCImago Country Rankings, Internet users, and Scientific and technical journal articles, and the worst to Forest area change and Government expenditure on education (% of GDP).
Ecology and Environment Protection
Indicators related to environmental issues are presented in the following diagram:
| Sources: 1. CO2 total emission by countries 2020 / European Commission / Joint Research Centre (JRC) / Emission Database for Global Atmospheric Research (EDGAR)*208 2. CO2 per capita emission 2020/European Commission/Joint Research Centre (JRC) / Emission Database for Global Atmospheric Research (EDGAR) *208 3. Forest area 2020 (% of land area) / The Global Forest Resources Assessment 2020 / Food and Agriculture Organization of the United Nations *234 4. Forest area change 2010-2020 (1000 ha/year) / The Global Forest Resources Assessment 2020 / Food and Agriculture Organization of the United Nations *234 5. The Environmental Performance Index (EPI) 2020 / Rankings / Yale Center for Environmental Law & Policy / Yale University *180 6. Annual freshwater withdrawals (m3 per capita), 2017 *179 Annual freshwater withdrawals, total (billion m3), 2017 – Food and Agriculture Organization, AQUASTAT data. /License: CC BY-4.0; Population – United Nations, Department of Economic and Social Affairs, Population Division (2019). World Population Prospects 2019, custom data acquired via website. Retrieved 15 November 2021 7. The National Footprint Accounts 2017 (Biocapacity Credit / Deficit) / Global Footprint Network *188 8. Methane emissions (kt of CO2 equivalent), 2018 / Data for up to 1990 are sourced from Carbon Dioxide Information Analysis Center, Environmental Sciences Division, Oak Ridge National Laboratory, Tennessee, United States. Data from 1990 are CAIT data: Climate Watch. 2020. GHG Emissions. Washington, DC: World Resources Institute. Available at: License : Attribution-NonCommercial 4.0 International (CC BY-NC 4.0) *191 9. The Climate Change Performance Index (CCPI) 2022 / Overall Results / Jan Burck, Thea Uhlich, Christoph Bals, Niklas Höhne, Leonardo Nascimento / Germanwatch, NewClimate Institute & Climate Action Network *60 * Total number of countries participating in ranking | ||
| Figure 8. Environmental Indices of Slovakia |
According to the chart above, even though most environmental indices are below the global average, the overall state of the environment in Slovakia is not critical. In particular, the country has rather high positions in the rankings related to forest area change, methane emissions, and especially The Environmental Performance Index (EPI) 2020. On the other hand, for indicators such as CO2 per capita emission, Annual freshwater withdrawals, The National Footprint Accounts Slovakia's position in the rankings is significantly below average.
References
[1] List of sovereign states and dependencies by area / Wikipedia / en.wikipedia.org/wiki/List_of_sovereign_states_and_dependencies_by_area
[2] List of countries and dependencies by population density / Wikipedia / en.wikipedia.org/wiki/List_of_countries_and_dependencies_by_population_density
[3] Slovakia / The world factbook / Library / Central Intelligence Agency / www.cia.gov
[4] GDP, PPP (constant 2011 international $) / World Bank, International Comparison Program database. License: CC BY-4.0 / Data / The World Bank / www.worldbank.org
[5] GDP per capita, PPP (current international $) / World Bank, International Comparison Program database. License: CC BY-4.0 / Data / The World Bank / www.worldbank.org
[6] Slovakia / Geography / U.S. Energy Information Administration (February 2023) / www.eia.gov/beta/international/
[7] Solar resource data obtained from the Global Solar Atlas, owned by the World Bank Group and provided by Solargis / Global Solar Atlas / globalsolaratlas.info
[8] Wind Map / Global Wind Atlas 2.0, a free, web-based application developed, owned and operated by the Technical University of Denmark (DTU) in partnership with the World Bank Group, utilizing data provided by Vortex, with funding provided by the Energy Sector Management Assistance Program (ESMAP). For additional information: globalwindatlas.info
[9] Agricultural land (% of land area) /Food and Agriculture Organization, electronic files and web site. License: CC BY-4.0 / Data / The World Bank / www.worldbank.org
[10] Forest area (% of land area) /Food and Agriculture Organization, electronic files and web site. License: CC BY-4.0 / Data / The World Bank / www.worldbank.org
[11] World Bank What a Waste / Data / The World Bank / www.worldbank.org
[12] theodora.com/pipelines/index.html
[13] abarrelfull.wikidot.com
[14] en.wikipedia.org/wiki/Category:Nuclear_power_stations_in_Slovakia
[15] www.s2biom.eu/images/Publications/WP8_Country_Outlook/Final_Roadmaps_March/S2Biom-SLOVAKIA-biomass-potential-and-policies.pdf
[16] www.fao.org/uploads/media/biomass_maps_databases.pdf
[17] www.iea.org/policies/7963-slovak-national-energy-and-climate-plan
The sources of charts and curves are specified under the images.
For more information about the energy industry in Slovakia see here