
Contents
General State of the Economy
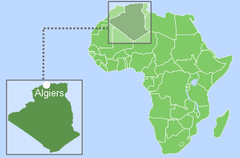
Algeria or officially Algeria’s People’s Democratic Republic is located in northwestern Africa between Morocco in the west and Tunisia and Libya in the east. In terms of the size of the territory, Algeria is 10th in the world, and according to the population density, the country is 209th [1,2]. The total length of the country's coastline is 998 km [3]. According to 2022 statistics, the country is home to around 44 million people [3].
| People's Democratic Republic of Algeria / لجزائر | ||
|---|---|---|
| Capital: Algiers | Density: 19/km2 | Currency: Algerian dinar (DZD) |
| Official languages: Arabic, Berber | Life expectancy at birth: 74.45 years | GDP (PPP): $628.990 billion (2023 est.) |
| National Day: 01 November | Area: 2,381,741 km2 | GDP - per capita (PPP): $30,681 (2023 est.) |
| Population: 45,400,000 (2022 est.) | Coastline: 1,622 km | Internet country code: .dz لجزائر. |
Source: [1,2,3,4,5]
Four out of ten indices characterizing the economic situation in the country are at the bottom part of the diagram shown in Figure 1.
| Sources: 1. GDP (purchasing power parity), 2020 est. / The World Factbook/Library/Central Intelligence Agency *228 2. GDP - per capita (PPP), 2020 / The World Factbook/Library/Central Intelligence Agency *229 3. Inflation rate (consumer prices), 2019 est. / The World Factbook/Library/Central Intelligence Agency *228 4. Charges for the use of intellectual property, receipts (BoP, current US$), 2020 / International Monetary Fund, Balance of Payments Statistics Yearbook, and data files. / License: CC BY-4.0 *88 5. The Global Competitiveness Index 2019 / Rankings / Reports / World Economic Forum *141 6. High-technology exports (current US$) 2019-2020 / United Nations, Comtrade database through the WITS platform / License: CCBY-4.0 / Data *134 7. 2021 Index of Economic Freedom / International Economies / The Heritage Foundation *178 8. Reserves of foreign exchange and gold, 2017 est. / The World Factbook / Library / Central Intelligence Agency *195 9. Annual average GDP growth in %, for the last 10 years (2011-2020) / World Bank national accounts data, and OECD National Accounts data files / License: CC BY-4.0 *206 10. Public debt (% of GDP), 2017 est. / The World Factbook / Library / Central Intelligence Agency (from smallest to largest) *210 * Total number of countries participating in ranking Figure 1. Economic Indices of Algeria |
Between 1994 and 2020, the country experienced rapid growth in GDP at purchasing power parity, amounting to $468 million in 2020 [3,4]. For this indicator, Algeria is 42th in the world, behind Iran and the United Arab Emirates, but ahead of Iraq, Qatar and Morocco [3]. According to GDP at purchasing power parity per capita, Algeria shows a world average figure - $10 700 in 2020 [3].The inflation rate in 2019 was 1.9% compared to 6.4% in 2016 [3]. The basis of Algeria’s exports are hydrocarbons. The dominant economic partners are China, France and Italy.
According to the Global Competitiveness Report, presented by the World Economic Forum in 2019, Algeria is 89th, out of an estimated total of 141 countries. This rating reflects the effectiveness of the use of the country’s own resources for sustainable development. In addition to a number of economic indicators this index also takes into account such variables as education, health, level of innovation, etc.
In the list of countries that export high-tech products in 2019-2020, the country was 119th out of 134 countries. According to the Index of Economic Freedom, which is based on freedom of business, freedom from government action, property protection, and freedom from corruption, Algeria was 162nd in 2021, out of the 178 countries considered, behind Tunisia and Angola. In terms of reserves of foreign exchange and gold Algeria is 26th out of 195 countries, ahead of the United Arab Emirates and Libya. According to the indicator for the average GDP growth in percentage over the last 10 years, in 2020 the country was 128th out of 206 countries. In terms of public debt, calculated as a percentage of the country’s GDP, Algeria was ranked 170th out of 210 countries considered in 2017.
Energy Resources
Algeria has sufficiently large and varied reserves of fossil resources (Table 1), but the main resources of the country are oil and gas. These types of resources are represented by reserves of traditional oil, as well as tight oil, natural gas and shale gas.
In terms of tons of oil equivalent, in 2021 proved reserves of conventional hydrocarbons in Algeria were: gas – 70.4%, oil – 28.9%, coal – 0.7% (Fig.5). The unconventional natural resource matrix looks much different: shale gas – 96%, tight oil – 4% (Fig. 5).
Table 1. Fossil energy resources of Algeria
| Resource / Explanations | Crude oil* | Natural gas* | Coal* | Shale Gas** | Tight Oil** |
|---|---|---|---|---|---|
| Value | 12.2(0.72%) | 159(2.19%) | 65(0.01%) | 706.9 | 5.7 |
| Unit | billion barrels | Tcf | million short tons | Tcf | billion barrels |
| Year | 2021 | 2020 | 2021 | 2013 | 2013 |
| Source | [7] | [7] | [7] | [8] | [8] |
*share of the country’s reserves in world total is provided in brackets
**unproved technically recoverable
According to information presented in [3], as of the beginning of 2021, oil reserves in the country amounted to 12.2 billion barrels, and gas reserves were 4.503 Tcm. According to the BP report, from 1998 to 2020, the total proved oil reserves grew from 11.3 to 12.2 billion barrels, and natural gas reserves decreased from 3.9 Tcm to 4.3 Tcm in 2019 [6]. Coal reserves were estimated at 65 million short tons in 2021 [7].
Algeria has small reserves of shale (tight) oil – about 5.7 billion barrels and substantial reserves of shale gas – 706.9 Tcf, according to 2013 data [8].
Algeria has a significant potential for the development of renewable energy (Table 2).
Table 2. Renewable energy resources of Algeria
| Resource/ Explanations | Solar Potential (DNI)* | Wind Potential (50 м)* | Hydro energy Potential** | Bio Potential (agricultural area) | Bio Potential (forest area) | Municipal Solid Waste |
|---|---|---|---|---|---|---|
| Value | 5.5 - 6.8 | 6.0 - 7.0 | 12 | 17.4 | 0.8 | 0.84 |
| Unit | kWh/m2/day | m/s | TWh/year | % of land area | % of land area | kg/capita/day |
| Year | 2018 | 2018 | 2008 | 2020 | 2020 | 2016 |
| Source | [9] | [10] | [11] | [12] | [13] | [14] |
*for most of the territory of the country
** gross theoretical hydropower potential
Due to its favourable geographical location, Algeria has a significant potential for the development of solar energy. The most typical level of direct normal irradiation is 5.5-6.8 kW/m²/ day, and it can reach the level of over 6.8-7.4 kW/m²/day in the southeastern part of the country, between the provinces of Tamanghasset and Illizi [10]. Wind speed in most parts of Algeria is 6.0-7.0 m/s, and the most common wind speed is 7.0-8.0 m/s per year at 50 m is distributed in central and southeastern parts of the country, between the provinces of Tamanghasset and Illizi [11].
The country’s gross theoretical hydropower potential is 12 TWh/yr. Only 0.8% of the county is forested with around 17.4% covered by agricultural land [13,14].
The level of generation of municipal waste in Algeria – 0.84 Kg/capita/day, and by 2025 it can reach the level of 1.45 Kg/capita/day [14].
Energy Balance
According to BP's report, total primary energy consumption in Algeria in 2021 amounted to 2.46 exajoules, about 67% of which was natural gas, 32.1% – oil, 0.8% – coal, 0.4% – renewable energy [6].
The production of oil has remained stable since 2006, and in 2017 it was 1 641 thousand barrels/day [7]. In 2021 it was at the level of 1 353 thousand barrels/day according to [6], and 1.414 thousand barrels/day according to [3].
The volume of consumption of this resource demonstrated stable growth (Fig. 2), and in 2019 reached the level of 451 thousand barrels/day, compared to 252 thousand barrels/day in 2006 [7]. According to BP in 2021 this number was 403 thousand barrels/day [6]. As reported in [3], the volume of oil exports from Algeria in 2018 amounted to 633 500 bbl/d.
Source: U.S. Energy Information Administration (Sep 2023) / https://www.eia.gov
Figure 2. The Production and Consumption of fossil fuels in Algeria (coal –left, in the center – gas, oil – right)
Internal gas production in 2019 was 3 103 Bcf, demonstrating a decline, compared to the previous year [7]. In 2021, according to [6], gas production amounted to 100.8 billion m3, and in 2019 according to [3] – 87.8 bcm.
Gas consumption in Algeria has been growing since 2001; in 2017, the country consumed 1 458 Bcf [17], and in 2019 it reached the level of 1 658 Bcf [6].
In 2020 Algeria exported 1,370 Bcf of natural gas, the main importers were the European countries, followed by the Middle East and Nord Africa [16].
Coal consumption has been steadily declining since 2008, and in 2019 reached a level of 16 thousand short tons, compared to 288 thousand short tons in 2008 [7].
Historically, Algeria has a high share of fossil fuels in electricity production (Fig. 3).
Sources: U.S. Energy Information Administration (Sep 2023) / https://www.eia.gov/ | ||
| Figure 3. Electricity Generation in Algeria |
In 2019 Algeria produced about 76.69 GWh of electricity, of which 98.9% was by fossil fuels, 0.2% by hydropower, and 0.9% by other renewable sources (Fig. 6).
Algeria’s position in the comparative diagram of energy index is shown in Fig. 4.
As mentioned previously, the country has a potential of traditional fossil resources, which provides a high level of indices associated with crude oil and natural gas. At the same time GDP per unit of energy use is at the level of the world average – 44th place out of 66 countries considered, while energy consumption per capita is much lower – 51st out of 66 countries.
| Sources: 1. Crude oil proved reserves, 2021 / International Energy Statistic/Geography / U.S. Energy Information Administration (Nov 2021)*98 2. Natural gas proved reserves 2021 / International Energy Statistic / Geography / U.S. Energy Information Administration (Nov 2021) *99 3. Total recoverable coal reserves 2019 / International Energy Statistic / Geography / U.S. Energy Information Administration (Nov 2021) *81 4. Combination production-consumption for Crude oil 2018 / International Energy Statistic / Geography / U.S. Energy Information Administration (Nov 2021) *219 5. Combination production-consumption for Natural gas 2019 / International Energy Statistic / Geography / U.S. Energy Information Administration (Nov 2021) *123 6. Combination production-consumption for Coal 2019 / International Energy Statistic / Geography / U.S. Energy Information Administration (Nov 2021) *128 7. Electricity – from other renewable sources (% of total installed capacity), 2017 est. / The World Factbook / Library / Central Intelligence Agency *170 8. GDP per unit of energy use (PPP per unit of oil equivalent), 2020 *66 Primary energy consumption - BP Statistical Review of World Energy 2021/BP;GDP (purchasing power parity) - The World Factbook/Library/Central Intelligence Agency 9. Energy use (primary energy use of oil equivalent per capita) 2020 *127 Primary energy consumption – BP Statistical Review of World Energy 2021; Population - United Nations, Department of Economic and Social Affairs, Population Division (2019). World Population Prospects 2019, custom data acquired via website. Retrieved 15 November 2021*66 10. The Global Energy Architecture Performance Index Report (EAPI) 2017 / Rankings / Reports / World Economic Forum 11. Electric power consumption (kWh per capita), 2016 *217 Electricity Consumption - The World Factbook / Library / Central Intelligence Agency; Population - United Nations, Department of Economic and Social Affairs, Population Division (2019). World Population Prospects 2019, custom data acquired via website. Retrieved 15 November 2021 12. Combination of electricity production-consumption (kWh)/The World Factbook/Library/Central Intelligence Agency *216 * Total number of countries participating in ranking Figure 4. Energy indices of Algeria |
The share of renewable energy in electricity production in Algeria is about 0.9%, and in 2017 the country was 129th out of 170 countries selected for consideration.
In the Energy Architecture Performance Index 2017, which is based first on the level of economic growth, environmental safety, and energy independence of the country, including access to energy, Algeria is 81st in the world, ahead of Egypt.
In terms of electricity consumption per capita, the country is 132nd in the world; however, for the indicator of combination of electricity production-consumption, Algeria is 32nd in the ranked list of 216 countries.
Energy Infrastructure
Algeria's energy infrastructure is very diverse (Figure 5). The main oil fields are located on the mainland of the country since offshore exploration of fields has practically not been conducted. The HassiMessaoud field is the largest, and according to experts’ calculations, it has reserves of 6.4 billion barrels. As for natural gas deposits, more than half of the proven reserves (85 trillion m3) are situated in HassiR'me [16]. A well-developed pipeline chain connects Algeria's main oil fields with terminals and refineries. In addition to domestic pipelines, three transcontinental natural gas pipelines connect Algeria with Europe. There are two supply gas pipelines to Spain, one to Italy. The largest of them is the TRANS-Mediterranean (Enrico Mattei) with a capacity of 30.2 billion m3/year [17].
Due to its proximity to the sea, six major oil terminals and three LNG export terminals are located in the North of Algeria. The largest of them is Arzew LNG Complex, owned by the state-owned company Sonatrach, [18,19, 20].
The oil refining industry is represented by five plants. Two of them are situated in non-direct proximity to the fields and the rest are located near terminals to facilitate export deliveries. The largest Sonatrach - Skikda Oil Refinery with an installed capacity of 356,500 barrels/day is also owned by Sonatrach [21].

Figure 5. Basic Infrastructure facilities of the fossil fuel sector in Algeria
The state-owned Sonatrach company owns almost 80% of the country's total fossil fuel production, making it the largest oil and gas company not only in the country, but also in Africa. A number of European companies are also represented in the country's energy market: Spanish Cepsa, British BP, Italian Eni, and French Total.
As mentioned earlier, electricity generation in Algeria is mainly based on fossil fuels. Along with mixed-type power plants, there are gas-fired power plants in the country, including KoudietEddraouch and Terga, with an installed capacity of 1,200 MW (Fig. 6) [22,23]. The largest mixed-type power plant is HadjretEn-Nouss, with three blocks of 420 MW [24].

Figure 6. Electricity and Renewable energy in Algeria
Renewable electricity is represented by solar, wind, and hydroelectric power plants, including SCC HassiR'mel (CSP Parabolic type plants), Kabertene Wind power plant, and ZiamaMansouriah Hydro Power Plant, respectively. Algeria's leading electricity producer is Sonelgaz. The company’s projected additional domestic production capacity over the 2018-2028 period is estimated at 18,749 MW. By 2028, the total length of the power transmission network should cover 52,207 km [27]. The renewable energy program developed by the Ministry of Energy of Algeria will provide for the installation of renewable energy with a generation capacity of about 22,000 MW by 2030 [28]. It should be noted that the implementation of projects is complicated due to the lack of sufficient investment from the state, and difficulties in attracting new ones. It is also worth noting that oil and gas facilities in the In Amenas region have been targeted by militants, which also negatively affects the country's investment climate.
Education and Innovation
The set of indices reflecting the position of Algeria among other countries in the field of education and innovation can be seen in Figure 7. In the country ranking in accordance with the Global innovation index in 2021, Algeria was 120th.
According to the number of patents granted to Algerian residents, both inside the country and abroad, the country ranks 93rd in the world. Similarly, by the number of patents in force, the country was 51st in the world.
Algeria is well positioned when considering the number of publications of specialists in scientific and technological journals — 51st place out of 197 countries considered. It is also regarded highly by the Scimago Journal and Country Rank (57th place).
In terms of the amount of government expenditure on research and development as a percentage of GDP, the country is 57th in the world.
Sources: 1. The Global Innovation Index 2021, Rankings / Knowledge / World Intellectual Property Organization / Cornell University, INSEAD, and WIPO (2021): Energizing the World with Innovation. Ithaca, Fontainebleau, and Geneva *132 2. Patent Grants 2011-2020, resident & abroad / Statistical country profiles / World Intellectual Property Organization *185 3.Patents in Force 2020 / Statistical country profiles / World Intellectual Property Organization *109 4. QS World University Rankings 2022 *97 5. SCImago Country Rankings (1996-2020) / Country rankings / SCImago, (n.d.). SIR-SCImago Journal & Country Rank [Portal]. Retrieved 17 Nov 2021 *240 6. Internet users in 2018 / The World Factbook / Central Intelligence Agency *229 7. Internet users in 2018 (% Population) / The World Factbook / Central Intelligence Agency *229 8. Government expenditure on education, total (% of GDP), 2019 / United Nations Educational, Scientific, and Cultural Organization (UNESCO) Institute for Statistics. License: CCBY-4.0 / Data as of September 2021*177 9. Research and development expenditure (% of GDP), 2018 / UNESCO Institute for Statistics. License: CCBY-4.0 / Data *119 10. Scientific and technical journal articles, 2018 / National Science Foundation, Science and Engineering Indicators. License: CCBY-4.0 / Data *197 * Total number of countries participating in ranking Figure 7. The indices of education and innovation in Algeria |
The Hassi-Messaoud University and the University of Western Cape are actively involved in the research in the field of associated petroleum gas. The Université de M'hamed Bougara Boumerdes and Sonatrach are publishing scientific papers in the field of extraction and processing of unconventional oil.
The Université de M'hamed Bougara Boumerdes, Sonatrach and the Algerian Petroleum Institute are engaged in research in the field of non-traditional oil production, including directional drilling and hydro-cracking.
In the field of synthetic fuel development – the University of Science and Technology Houari Boumediene (USTHB) and the Université Ferhat Abbas Sétif 1.
Research and development in the field of bioenergy is being carried out by the University of Hadj Lakhdar.
A large number of Algerian universities conduct research in the field of energy production from renewable sources. In the field of wind and solar energy – the Badji Mokhtar University, the Center of Renewable Energy Development (CDER) and the Ecole Nationale Polytechnique.
Ecology and Environment Protection
A diagram of environmental indices is shown in Figure 8. The ecological situation in Algeria cannot be called favorable. Most of the indicators are located in the lower part of the chart.
Algeria has a high level of methane emissions, CO2 emissions. Although there is a positive trend in forest area change, in terms of the ecological footprint on a global scale, Algeria is a debtor, demonstrating one of the lowest indicators among African countries.
The situation is brightened, however, by a relatively high valuation of Algeria in the Environmental Performance Index rankings (EPI) 2020, which focuses primarily on assessing the environmental performance of national governments. In this rating Algeria is ahead of Nigeria and is 84th out of 180 member countries and demonstrates a positive trend.
| Sources: 1. CO2 total emission by countries 2020 / European Commission / Joint Research Centre (JRC) / Emission Database for Global Atmospheric Research (EDGAR)*208 2. CO2 per capita emission 2020/European Commission/Joint Research Centre (JRC) / Emission Database for Global Atmospheric Research (EDGAR) *208 3. Forest area 2020 (% of land area) / The Global Forest Resources Assessment 2020 / Food and Agriculture Organization of the United Nations *234 4. Forest area change 2010-2020 (1000 ha/year) / The Global Forest Resources Assessment 2020 / Food and Agriculture Organization of the United Nations *234 5. The Environmental Performance Index (EPI) 2020 / Rankings / Yale Center for Environmental Law & Policy / Yale University *180 6. Annual freshwater withdrawals (m3 per capita), 2017 *179 Annual freshwater withdrawals, total (billion m3), 2017 – Food and Agriculture Organization, AQUASTAT data. /License: CC BY-4.0; Population – United Nations, Department of Economic and Social Affairs, Population Division (2019). World Population Prospects 2019, custom data acquired via website. Retrieved 15 November 2021 7. The National Footprint Accounts 2017 (Biocapacity Credit / Deficit) / Global Footprint Network *188 8. Methane emissions (kt of CO2 equivalent), 2018 / Data for up to 1990 are sourced from Carbon Dioxide Information Analysis Center, Environmental Sciences Division, Oak Ridge National Laboratory, Tennessee, United States. Data from 1990 are CAIT data: Climate Watch. 2020. GHG Emissions. Washington, DC: World Resources Institute. Available at: License : Attribution-NonCommercial 4.0 International (CC BY-NC 4.0) *191 9. The Climate Change Performance Index (CCPI) 2022 / Overall Results / Jan Burck, Thea Uhlich, Christoph Bals, Niklas Höhne, Leonardo Nascimento / Germanwatch, NewClimate Institute & Climate Action Network *60 * Total number of countries participating in ranking Figure 8. Environmental Indices of Algeria |
According to The Environmental Vulnerability Index, which is based on years of observations and 50 indicators, which include for example, changing climatic characteristics or the quality of water resources, waste volumes, oil spills and other hazardous substances, etc. Algeria is 74th, and is characterized as "vulnerable". At the same time, the situation is aggravated by the fact that Algeria is 51st in the Climate Change Performance Index (CCPI) 2022, which consists of 60 positions and includes 61 countries responsible for more than 90% of global energy-related CO2 emissions.
References
[1] List of sovereign states and dependencies by area / Wikipedia / https://en.wikipedia.org/wiki/List_of_sovereign_states_and_dependencies_by_area
[2] List of countries and dependencies by population density / Wikipedia / https://en.wikipedia.org/wiki/List_of_countries_and_dependencies_by_population_density
[3] Algeria / The world factbook / Library / Central Intelligence Agency / https://www.cia.gov/
[4] GDP, PPP (constant 2017 international $) / World Bank, International Comparison Program database. License: CC BY-4.0/ Data/ The World Bank/ http://www.worldbank.org/
[5] GDP, PPP (constant 2017 international $) per capita / World Bank, International Comparison Program database. License: CC BY-4.0/ Data/ The World Bank/ http://www.worldbank.org/
[6] BP Statistical Review of World Energy 2019 - 2021 (PDF)/ BP/ https://www.bp.com/
[7] International Energy Statistic / Geography / U.S. Energy Information Administration / www.eia.gov/beta/international/
[8] World Shale Resource Assessments / U.S. Energy Information Administration (September 24, 2015) / https://www.eia.gov/
[9] Solar resource data obtained from the Global Solar Atlas, owned by the World Bank Group and provided by Solargis/ Global Solar Athlas/ http://globalsolaratlas.info/
[10] Wind Map/ Global Wind Atlas 2.0, a free, web-based application developed, owned and operated by the Technical University of Denmark (DTU) in partnership with the World Bank Group, utilizing data provided by Vortex, with funding provided by the Energy Sector Management Assistance Program (ESMAP). For additional information: https://globalwindatlas.info
[11] 2010 Survey of Energy Resources (PDF)/ World Energy Council/ www.worldenergy.org/
[12] Agricultural land (% of land area)/ Food and Agriculture Organization, electronic files and web site. License: CC BY-4.0/ Data/ The World Bank/ http://www.worldbank.org
[13] Forest area (% of land area)/Food and Agriculture Organization, electronic files and web site. License: CC BY-4.0/ Data/ The World Bank/ http://www.worldbank.org/
[14] World Bank What a Waste/ Data/ The World Bank/ http://www.worldbank.org
[15] Hassi Messaoud oil field / Wikipedia / en.wikipedia.org/wiki/Hassi_Messaoud_oil_field
[16] Hassi R'Mel gas field / Wikipedia / en.wikipedia.org/wiki/Hassi_R%27Mel_gas_field
[17] North Africa Pipelines / https://www.theodora.com/
[18] Arzew-GL1Z LNG Plant Algeria / Global Energy Observatory / http://globalenergyobservatory.org/
[19] Arzew-GL2Z LNG Plant Algeria / Global Energy Observatory / http://globalenergyobservatory.org/
[20] Arzew LNG Terminal Expansion / LNG Terminals In Africa/ / A Barrel Full / http://abarrelfull.wikidot.com/home
[21] Oil refineries in Algeria / BACKGROUND REFERENCE: ALGERIA / Geography/ U.S. Energy Information Administration (March 25, 2019)/ www.eia.gov
[22] Koudiet Eddraouch CCGT Power Plant Algeria / Global Energy Observatory / http://globalenergyobservatory.org/
[23] Terga CCGT Power Plant Algeria / Global Energy Observatory / http://globalenergyobservatory.org/
[24] Hadjret En-Nouss CCGT Power Plant Algeria / Global Energy Observatory / http://globalenergyobservatory.org/
[25] Hassi R'Mel integrated solar combined cycle power station / Wikipedia / en.wikipedia.org/wiki/Hassi_R%27Mel_integrated_solar_combined_cycle_power_station
[26] Wind farm Kabertene / Wikimapia / wikimapia.org/35734284/Wind-farm-Kabertene
[27] Ziama Mansouriah / jaZairess, Fodil SPublié dans El Watan le 05 - 07 - 2004 / www.djazairess.com
[28] Plan de developpement 2018-2028 / Sonelgaz / www.sonelgaz.dz
[29] Energies Nouvelles, Renouvelables et Maitrise de l’Energie / Ministère de l'énergie / www.energy.gov.dz
The sources of charts and curves are specified under the images.
For more information about the energy industry in Algeria see here