

Contents
General State of the Economy
Ivory Coast, officially the Republic of Côte d'Ivoire, is a country located on the south coast of West Africa. Côte d’Ivoire is bounded by Guinea to the northwest, Liberia to the west, Mali to the northwest, Burkina Faso to the northeast, and Ghana to the east. On the south Côte d’Ivoire is washed by the Atlantic Ocean, with a total coastline of 590 km.
According to 2023 statistics, Ivory Coast is home to about 29 million people. In terms of population density the country is 129th in the world from 249 countries considered. The national capital and largest city is the port city of Abidjan. The city of Yamoussoukro is located in the center of the country is viewed as a legislative capital of Côte d’Ivoire. The political form of government is a presidential republic and the administrative map of the country is divided into 12 districts and 2 autonomous districts. French is the official language of the Republic, with dozens of different local indigenous languages spoken in the country [1,2,3].
| Ivory Coast / Republic of Côte d'Ivoire | ||
|---|---|---|
| Capital: Yamoussoukro/Abidjan | Density: 91.1/km2 | Currency: West African CFA franc (XOF) |
| Official languages: French | Life expectancy at birth: 59.03 years | GDP (PPP): $202.647 billion (2023 est.) |
| National Day: 07 August | Area (land): 322,463 km2 | GDP - per capita (PPP): $6,960 (2023 est.) |
| Population: 30,900,000 (July 2023 est.) | Coastline: 590 km | Internet country code: .ci |
Source: [1,2,3,4,5]
The rating positions of Côte d’Ivoire relative to other countries have been determined for an extensive list of economic, energy, innovative and educational indices, as well as for metrics reflecting the state of the environment. The economic indices include, for example, GDP per capita, annual average GDP growth, high-technology exports, and others. The list of energy indices includes proven reserves of oil, gas and coal, production-consumption ratio combined, and energy use, etc. Each of the indices has a ranked list of included member countries. Since the number of countries in each rating is different for each index, the positioning of the country of interest is displayed on a special chart, where the vertical axis is a uniform relative scale from 0 to 1, whereas the horizontal axis denominates the various indices and respective numbers relating to the descriptions given underneath.
Thus, in such a relative “0-1” diagram, the country’s position is marked with a dot in proportion to its location in the original rating list. If the country is among the leaders regarding the selected indicator, it will be marked close to 1 in the upper green zone on the relevant chart “0-1”, if the country is an outsider in the rating list, then it will be marked in the lower red zone of the chart “0-1”, etc.
Ranking position of Côte d’Ivoire for list of economic indices:
| Sources: 1. GDP (purchasing power parity), 2020 est. / The World Factbook/Library/Central Intelligence Agency *228 2. GDP - per capita (PPP), 2020 / The World Factbook/Library/Central Intelligence Agency *229 3. Inflation rate (consumer prices), 2019 est. / The World Factbook/Library/Central Intelligence Agency *228 4. Charges for the use of intellectual property, receipts (BoP, current US$), 2020 / International Monetary Fund, Balance of Payments Statistics Yearbook, and data files. / License: CC BY-4.0 *88 5. The Global Competitiveness Index 2019 / Rankings / Reports / World Economic Forum *141 6. High-technology exports (current US$) 2019-2020 / United Nations, Comtrade database through the WITS platform / License: CCBY-4.0 / Data *134 7. 2021 Index of Economic Freedom / International Economies / The Heritage Foundation *178 8. Reserves of foreign exchange and gold, 2017 est. / The World Factbook / Library / Central Intelligence Agency *195 9. Annual average GDP growth in %, for the last 10 years (2011-2020) / World Bank national accounts data, and OECD National Accounts data files / License: CC BY-4.0 *206 10. Public debt (% of GDP), 2017 est. / The World Factbook / Library / Central Intelligence Agency (from smallest to largest) *210 * Total number of countries participating in ranking Figure 1. Economic Indices of Côte d'Ivoire |
The country's economy is one of the most stable and fastest growing economies in West Africa and is largely based on agriculture. When compared globally, half of the economic indices shown in the chart above are below the global average. The lowest of them are the Global Competitiveness Index (0.16) and GDP per capita (0.25). Annual average GDP growth in % (0.94) and the Inflation rate (0.98) belong to the country’s highest values.
Energy Resources
Côte d'Ivoire has some proven reserves of fossil fuels, mainly located offshore. The share of oil reserves in the country relative to the world's reserves is 0.006%, the share of natural gas is 0.014%. In terms of tons of oil equivalent, according to 2024 data, conventional proved reserves by fuel type were: 65.2% – natural gas, 34.8% – oil (Fig.5).
Table 1. Fossil energy resources of Côte d'Ivoire
| Resource /Explanations | Crude oil* | Natural gas* | Coal | Tight Oil | Shale Gas |
|---|---|---|---|---|---|
| Value | 0.1 (0.006%) | 1 (0.014%) | - | - | - |
| Unit | billion barrels | Tcf | - | - | - |
| Year | 2021 | 2020 | - | - | - |
| Source | [6] | [6] | [-] | [-] | [-] |
* share of the country’s reserves in world total is provided in brackets
Côte d'Ivoire has a high potential for renewable energy, including hydropotential. The country has several large rivers, on which hydropower infrastructures have already been built. As of 2022, hydropower in Côte d'Ivoire accounted for about 30% of electricity generation. Although periods of severe drought sometimes lead to interruptions in supply, the realization of untapped hydropotential could be a cornerstone for the development of the energy sector.
Table 2. Renewable energy resources of Côte d'Ivoire
| Resource/ explanations | Solar Potential (GHI)* | Wind Potential (50 м)* | Bio Potential (agricultural area) | Bio Potential (forest area) | Municipal Solid Waste |
|---|---|---|---|---|---|
| Value | 4.9-5.6 | 4.0-5.0 | 66.7 | 8.9 | 0.64 |
| Unit | kWh/m2/day | m/s | % of land area | % of land area | kg/per capita/day |
| Year | 2020 | 2020 | 2020 | 2020 | 2018 |
| Source | [7] | [8] | [9] | [10] | [11] |
*for the majority of the territory of the country
Côte d'Ivoire has several areas with great solar energy potential, with the highest DNI solar intensity reaching 5.7 kWh/m2 per day recorded in the in northwest part of country, between Denguele and Savanes districts. The strongest wind speeds of 4.0-5.0 m/s at 50 m are distributed in southern part of country, along coastline of the Gulf of Guinea.
ABIDJAN FELIX HOUPHOUET BOIGNY INTL, COTE D'IVOIRE
Latitüde: 5.26, Longitude: -3.93
Average speed: 2.83 m/s, Operational share: 49%
Average daily wind speed for 10 years of observations, m/s, 10 m above the ground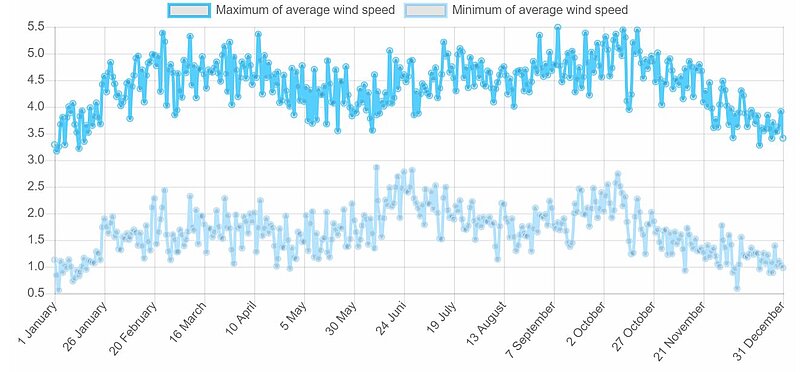
Source: based on NOAA U.S. Department of Commerce
Detailed information: Interactive map of wind resources
ABIDJAN FELIX HOUPHOUET BOIGNY INTL, COTE D'IVOIRE
Latitüde: 5.26, Longitude: -3.93
Average daily sky coverage over 10 years of observations, %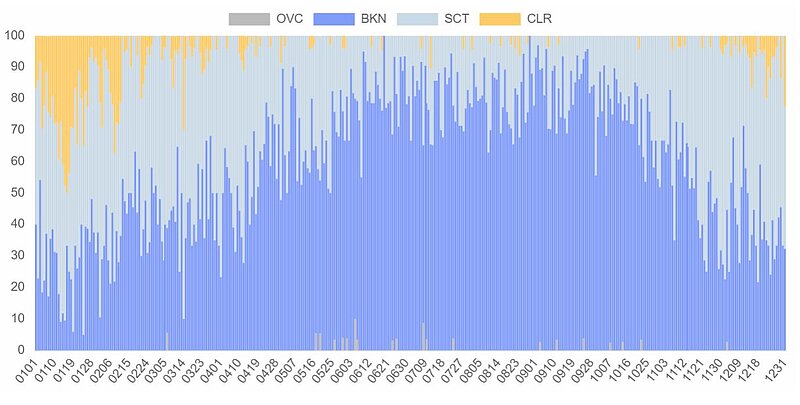
CLR - clear, SCT - scattered from 1/8 TO 4/8, BKN - broken from 5/8 TO 7/8, OVC - overcast, OBS - obscured, POB - partial obscuration
Source: based on NOAA U.S. Department of Commerce
Detailed information: Interactive map of solar resources
As a country with a developed agricultural sector, Côte d'Ivoire has excellent opportunities for the development of bioenergy technologies due to agricultural waste.
Energy Balance
According to [6], in 2022 in Côte d'Ivoire, the total production of primary energy was 0.171 quadrillion Btu, while consumption was at the level of 0.218 quadrillion Btu. Thus, the share of domestic production in primary energy consumption was about 78,4%. This makes Côte d'Ivoire a country dependent on energy imports.
Source: U.S. Energy Information Administration (Mar 2024) / https://www.eia.gov
Figure 2. The Production and Consumption of fossil fuels in Côte d'Ivoire (left — coal, in the center — gas, right — oil)
A great part of Ivorian primary energy demand is covered by domestic oil and natural gas production. Natural gas production, shown in the graph above, has decreased slightly over the ten years to 31.4 thousand barrels per day. During the same period, oil consumption more than doubled, far exceeding the country's internal capacity to produce it.
Sources: U.S. Energy Information Administration (Mar 2024) / https://www.eia.gov/ | ||
| Figure 3. Electricity Generation in Côte d'Ivoire |
Ivorian electricity sector is dominated by thermal generation, which accounted for almost 70% of the country's electricity production in 2022. Hydropower accounted for about 30%, while other renewable energy sources such as solar and wind contributed less than 1%. Both electricity generation and consumption almost doubled between 2010 and 2022. The country is fully self-sufficient in electricity and regularly exports it to neighboring countries. However, it should be noted that not all people in the country have access to electric power, especially in rural areas, where more than half of the population lives without electricity.
| Sources: 1. Crude oil proved reserves, 2021 / International Energy Statistic/Geography / U.S. Energy Information Administration (Nov 2021)*98 2. Natural gas proved reserves 2021 / International Energy Statistic / Geography / U.S. Energy Information Administration (Nov 2021) *99 3. Total recoverable coal reserves 2019 / International Energy Statistic / Geography / U.S. Energy Information Administration (Nov 2021) *81 4. Combination production-consumption for Crude oil 2018 / International Energy Statistic / Geography / U.S. Energy Information Administration (Nov 2021) *219 5. Combination production-consumption for Natural gas 2019 / International Energy Statistic / Geography / U.S. Energy Information Administration (Nov 2021) *123 6. Combination production-consumption for Coal 2019 / International Energy Statistic / Geography / U.S. Energy Information Administration (Nov 2021) *128 7. Electricity – from other renewable sources (% of total installed capacity), 2017 est. / The World Factbook / Library / Central Intelligence Agency *170 8. GDP per unit of energy use (PPP per unit of oil equivalent), 2020 *66 Primary energy consumption - BP Statistical Review of World Energy 2021/BP;GDP (purchasing power parity) - The World Factbook/Library/Central Intelligence Agency 9. Energy use (primary energy use of oil equivalent per capita) 2020 *127 Primary energy consumption – BP Statistical Review of World Energy 2021; Population - United Nations, Department of Economic and Social Affairs, Population Division (2019). World Population Prospects 2019, custom data acquired via website. Retrieved 15 November 2021*66 10. The Global Energy Architecture Performance Index Report (EAPI) 2017 / Rankings / Reports / World Economic Forum 11. Electric power consumption (kWh per capita), 2016 *217 Electricity Consumption - The World Factbook / Library / Central Intelligence Agency; Population - United Nations, Department of Economic and Social Affairs, Population Division (2019). World Population Prospects 2019, custom data acquired via website. Retrieved 15 November 2021 12. Combination of electricity production-consumption (kWh)/The World Factbook/Library/Central Intelligence Agency *216 * Total number of countries participating in ranking Figure 4. Energy indices of Côte d'Ivoire |
The energy indices presented in the graph above show that the country has high energy needs and faces some difficulties. Côte d'Ivoire ranks lowest in per capita electricity consumption (0.18), due to the fact that about 30% of the population does not have access to electricity. In addition, the country has a weak performance in The Global Energy Architecture Performance Index (0.20). As Côte d'Ivoire has no coal production and consumption, two items related to coal as well as the indicator "Electricity from other renewable sources" remained blank in the chat. The indicator "Combined generation and consumption of electricity" (0.74) is the highest of those presented.
Energy Infrastructure
A territorial map showing the distribution of the largest fossil fuel sector infrastructure projects in Côte d'Ivoire is presented in Figure 5. As noted earlier, natural gas reserves account for about 65% of all proven fossil fuel reserves, followed by oil. Most natural gas and oil production activity is concentrated in the south-eastern coastal basin, where several offshore fields have been discovered. The largest oil fields are Lion and Panthere, the oil from which is piped to the refinery in Abidjan. The country also operates the Baobab heavy oil field, which is located 25 kilometres off the coast, south of the Espoir field.
Figure 5. Basic infrastructural facilities of the fossil fuel sector in Côte d'Ivoire
In recent years, significant new offshore oil and gas reserves have been discovered in the country. One of these is the Baleine field, which has estimated reserves of 2.5 billion barrels of crude oil and 3,300 billion cubic feet of natural gas. The project is considered to be one of the largest hydrocarbon findings of Cote d’Ivoire [12].
Figure 6. Electricity production and Renewable energy in Côte d'Ivoire
Ivorian electricity sector is dominated by generation from fossil fuels, mainly natural gas, which provided about 70% of the electricity in 2022. The thermal power plants in Côte d'Ivoire are mainly located in the south of the country, in Soubré, San Pédro and Abidjan, and the south-western region is powered by hydropower plants. Thus, the northern and eastern parts of the country do not have any power plants and are supplied with electricity through the main 225 kV transmission line, which runs across the border to neighboring countries such as the Republic of Mali and Burkina Faso. Ciprel Thermal Power Plant with the installed capacity 543 MW is the biggest power plant in the country.
Hydropower plays an important role in energy production in Côte d'Ivoire, accounting for about 30% of the total electricity generated. The country has both small and medium-sized hydropower plants and large hydropower plants, the most important of which are located on the main rivers Sassandra and Bandama. The largest of these is the 275 megawatt Soubre power plant.
By 2030, the Government of Côte d'Ivoire aims to create an energy mix in which 42% will come from renewable energy sources. Hydropower should be one of the main pillars in achieving this plan. A number of additional projects are planned to increase hydroelectric capacity in the coming years. One of them is the 44 MW Singrobo hydroelectric project on the Bandama River in the Lagunes region. The project includes a 3.5 kilometer transmission line and a substation to connect the generated electricity to the existing grid [13].
In addition, the Government of Côte d'Ivoire aims to achieve an electrification rate of 100 % by 2025. However, there are remote areas in the country where the grid is unlikely to arrive before 2025, so the development of off-grid solar power could be an effective way to meet this demand [14].
Education and Innovation
The following chart shows Côte d'Ivore’s positions in terms of education and innovation:
Sources: 1. The Global Innovation Index 2021, Rankings / Knowledge / World Intellectual Property Organization / Cornell University, INSEAD, and WIPO (2021): Energizing the World with Innovation. Ithaca, Fontainebleau, and Geneva *132 2. Patent Grants 2011-2020, resident & abroad / Statistical country profiles / World Intellectual Property Organization *185 3.Patents in Force 2020 / Statistical country profiles / World Intellectual Property Organization *109 4. QS World University Rankings 2022 *97 5. SCImago Country Rankings (1996-2020) / Country rankings / SCImago, (n.d.). SIR-SCImago Journal & Country Rank [Portal]. Retrieved 17 Nov 2021 *240 6. Internet users in 2018 / The World Factbook / Central Intelligence Agency *229 7. Internet users in 2018 (% Population) / The World Factbook / Central Intelligence Agency *229 8. Government expenditure on education, total (% of GDP), 2019 / United Nations Educational, Scientific, and Cultural Organization (UNESCO) Institute for Statistics. License: CCBY-4.0 / Data as of September 2021*177 9. Research and development expenditure (% of GDP), 2018 / UNESCO Institute for Statistics. License: CCBY-4.0 / Data *119 10. Scientific and technical journal articles, 2018 / National Science Foundation, Science and Engineering Indicators. License: CCBY-4.0 / Data *197 * Total number of countries participating in ranking | ||
Figure 7. The indices of education and innovation in Côte d'Ivoire |
The presented indices show a mixed picture in the field of education and innovation. The country's highest rankings are in the absolute number of Internet users (0.79) and the number of patent grants (0.72). On the other hand, the ratio of internet users to total population is well below the world average (0.35). The Ivorian weakest performance in this category is related to government expenditure on Research and development (0.09) and the Global Innovation Index 2021 (0.14). The country is not represented in the Patents Grants and QS World University Rankings, leaving these positions unfilled.
Ecology and Environment Protection
Indicators related to environmental issues are presented in the following diagram.
| Sources: 1. CO2 total emission by countries 2020 / European Commission / Joint Research Centre (JRC) / Emission Database for Global Atmospheric Research (EDGAR)*208 2. CO2 per capita emission 2020/European Commission/Joint Research Centre (JRC) / Emission Database for Global Atmospheric Research (EDGAR) *208 3. Forest area 2020 (% of land area) / The Global Forest Resources Assessment 2020 / Food and Agriculture Organization of the United Nations *234 4. Forest area change 2010-2020 (1000 ha/year) / The Global Forest Resources Assessment 2020 / Food and Agriculture Organization of the United Nations *234 5. The Environmental Performance Index (EPI) 2020 / Rankings / Yale Center for Environmental Law & Policy / Yale University *180 6. Annual freshwater withdrawals (m3 per capita), 2017 *179 Annual freshwater withdrawals, total (billion m3), 2017 – Food and Agriculture Organization, AQUASTAT data. /License: CC BY-4.0; Population – United Nations, Department of Economic and Social Affairs, Population Division (2019). World Population Prospects 2019, custom data acquired via website. Retrieved 15 November 2021 7. The National Footprint Accounts 2017 (Biocapacity Credit / Deficit) / Global Footprint Network *188 8. Methane emissions (kt of CO2 equivalent), 2018 / Data for up to 1990 are sourced from Carbon Dioxide Information Analysis Center, Environmental Sciences Division, Oak Ridge National Laboratory, Tennessee, United States. Data from 1990 are CAIT data: Climate Watch. 2020. GHG Emissions. Washington, DC: World Resources Institute. Available at: License : Attribution-NonCommercial 4.0 International (CC BY-NC 4.0) *191 9. The Climate Change Performance Index (CCPI) 2022 / Overall Results / Jan Burck, Thea Uhlich, Christoph Bals, Niklas Höhne, Leonardo Nascimento / Germanwatch, NewClimate Institute & Climate Action Network *60 * Total number of countries participating in ranking | ||
Figure 8. Environmental Indices of Côte d'Ivoire |
Four indices characterizing the country's position in various international rankings related to ecology and environmental protection are at the bottom of the rankings. It applies to forest area (0.22) as well as to forest area change (0.09). In addition, the country has low performance for The Environmental Performance Index (0.02) and Annual freshwater withdrawals (0.12) Cote d'Ivore has the highest positions in CO2 per capita emission (0.84) and The National Footprint Accounts (0.80). The country is not included into the Climate Change Performance Index leaving this indicator blank in the chart above.
References
[1] List of sovereign states and dependencies by area / Wikipedia / en.wikipedia.org/wiki/List_of_sovereign_states_and_dependencies_by_area
[2] List of countries and dependencies by population density / Wikipedia / en.wikipedia.org/wiki/List_of_countries_and_dependencies_by_population_density
[3] Côte d'Ivoire / The world factbook / Library / Central Intelligence Agency / www.cia.gov
[4] GDP, PPP (constant 2011 international $) / World Bank, International Comparison Program database. License: CC BY-4.0 / Data / The World Bank / www.worldbank.org
[5] GDP per capita, PPP (current international $) / World Bank, International Comparison Program database. License: CC BY-4.0 / Data / The World Bank / www.worldbank.org
[6] International Energy Statistic / Geography / U.S. Energy Information Administration / www.eia.gov/beta/international/
[7] Solar resource data obtained from the Global Solar Atlas, owned by the World Bank Group and provided by Solargis / Global Solar Atlas / globalsolaratlas.info
[8] Wind Map / Global Wind Atlas 2.0, a free, web-based application developed, owned and operated by the Technical University of Denmark (DTU) in partnership with the World Bank Group, utilizing data provided by Vortex, with funding provided by the Energy Sector Management Assistance Program (ESMAP). For additional information: globalwindatlas.info
[9] Agricultural land (% of land area) /Food and Agriculture Organization, electronic files and web site. License: CC BY-4.0 / Data / The World Bank / www.worldbank.org
[10] Forest area (% of land area) /Food and Agriculture Organization, electronic files and web site. License: CC BY-4.0 / Data / The World Bank / www.worldbank.org
[11] What a Waste 2.0 (PDF) / Resources / The World Bank / www.worldbank.org
[12] Oil & Natural Gas / Sector - Specific Activities / https://www.economie-ivoirienne.ci/en/activites-sectorielles/oil-natural-gas.html
[13] EAIF lending €25 million to construct 44-MW Singrobo hydroelectric plant / 27.7.2021 / https://www.hydroreview.com/business-finance/finance/eaif-lending-e25-million-to-construct-44-mw-singrobo-hydroelectric-plant/#gref
[14] GOGLA - Côte d’Ivoire / https://www.gogla.org/wp-content/uploads/2022/12/Cote-dIvoire-Country-Brief.pdf
The sources of charts and curves are specified under the images.
For more information about the energy industry in Côte d’Ivoire see here