
Contents
General State of the Economy
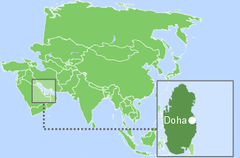
Qatar, the official name – The State of Qatar, is a country in the Middle East with its capital in Doha. The country borders Saudi Arabia (in the south), has sea borders with Bahrain (in the north-west), with the United Arab Emirates (in the south-east), and is also washed by the waters of the Persian Gulf.
According to 2022 statistics, Qatar, which in terms of size is placed 164th in the world, is home to more than 2.5 million people. In terms of population density, the country is 59th in the world from 248 countries considered [1,2,3]. The length of the coastline is 563 km [3].
| The State of Qatar / دولة قطر | ||
|---|---|---|
| Capital: Doha | Density: 176/km2 | Currency: Qatari riyal (QAR) |
| Official languages: Arabic | Life expectancy at birth: 79.81 years | GDP (PPP): $328.134 billion (2023 est.) |
| National Day: 18 December | Area (land): 11,586 km2 | GDP - per capita (PPP): $114,210 (2023 est.) |
| Population: 2,508,182 (2022 est.) | Coastline: 0 km | Internet country code: .qa |
Source: [1,2,3,4,5]
The political form of government is absolute monarchy, the official language is Arabic. The administrative map of the country is divided into 8 municipalities [3].
Qatar’s ranking positions relative to other countries have been determined for an extensive list of economic, energy, innovative and educational indices, as well as for metrics reflecting the state of the environment. The economic indices include, for example, GDP per capita, annual average GDP growth, high-technology exports, and others. The list of energy indices includes proven reserves of oil and gas, production-consumption ratio combined, and energy use, etc. Each of the indices has a ranked list of included member countries. Since the number of countries in each rating is different for each index, the positioning of the country of interest in the rating is displayed on a special chart, where the vertical axis is a uniform relative scale from 0 to 1, whereas the horizontal axis denominates the various indices and respective numbers relating to the descriptions given underneath.
Thus, in such a relative “0-1” diagram, the country’s position is marked with a dot in proportion to its location in the original rating list. If the country is among the leaders regarding the selected indicator, it will be marked close to 1 in the upper green zone on the relevant chart “0-1”, if the country is an outsider in the rating list, then it will be marked in the lower red zone of the chart “0-1”, etc.
Oil and gas resources are the main source of income and economic growth of Qatar [3], which is reflected in Figure 1. For the majority of indices the positioning of the country is higher than the world average, in the top half of the graph, and for 4 indices in the top quarter of the graph (i.e. among 25% of the best countries in the world included in the rating).
| Sources: 1. GDP (purchasing power parity), 2020 est. / The World Factbook/Library/Central Intelligence Agency *228 2. GDP - per capita (PPP), 2020 / The World Factbook/Library/Central Intelligence Agency *229 3. Inflation rate (consumer prices), 2019 est. / The World Factbook/Library/Central Intelligence Agency *228 4. Charges for the use of intellectual property, receipts (BoP, current US$), 2020 / International Monetary Fund, Balance of Payments Statistics Yearbook, and data files. / License: CC BY-4.0 *88 5. The Global Competitiveness Index 2019 / Rankings / Reports / World Economic Forum *141 6. High-technology exports (current US$) 2019-2020 / United Nations, Comtrade database through the WITS platform / License: CCBY-4.0 / Data *134 7. 2021 Index of Economic Freedom / International Economies / The Heritage Foundation *178 8. Reserves of foreign exchange and gold, 2017 est. / The World Factbook / Library / Central Intelligence Agency *195 9. Annual average GDP growth in %, for the last 10 years (2011-2020) / World Bank national accounts data, and OECD National Accounts data files / License: CC BY-4.0 *206 10. Public debt (% of GDP), 2017 est. / The World Factbook / Library / Central Intelligence Agency(from smallest to largest) *210 * Total number of countries participating in ranking Figure 1. Economic Indices of Qatar |
Qatar has one of the world's highest GDP per capita, as well as annual GDP growth. Nevertheless, the level of high-tech exports is relatively low.
From the beginning of 2000 the country has experienced sustained GDP growth in purchasing power parity, which decreased in recent years and reached the level of $245.6 billion (62nd place in the world) in 2020 [3,4]. The country’s GDP at purchasing power parity per capita showed decline over the past few years, and in 2020 amounted to $85 300 (6th in the world), dropping from $134 200 in 2015 [3,5].
The level of inflation changed from 2.7% in 2016 to - 0.6% in 2019; in terms of this indicator the country was 11th in the world (ranked by levels of inflation, smaller to larger) [3].
According to The Global Competitiveness Report 2019, presented by the World Economic Forum, Qatar was 29th (out of an estimated total of 141 countries), behind a number of European countries but ahead of, for example, Saudi Arabia. This rating reflects the effectiveness of the use of the country’s own resources for sustainable development. In addition to a number of economic indicators this index also takes into account such variables as education, health, level of innovation, etc.
In the list of 134 countries that exported high-tech products in 2019-2020, Qatar was 61st, below the world average. According to the Index of Economic Freedom 2021, which is based on freedom of business, freedom from government action, property protection, and freedom from corruption, the country was considered «mostly free», 31st out of 178 countries. In terms of gold reserves and foreign exchange reserves in 2017 Qatar was 68th. The country's public debt in 2017 amounted to 53.8% of GDP, which is close to the world average (Figure 1).
According to Standard & Poor's rating in October 2018, the country was rated as АА - «very strong» - «…the issuer has a very high ability to pay interest on debt obligations and debts themselves».
Qatar Gas Transport Co Ltd (Nakilat) Q.S.C. is included in the rating of the largest energy companies, according to S & P Global Platts 2021 Top 250.
Energy resources
Qatar has significant reserves of fossil fuel resources (Table 1). According to proven reserves of oil and natural gas, the country is ranked 13th and 3rd in the world, respectively [3]. According to data for 2021 in terms of tons of oil equivalent proved oil reserves amounted to 13.8%, natural gas – 86.2% (Figure 5).
According to [6], in 2021 the proven oil reserves in Qatar was 25.2 billion barrels. At current production levels oil reserves in Qatar could last for another in 30 years.
Proven natural gas reserves in Qatar in 2021 according to [6] were 842.6 Tcf, which at current production levels natural gas reserves in the country could last for 140 years.
Table 1. Fossil energy resources of Qatar
| Resource /Explanations | Crude oil* | Natural gas* | Coal | Shale Gas | Tight (Shale) Oil |
|---|---|---|---|---|---|
| Value | 25.244 (1.52%) | 842.627 (11.61%) | no data | no data | no data |
| Unit | billion barrels | Tcf | - | - | - |
| Year | 2021 | 2020 | - | - | - |
| Source | [6] | [6] | - | - | - |
*share of the country’s reserves in world total is provided in brackets
Qatar's share in the global volume of proven oil reserves is 1.5%, and gas – almost 12.5% [6]. Qatar is an active participant in the organization of oil exporters (OPEC), where the share of its reserves is 2.1% of the total reserves of the participating countries.
Qatar’s total primary energy supply (TPES) is composed of fossil fuels – oil and gas, with the share of oil being just over 33.5% in 2017 according to [8].
Due to its geographical position Qatar has quite good reserves of such renewable energy sources as solar and wind. A selection of basic indicators of this type of resource is presented in Table 2.
Table 2. Renewable energy resources of Qatar
| Resource/ Explanations | Solar Potential (DNI)* | Wind Potential (50 м)* | Bio Potential (agricultural area) | Bio Potential (forest area) | Geothermal Potential | Municipal Solid Waste |
|---|---|---|---|---|---|---|
| Value | 5.5-6.0 | 5.0-6.5 | 6.4 | 0 | no data | 1.27 |
| Unit | kWh/m2/day | m/s | % of land area | % of land area | - | kg/per capita/day |
| Year | 2020 | 2020 | 2020 | 2020 | - | 2016 |
| Source | [9] | [10] | [11] | [12] | [-] | [13] |
*for the majority of the territory of the country
The level of direct solar irradiation for the majority of the country is 5.5-6.0 kWh/m2/day [9], which is an excellent resource for the production of solar energy, both using photovoltaic technologies (PV) and by means of a concentrator (CSP).
The distribution of wind resources is as follows: for the majority of the country the wind speed is 5.0-6.5 m/s, and in the west of the country in the municipality of Al Jumayliyah it can reach 7.0-7.5m/s at the height of 50 metres [10]. It is also a decent resource, which remains practically unused.
About 5.6% of the territory of Qatar was covered by agricultural land in 2018 [11], and this has been increasing slightly over the last half century; there is no forest in the country [12].
The level of generation of municipal waste in Qatar, 1.27 kg per capita per day, is lower than, for example, in Saudi Arabia (1.4 kg per capita per day), and higher than in Morocco (0.55 kg per capita per day). An increase of up to 1.7 kg per capita per day is predicted by 2025 [13].
Energy Balance
In 2022 in Qatar the total production of primary energy was 9.958 quadrillion Btu, while consumption was at the level of 2.201 quadrillion Btu. Thus, the share of domestic consumption in primary energy production is 22.1%, meaning that Qatar is largely energy independent. The country is an important exporter of crude oil and gas, include Asian, European and other countries. Energy consumption per capita in 2022 was 767.2 million Btu per person, and energy consumption per GDP, (2022) – 8.73 thousand Btu per USD at purchasing power parities [6].
According to the BP Statistical Review of World Energy 2022, primary energy consumption in Qatar in 2021 was 1.93 exajoules and was dominated by natural gas – 74.6% , followed by oil – 25.4% [7].
Using data from [3,7] we calculated an estimated value of the energy intensity of GDP in Qatar in 2018 – $6.8 taking into account PPP in 2011 prices per unit of energy expended (the equivalent of energy contained in one kg of oil equivalent/$ PPP per kg of oil equivalent), which is significantly lower than the world average level of GDP energy efficiency.
Oil production grew rapidly between 2001 and 2012, then it slowed down and in 2022 amounted 1857 thousand barrels/day [14]. The volume of oil consumption in the country since 2001 has shown a steady growth (Fig. 2) and in 2022 was 297 thousand barrels/day [14].
BP reported lower figures of oil production in Qatar in 2021 – 1746 thousand barrels/day; consumption was at the level of 311 thousand barrels/day [7]. Exports of oil from Qatar in 2017 amounted to 466 barrels/day and 639.4 barrels/day of oil products [15].
Source: U.S. Energy Information Administration (Mar 2024) / www.eia.gov
Figure 2. The production and consumption of fossil fuels in Qatar (left – coal, in the center – gas, right – oil)
Natural gas production and consumption grew steadily and in 2022 amounted to 5989 Bcf and 1466 Bcf, respectively [14]. According to the BP Statistical Review of World Energy 2022 [7], gas production in 2021 was 177 Bcm, while consumption was 40 Bcm. According to OPEC [15] in 2017, natural gas production volume was at 163.6 Bcm, and 128.6 Bcm was exported, i.e. almost 79%.
In terms of this indicator, Qatar has been the second largest exporter in the world after Russia, and the world's largest exporter of LNG since 2006. LNG is exported from Qatar mainly to Asia (72%) and Europe (23%) [16].
Gas is also supplied to Oman and the United Arab Emirates via the Dolphin pipeline, which has a capacity of 3.2 Bcf/day [16].
Qatar almost completely relies on fossil fuel resources for electricity production (Fig.3).
Sources: U.S. Energy Information Administration (Mar 2024) / www.eia.gov | ||
| Figure 3. Electricity generation in Qatar |
According to the U.S. Energy Information Administration the country produced 54.05 TWh of electricity in 2022 where fossil fuels accounted for 99.7%, renewables – 0.3% (Fig.6).
Qatar’s position in the comparative diagram of energy index is shown in Fig. 4. Qatar is in the list of countries with the best ratio of production/consumption of oil and gas, ranked from higher to lower values. In another rating – the list of countries for the production of electricity from renewable sources (excluding hydropower), Qatar was 162nd out of 170 countries in 2017, behind a great number of countries, but ahead of the UAE.
Qatar is ranked 116th, behind Kuwait in the EAPI of 2017 (Energy Architecture Performance Index), which is based first on the level economic growth, environmental safety, and energy independence of the country, including access to energy. Over the last 8 years the country has gained 11 positions in the rating.
| Sources: 1. Crude oil proved reserves, 2021 / International Energy Statistic/Geography / U.S. Energy Information Administration (Nov 2021)*98 2. Natural gas proved reserves 2021 / International Energy Statistic / Geography / U.S. Energy Information Administration (Nov 2021) *99 3. Total recoverable coal reserves 2019 / International Energy Statistic / Geography / U.S. Energy Information Administration (Nov 2021) *81 4. Combination production-consumption for Crude oil 2018 / International Energy Statistic / Geography / U.S. Energy Information Administration (Nov 2021) *219 5. Combination production-consumption for Natural gas 2019 / International Energy Statistic / Geography / U.S. Energy Information Administration (Nov 2021) *123 6. Combination production-consumption for Coal 2019 / International Energy Statistic / Geography / U.S. Energy Information Administration (Nov 2021) *128 7. Electricity – from other renewable sources (% of total installed capacity), 2017 est. / The World Factbook / Library / Central Intelligence Agency *170 8. GDP per unit of energy use (PPP per unit of oil equivalent), 2020 *66 Primary energy consumption - BP Statistical Review of World Energy 2021/BP;GDP (purchasing power parity) - The World Factbook/Library/Central Intelligence Agency 9. Energy use (primary energy use of oil equivalent per capita) 2020 *127 Primary energy consumption – BP Statistical Review of World Energy 2021; Population - United Nations, Department of Economic and Social Affairs, Population Division (2019). World Population Prospects 2019, custom data acquired via website. Retrieved 15 November 2021*66 10. The Global Energy Architecture Performance Index Report (EAPI) 2017 / Rankings / Reports / World Economic Forum 11. Electric power consumption (kWh per capita), 2016 *217 Electricity Consumption - The World Factbook / Library / Central Intelligence Agency; Population - United Nations, Department of Economic and Social Affairs, Population Division (2019). World Population Prospects 2019, custom data acquired via website. Retrieved 15 November 2021 12. Combination of electricity production-consumption (kWh)/The World Factbook/Library/Central Intelligence Agency *216 * Total number of countries participating in ranking Figure 4. Energy indices of Qatar |
In terms of electricity consumption per capita, the country was 7th in the world in 2019; for the indicator for combination of electricity production-consumption Qatar is 69th.
It should also be noted that Qatar has a significant excess in the volume of electricity production compared with its consumption.
Energy Infrastructure
A territorial map of the distribution of the largest infrastructure projects of the fossil-fuel sector in Qatar is shown in Figure 5.
As previously mentioned, the proven reserves of gas account for 86.2% of proved fossil fuel resources, oil – 13.8% (Fig.5).
The world's leading offshore gas field is the North Dome (North Field), located in the northeast of Qatar’s continental shelf, which, according to Qatargas, accounts for 18.5 billion standard cubic feet per day [17]. The country's gas system is represented by 3 gas compressor stations, as well as 14 LNG export terminals operated by Qatargas and RasGas; the maximum capacity of the six largest terminals is 7.8 MTPA [18].
There are two GTL plants operating in the country, Qatar Oryx (operated by QP and Sasol-Shevron GTL) with an installed capacity of 30,000 barrels per day and Pearl GTL (QP & Shell) with an installed capacity of 140,000 barrels/day, which produce liquid hydrocarbons from natural gas [19]. Transportation of gas, condensate and gas condensate within the country is carried via a network of pipelines with a total length of 2383 km, 288 km and 221 km, respectively (Fig. 5).
Figure 5. Basic Infrastructure facilities of the fossil fuel sector in Qatar (click on the map to view a PDF version)
North Oil Company is developing the world's largest offshore oil field, Al Shaheen, located 80 km north of Ras Laffan, production is carried out at 33 platforms from 300 wells, with 300,000 barrels of oil currently per day [20].
In 2016 Qatar refineries had a total installed capacity of 429 thousand barrels/day, the largest, RasLaffan 1 and RasLaffan 2 have an installed capacity of 146 000 bbl/day [21] (Fig.5). Crude oil and petroleum products are exported via 3 oil terminals, and crude oil, petroleum products, and LNG are transported via pipelines with a total length of 745 km, 103 km, and 90 km, respectively (Fig. 5).
The map of the territorial distribution of Qatar’s largest infrastructure facilities for electricity generation is presented in Figure 6. 
Figure 6. Electricity production and renewable energy in Qatar (click on the map to view a PDF version)
According to the U.S. Energy Information Administration, the share of fossil fuels in energy production in Qatar in 2022 was 99.7% (Fig.6).
Most of the electricity is generated at gas power plants (Fig.6), the largest of which is Ras Girtas, with an installed capacity of 2.730 MW [22].
As already noted the potential of Qatar’s renewable energy is not sufficiently used and has only a 0.3% share in electricity production. Nevertheless, the Solar PV Power Plant Al-Duhail is being completed near the capital, which will have a capacity of 15 MW [23], and a tender for the construction of a 500-MW solar photovoltaic (PV) plant in the Al Kharsaa area was announced in May 2018 [24]. In addition, Al Wakrah has a Mesaieed Incineration Plant, which can process 500,000 tons of waste per year and has an installed capacity of 50 MW [25].
Education and Innovation
The set of indices reflecting the position of Qatar among other countries in the field of education and innovation can be seen in Figure 7. Qatar is 68th out of 132 countries considered in the ranking of countries of the Global Innovation Index 2021 (see diagram). According to the indicator for the number of patents granted to Qatari residents, both inside the country and abroad, the country ranks 100 out of 185 countries considered.
In terms of government expenditure on education as a percentage of the country's GDP, the country demonstrates a result below the world average – 117th out of 177 countries considered. Nevertheless, in 2022 one Qatari University was included in the QS University Rating.
| Sources: 1. The Global Innovation Index 2021, Rankings / Knowledge / World Intellectual Property Organization / Cornell University, INSEAD, and WIPO (2021): Energizing the World with Innovation. Ithaca, Fontainebleau, and Geneva *132 2. Patent Grants 2011-2020, resident & abroad / Statistical country profiles / World Intellectual Property Organization *185 3.Patents in Force 2020 / Statistical country profiles / World Intellectual Property Organization *109 4. QS World University Rankings 2022 *97 5. SCImago Country Rankings (1996-2020) / Country rankings / SCImago, (n.d.). SIR-SCImago Journal & Country Rank [Portal]. Retrieved 17 Nov 2021 *240 6. Internet users in 2018 / The World Factbook / Central Intelligence Agency *229 7. Internet users in 2018 (% Population) / The World Factbook / Central Intelligence Agency *229 8. Government expenditure on education, total (% of GDP), 2019 / United Nations Educational, Scientific, and Cultural Organization (UNESCO) Institute for Statistics. License: CCBY-4.0 / Data as of September 2021*177 9. Research and development expenditure (% of GDP), 2018 / UNESCO Institute for Statistics. License: CCBY-4.0 / Data *119 10. Scientific and technical journal articles, 2018 / National Science Foundation, Science and Engineering Indicators. License: CCBY-4.0 / Data *197 * Total number of countries participating in ranking Figure 7. The indices of education and innovation in Qatar |
Qatar is well positioned when considering the number of publications of specialists in scientific and technological journal and patent activities. The country is 71st out of 240 participating countries in the Scimago ranking, and in Scientific and Technical Journal Activities it is ranked 68th out of 197 countries. The country is also among the leaders in the region in terms of the number of Internet users.
Qatar University, Hamad Bin Khalifa University, and Texas A&M University at Qatar train specialists in various fields of energy, including Energy and Resources, Electrical Engineering and Petroleum Engineering, Sustainable Energy and Sustainable Environment, etc.
In the field of synthetic fuel production, leaders in patenting are Texas A&M University at Qatar, Qatar Shell GTL Ltd, ORYX GTL, Qatar Petroleum, and Qatar University.
Texas A&M University at Qatar, Qatar Petroleum, and Maersk Oil Qatar AS publish scientific papers in the field of hydrocarbon production from reservoirs with low permeability. Research of unconventional oil is carried out at Texas A&M University at Qatar and the Al Jazeera Centre for Studies.
Hamad Bin Khalifa University is actively engaged in research in the field of bioenergy.
Qatar University, Qatar Environment and Energy Research Institute, and Texas A&M University at Qatar conduct research in the field of energy production from renewable sources, especially wind energy.
Ecology and Environment Protection
The diagram of environmental indices presented in Figure 8 to some extent reflects the ecological situation in the country, which in the case of Qatar is quite negative.
First of all, the country demonstrates a relatively high level of CO2 emissions in general and per capita. It is also necessary to note the high level of methane emissions in the country.
In 2020, due to the lack of forests in relation to the total area of the country, Qatar was 23nd in the world out of 234 countries, and according to the indicator related to the change in forest area, from 2010-2020, the country was 145th in the world.
| Sources: 1. CO2 total emission by countries 2020 / European Commission / Joint Research Centre (JRC) / Emission Database for Global Atmospheric Research (EDGAR)*208 2. CO2 per capita emission 2020/European Commission/Joint Research Centre (JRC) / Emission Database for Global Atmospheric Research (EDGAR) *208 3. Forest area 2020 (% of land area) / The Global Forest Resources Assessment 2020 / Food and Agriculture Organization of the United Nations *234 4. Forest area change 2010-2020 (1000 ha/year) / The Global Forest Resources Assessment 2020 / Food and Agriculture Organization of the United Nations *234 5. The Environmental Performance Index (EPI) 2020 / Rankings / Yale Center for Environmental Law & Policy / Yale University *180 6. Annual freshwater withdrawals (m3 per capita), 2017 *179 Annual freshwater withdrawals, total (billion m3), 2017 – Food and Agriculture Organization, AQUASTAT data. /License: CC BY-4.0; Population – United Nations, Department of Economic and Social Affairs, Population Division (2019). World Population Prospects 2019, custom data acquired via website. Retrieved 15 November 2021 7. The National Footprint Accounts 2017 (Biocapacity Credit / Deficit) / Global Footprint Network *188 8. Methane emissions (kt of CO2 equivalent), 2018 / Data for up to 1990 are sourced from Carbon Dioxide Information Analysis Center, Environmental Sciences Division, Oak Ridge National Laboratory, Tennessee, United States. Data from 1990 are CAIT data: Climate Watch. 2020. GHG Emissions. Washington, DC: World Resources Institute. Available at: License : Attribution-NonCommercial 4.0 International (CC BY-NC 4.0) *191 9. The Climate Change Performance Index (CCPI) 2022 / Overall Results / Jan Burck, Thea Uhlich, Christoph Bals, Niklas Höhne, Leonardo Nascimento / Germanwatch, NewClimate Institute & Climate Action Network *60 * Total number of countries participating in ranking Figure 8. Environmental indices of Qatar |
Also, the country is well positioned in the Environmental Performance Index (EPI) 2020, focused primarily on the environmental activities of national governments, aimed at reducing the negative impact of the environment and the rational use of natural resources. In this ranking, the country is 87th out of 180 participating countries.
Finally, it is worth mentioning that according to the Ecological Footprint Atlas rating Qatar is among a number of ecological debtors.
References
[1] List of countries and dependencies by area/ Wikipedia / en.wikipedia.org/wiki/List_of_sovereign_states_and_dependencies_by_area
[2] List_of_countries_and_territories_by_population_density/ Wikipedia / en.wikipedia.org/wiki/List_of_countries_and_territories_by_population_density
[3] Qatar / The world factbook / Library / Central Intelligence Agency / www.cia.gov/library/publications/the-world-factbook/geos/qa.html
[4] GDP, PPP (constant 2011 international $) / World Bank, International Comparison Program database. License: CC BY-4.0 / Data / The World Bank / www.worldbank.org
[5] GDP per capita, PPP (current international $)/ World Bank, International Comparison Program database. License: CC BY-4.0 / Data / The World Bank / www.worldbank.org
[6] Qatar / Geography / U.S. Energy Information Administration (2021; October 20, 2015) / http://www.eia.gov/
[7] BP Statistical Review of World Energy 2022 (PDF) / BP / www.bp.com
[8] Qatar / Statistics / © OECD / IEA 2018, IEA Publishing, Licence: www.iea.org/t&c / International Energy Agency / www.iea.org
[9] Solar resource data obtained from the Global Solar Atlas, owned by the World Bank Group and provided by Solargis / Global Solar Atlas / globalsolaratlas.info
[10] Qatar Wind Map / Global Wind Atlas 2.0, a free, web-based application developed, owned and operated by the Technical University of Denmark (DTU) in partnership with the World Bank Group, utilizing data provided by Vortex, with funding provided by the Energy Sector Management Assistance Program (ESMAP). For additional information: globalwindatlas.info
[11] Agricultural land (% of land area) /Food and Agriculture Organization, electronic files and web site. License: CC BY-4.0 / Data / The World Bank / www.worldbank.org
[12] Forest area (% of land area) /Food and Agriculture Organization, electronic files and web site. License: CC BY-4.0 / Data / The World Bank / www.worldbank.org
[13] What a Waste2012(PDF) / 2012 / Publications / The World Bank / www.worldbank.org
[14] International Energy Statistic/Geography/U.S. Energy Information Administration (Jan 2020) / www.eia.gov/beta/international/
[15] Qatar facts and figures / Member Countries / About Us / Organization of the Petroleum Exporting Countries / www.opec.org
[16] Qatar / Select Country / U.S. Energy Information Administration (October 20, 2015)/ www.eia.gov/beta/international/analysis.php
[17] Offshore / Operations / Qatargas / www.qatargas.com
[18] IGU 2017 World LNG Report (PDF) / Files / IGU / www.igu.org
[19] Qatar (PDF) / Full Report / Select Country / U.S. Energy Information Administration (October 20, 2015)/ www.eia.gov/beta/international/analysis_includes/countries_long/Qatar/qatar.pdf
[20] Al-Shaheen /Nort oil Company/ noc.qa
[21] List_of_oil_refineries / Qatar / Wikipedia / en.wikipedia.org/wiki/List_of_oil_refineries
[22] Ras Girtas Gas Power Plant / Fossil Fuels Energy / Qatar / Industry About / www.industryabout.com
[23] Kahramaa – Duhail Solar Power Plant 15 MW – Qatar - Project Profile / Product / ReportBuyer / www.reportbuyer.com
[24] Solar tender for 500 MW in Qatar enters prequalification stage / Solar park. Author: iamme ubeyou. License: CC0 1.0 Universal.May 4 / Solar / News / Renewables Now / www.renewablesnow.com
[25] Mesaieed Incineration Plant / Waste to energy / Qatar / Industry About/ www.industryabout.com
The sources of charts and curves are specified under the images.
For more information about the energy industry in Qatar see here