

Contents
General State of the Economy
Armenia, officially the Republic of Armenia, a landlocked country situated in the Caucasus region with Turkey to the west, Georgia to the north, Azerbaijan to the east, and Iran to the southeast. Lake Sevan located about 70 km north of Yerevan is the largest freshwater highland lakes in the Caucasus region making up one sixth of the entire territory of Armenia.
According to 2023 statistics, Armenia, which ranks 142nd in the world in terms of the size of its territory, is home to around 3 million people. In terms of population density, the country occupies the 123rd place in the world. Armenia is a parliamentary democracy divided into 11 provinces. The capital and the largest city is Yerevan, the official language is Armenian [1,2,3].
| Armenia/Republic of Armenia | ||
|---|---|---|
| Capital: Yerevan | Density: 101.5/km2 | Currency: Dram (֏) (AMD) |
| Official languages: Armenian | Life expectancy at birth: 72.17 years | GDP (PPP): $57.740 billion (2023 est.) |
| National Day: 21 September | Area (land): 29,743 km2 | GDP - per capita (PPP): $19,489 (2023 est.) |
| Population: 3,165,000 (2024 est.) | Coastline: 0 km | Internet country code: .am |
Source: [1,2,3,4,5]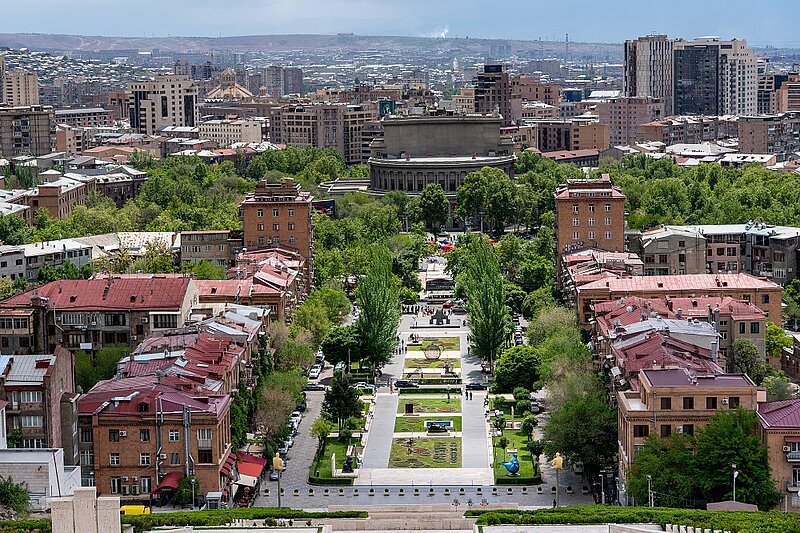
View of Yerevan from above. Envato Elements. LT4ZJFRMSV
Armenia’s ranking positions relative to other countries have been determined for an extensive list of economic, energy, innovative and educational indices, as well as for metrics reflecting the state of the environment. The economic indices include, for example, GDP per capita, annual average GDP growth, high-technology exports, and others. The list of energy indices includes proven reserves of oil, gas and coal, production-consumption ratio combined, and energy use, etc. Each of the indices has a ranked list of included member countries. Since the number of countries in each rating is different for each index, the positioning of the country of interest is displayed on a special chart, where the vertical axis is a uniform relative scale from 0 to 1, whereas the horizontal axis denominates the various indices and respective numbers relating to the descriptions given underneath.
Thus, in such a relative “0-1” diagram, the country’s position is marked with a dot in proportion to its location in the original rating list. If the country is among the leaders regarding the selected indicator, it will be marked close to 1 in the upper green zone on the relevant chart “0-1”, if the country is an outsider in the rating list, then it will be marked in the lower red zone of the chart “0-1”, etc.
Ranking position of Armenia for list of economic indices:
| Sources: 1. GDP (purchasing power parity), 2020 est. / The World Factbook/Library/Central Intelligence Agency *228 2. GDP - per capita (PPP), 2020 / The World Factbook/Library/Central Intelligence Agency *229 3. Inflation rate (consumer prices), 2019 est. / The World Factbook/Library/Central Intelligence Agency *228 4. Charges for the use of intellectual property, receipts (BoP, current US$), 2020 / International Monetary Fund, Balance of Payments Statistics Yearbook, and data files. / License: CC BY-4.0 *88 5. The Global Competitiveness Index 2019 / Rankings / Reports / World Economic Forum *141 6. High-technology exports (current US$) 2019-2020 / United Nations, Comtrade database through the WITS platform / License: CCBY-4.0 / Data *134 7. 2021 Index of Economic Freedom / International Economies / The Heritage Foundation *178 8. Reserves of foreign exchange and gold, 2017 est. / The World Factbook / Library / Central Intelligence Agency *195 9. Annual average GDP growth in %, for the last 10 years (2011-2020) / World Bank national accounts data, and OECD National Accounts data files / License: CC BY-4.0 *206 10. Public debt (% of GDP), 2017 est. / The World Factbook / Library / Central Intelligence Agency (from smallest to largest) *210 * Total number of countries participating in ranking Figure 1. Economic Indices of Armenia |
As the chart above shows, half of the country's economic indicators are below the world average. The highest indicators depicted in the ranking are 2021 Index of Economic Freedom (0.82) and Annual average GDP growth in % (0.73). The weakest spots in the country's economic indicators are High-technology exports (0.31) and Reserves of foreign exchange and gold (0.39). In general, Armenia's economy depends not only on export prospects, foreign investments and private transfers, but first and foremost quite heavily on Russia.
Energy Resources
Armenia has no proven crude oil and natural gas reserves, all fossil fuels need to be imported whereby natural gas represents the largest share of Armenia’s energy imports, followed by oil products.
Although the country has some coal reserves of 163 million short tons [6], representing 0.15% of the world's reserves, the economic viability of their extraction has not been determined. This also applies to the existing oil shale deposits, which are also not being extracted.
Table 1. Fossil energy resources of Armenia
| Resource /Explanations | Crude oil* | Natural gas* | Coal* | Oil shale (kerogen) | Shale Gas |
|---|---|---|---|---|---|
| Value | 0 | 0 | 163 (0.15%) | 0.31 | - |
| Unit | - | - | million short tons | billion barrels | - |
| Year | - | - | 2021 | 2008 | - |
| Source | [-] | [-] | [6] | [7] | [-] |
* share of the country’s reserves in world total is provided in brackets
By integrating various renewable energy sources into the country's energy system, the government plans to reduce Armenia's dependence on gas imports and nuclear energy. Wind power and solar energy are at the very beginning of their introduction into Armenia's energy supply system, although their potential is excellent. In the western part of the country, the GHI intensity reaches is 4.4 4.6 kWh/m2 per day.
SEVAN OZERO. ARMENIA
Latitüde: 40.57 Longitude: 45
Average daily sky coverage over 10 years of observations, %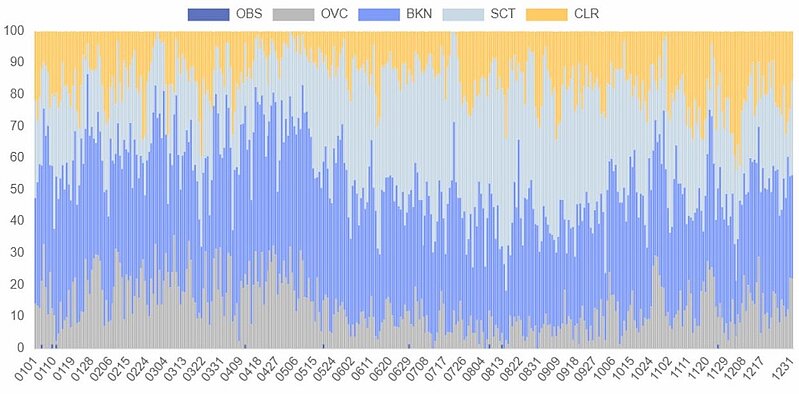
CLR - clear, SCT - scattered from 1/8 TO 4/8, BKN - broken from 5/8 TO 7/8, OVC - overcast, OBS - obscured, POB - partial obscuration
Source: based on NOAA U.S. Department of Commerce
Detailed information: Interactive map of solar resources
SEVAN OZERO. ARMENIA
Latitüde: 40.57 Longitude: 45
Average speed: 1.85 m/s Operational share: 29%
Average daily wind speed for 10 years of observations, m/s, 10 m above the ground
Source: based on NOAA U.S. Department of Commerce
Detailed information: Interactive map of wind resources
The geographical position of Armenia, characterized by high mountains and plateaus, creates favorable conditions for the use of wind energy. Wind speeds in high activity zones are more than 7.0 m/s at a height of 50 m and are widespread throughout the country, especially in the regions of Aragatsotn, Gegharkunik and Syunik.
Table 2. Renewable energy resources of Armenia
| Resource/ explanations | Solar Potential (GHI)* | Wind Potential (50 м)* | Bio Potential (agricultural area) | Bio Potential (forest area) | Municipal Solid Waste |
|---|---|---|---|---|---|
| Value | 4.4 -4.6 | 4.0-7.0 | 58.9 | 11.5 | 0.47 |
| Unit | kWh/m2/day | m/s | % of land area | % of land area | kg/per capita/day |
| Year | 2020 | 2020 | 2020 | 2020 | 2018 |
| Source | [8] | [9] | [10] | [11] | [12] |
*for the majority of the territory of the country
Since Armenia is not heavily forested, the potential for bioenergy development lies mainly in agricultural biomass. Taking into account that Armenia as a mountainous country has a large number of rivers, the potential of small hydropower is quite significant. Hydropower is already a stable component of Armenia's electricity system and provides about 30% of the country's electricity.
Energy Balance
According to [6], in 2022 in Armenia, the total production of primary energy was 0.039 quadrillion Btu, while consumption was at the level of 0.169 quadrillion Btu. Thus, the share of domestic production in primary energy consumption was about 23%. This makes Armenia a country heavily dependent on energy imports.
According to the Review by the International Energy Agency, the energy mix of Armenia was dominated by natural gas (59.6% of total energy supply in 2020), and Armenia’s domestic energy production comes mostly from nuclear and hydro resources.
Source: U.S. Energy Information Administration (Mar 2024) / www.eia.gov
Figure 2. The Production and Consumption of fossil fuels in Armenia (left — coal, in the center — gas, right — oil)
Between 2000 and 2022, fossil fuel consumption more than doubled, with demand for gas increasing by 109%, crude oil by 91%, and coal by more than 700%. As mentioned above, all fossil fuels are imported.
Sources: U.S. Energy Information Administration (Mar 2024) / www.eia.gov | ||
| Figure 3. Electricity Generation in Armenia |
Between 2011 and 2022, the country's electricity production level remained roughly flat, while consumption increased by 30%. Armenia exports some of the electricity produced, exchanging most of it for natural gas from Iran.
If we look at the resources from which electricity is generated, it is still dominated by fossil fuels, although there has been some movement towards renewable sources in recent years. Armenia produces almost as much electricity from nuclear power as from hydroelectricity. According to the U.S. Energy Information Administration data, gross electricity generation was dominated by fossil fuels (43.4%), followed by hydroelectricity (22.8%), nuclear energy (30.0%), and other renewable sources (3.8%).
| Sources: 1. Crude oil proved reserves, 2021 / International Energy Statistic/Geography / U.S. Energy Information Administration (Nov 2021)*98 2. Natural gas proved reserves 2021 / International Energy Statistic / Geography / U.S. Energy Information Administration (Nov 2021) *99 3. Total recoverable coal reserves 2019 / International Energy Statistic / Geography / U.S. Energy Information Administration (Nov 2021) *81 4. Combination production-consumption for Crude oil 2018 / International Energy Statistic / Geography / U.S. Energy Information Administration (Nov 2021) *219 5. Combination production-consumption for Natural gas 2019 / International Energy Statistic / Geography / U.S. Energy Information Administration (Nov 2021) *123 6. Combination production-consumption for Coal 2019 / International Energy Statistic / Geography / U.S. Energy Information Administration (Nov 2021) *128 7. Electricity – from other renewable sources (% of total installed capacity), 2017 est. / The World Factbook / Library / Central Intelligence Agency *170 8. GDP per unit of energy use (PPP per unit of oil equivalent), 2020 *66 Primary energy consumption - BP Statistical Review of World Energy 2021/BP;GDP (purchasing power parity) - The World Factbook/Library/Central Intelligence Agency 9. Energy use (primary energy use of oil equivalent per capita) 2020 *127 Primary energy consumption – BP Statistical Review of World Energy 2021; Population - United Nations, Department of Economic and Social Affairs, Population Division (2019). World Population Prospects 2019, custom data acquired via website. Retrieved 15 November 2021*66 10. The Global Energy Architecture Performance Index Report (EAPI) 2017 / Rankings / Reports / World Economic Forum 11. Electric power consumption (kWh per capita), 2016 *217 Electricity Consumption - The World Factbook / Library / Central Intelligence Agency; Population - United Nations, Department of Economic and Social Affairs, Population Division (2019). World Population Prospects 2019, custom data acquired via website. Retrieved 15 November 2021 12. Combination of electricity production-consumption (kWh)/The World Factbook/Library/Central Intelligence Agency *216 * Total number of countries participating in ranking Figure 4. Energy indices of Armenia |
The energy indices shown in the graph above reveal Armenia as a country dealing with high energy demands. Since Armenia has no significant fossil fuel reserves, the country's positions in crude oil and natural gas remain blank in the chart above. The strongest indicators reflected on the graph are Combination production-consumption for coal (0.76) and Combination of electricity production-consumption (0.61). In addition, Armenia has a relatively good performance in GDP per unit of energy use (0.55).
Energy Infrastructure
Armenia does not have large reserves of crude oil, natural gas and coal. There is currently no fossil fuels production in the country [13]. Since Armenia is fully dependent on imports from other countries and natural gas accounts for a significant part of its total energy consumption, the gas pipeline system can rightly be called the main infrastructural part of the fossil fuel sector in Armenia. The lion's share of natural gas is imported from Russia via pipeline through Georgia. A small portion also comes from Iran under a barter agreement, under which Armenia exports electricity there.
Figure 5. Basic infrastructural facilities of the fossil fuel sector in Armenia
An important strategic object of the Armenian energy infrastructure is the Abovyan underground gas storage station located on the left bank of the Hrazdan River quite close to Yerevan. This gas storage facility is aimed at equalizing seasonal irregularities in gas consumption, as well as providing natural gas to consumers in case of supply restrictions.
Armenian natural gas-fired power plants are located in the central part of the country, with Hrazdan TPP being the largest electricity generating facility.
Figure 6. Electricity production and Renewable energy in Armenia
As already mentioned, the share of hydropower in total electricity generation in 2022 was 22.8%. Looking at electricity generation from renewable sources, hydroelectricity is leading (93%), followed by solar power (6.9%), and wind power (0.1%). Thus, hydropower, including small hydropower, based mainly on the Hrazdan and Vorotan rivers, is a strategic component of Armenia's electricity system. Argel HPP is the largest operating hydroelectric power plant in Armenia, located in the Yeghvard region and forming part of the Sevan-Hrazdan Cascade, a complex of hydroelectric power plants on the Hrazdan River and its tributaries between Lake Sevan and Yerevan.
A number of renewable energy facilities are already operating in the country. One of the largest solar power plants connected to power grid is the 2.2MW ArSun photovoltaic plant located in the Kotayk province at the central part of the country.
Intensive development of the country's renewable energy sector with maximum use of energy efficiency potential is one of the key priorities of Armenia's 2021 Energy Strategy. The government expects solar PV capacity to be increased to 100 MW by 2024 and to 1,000 MW by 2030, which will raise their share in total generation to 15%. By 2036, the total share of all renewable energy sources, including hydropower, should increase to 66%. To achieve this ambitious target, in addition to solar energy, 191 MW of hydro power plants (small and large) and 500 MW of wind power capacity must be commissioned [14].
Education and Innovation
The following chart shows Armenia's positions in terms of education and innovation:
Sources: 1. The Global Innovation Index 2021, Rankings / Knowledge / World Intellectual Property Organization / Cornell University, INSEAD, and WIPO (2021): Energizing the World with Innovation. Ithaca, Fontainebleau, and Geneva *132 2. Patent Grants 2011-2020, resident & abroad / Statistical country profiles / World Intellectual Property Organization *185 3.Patents in Force 2020 / Statistical country profiles / World Intellectual Property Organization *109 4. QS World University Rankings 2022 *97 5. SCImago Country Rankings (1996-2020) / Country rankings / SCImago, (n.d.). SIR-SCImago Journal & Country Rank [Portal]. Retrieved 17 Nov 2021 *240 6. Internet users in 2018 / The World Factbook / Central Intelligence Agency *229 7. Internet users in 2018 (% Population) / The World Factbook / Central Intelligence Agency *229 8. Government expenditure on education, total (% of GDP), 2019 / United Nations Educational, Scientific, and Cultural Organization (UNESCO) Institute for Statistics. License: CCBY-4.0 / Data as of September 2021*177 9. Research and development expenditure (% of GDP), 2018 / UNESCO Institute for Statistics. License: CCBY-4.0 / Data *119 10. Scientific and technical journal articles, 2018 / National Science Foundation, Science and Engineering Indicators. License: CCBY-4.0 / Data *197 * Total number of countries participating in ranking | ||
| Figure 7. The indices of education and innovation in Armenia |
Six out of ten indexes describing Armenia’s positioning in various international ranking lists related to education and innovation are below the world average. Armenia has the lowest rankings in QS World University Rankings (0.15) and Patents in Force (0.16). These weak positions are partly due to insufficient government expenditure in education (0.16) and research and development (0.29). To the strongest positions of Armenia in terms of education and innovation belong SCImago Country Rankings (0.63) and Patent Grants 2011-2020 (0.61).
Ecology and Environment Protection
Indicators related to environmental issues are presented in the following diagram.
| Sources: 1. CO2 total emission by countries 2020 / European Commission / Joint Research Centre (JRC) / Emission Database for Global Atmospheric Research (EDGAR)*208 2. CO2 per capita emission 2020/European Commission/Joint Research Centre (JRC) / Emission Database for Global Atmospheric Research (EDGAR) *208 3. Forest area 2020 (% of land area) / The Global Forest Resources Assessment 2020 / Food and Agriculture Organization of the United Nations *234 4. Forest area change 2010-2020 (1000 ha/year) / The Global Forest Resources Assessment 2020 / Food and Agriculture Organization of the United Nations *234 5. The Environmental Performance Index (EPI) 2020 / Rankings / Yale Center for Environmental Law & Policy / Yale University *180 6. Annual freshwater withdrawals (m3 per capita), 2017 *179 Annual freshwater withdrawals, total (billion m3), 2017 – Food and Agriculture Organization, AQUASTAT data. /License: CC BY-4.0; Population – United Nations, Department of Economic and Social Affairs, Population Division (2019). World Population Prospects 2019, custom data acquired via website. Retrieved 15 November 2021 7. The National Footprint Accounts 2017 (Biocapacity Credit / Deficit) / Global Footprint Network *188 8. Methane emissions (kt of CO2 equivalent), 2018 / Data for up to 1990 are sourced from Carbon Dioxide Information Analysis Center, Environmental Sciences Division, Oak Ridge National Laboratory, Tennessee, United States. Data from 1990 are CAIT data: Climate Watch. 2020. GHG Emissions. Washington, DC: World Resources Institute. Available at: License : Attribution-NonCommercial 4.0 International (CC BY-NC 4.0) *191 9. The Climate Change Performance Index (CCPI) 2022 / Overall Results / Jan Burck, Thea Uhlich, Christoph Bals, Niklas Höhne, Leonardo Nascimento / Germanwatch, NewClimate Institute & Climate Action Network *60 * Total number of countries participating in ranking | ||
Figure 8. Environmental Indices of Armenia |
Armenia has a rich biodiversity, but as a mountainous country, belongs to the countries with a poor amount of forests. Forest area (0.29) as well as its change (0.34) is among the weakest indicators in terms of environmental issues presented in the chart above. The relatively low amount of forests is reflected in the country's below-average position in the National Footprint Accounts (0.40), which, among other things, count the amount of biologically productive land.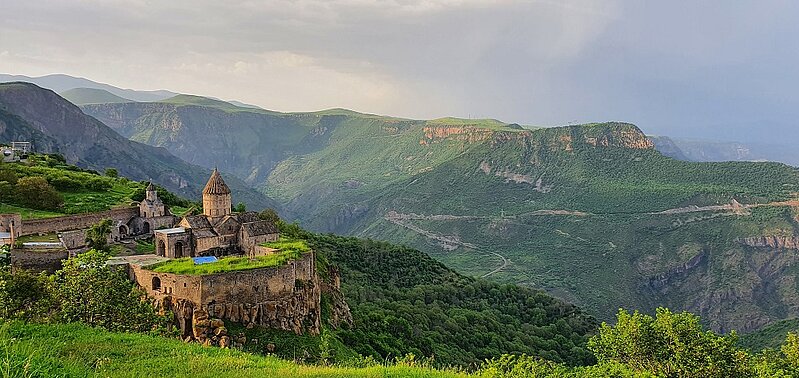
Aerial shot of the Tatev monastery in Tatev, Armenia. Envato Elements. UYHXMRSEPZ
Armenia is not included in the Climate Change Performance Index 2022. Compared to other countries, Armenia's annual freshwater withdrawal is quite high (0.89). In general, the environmental situation in the country looks rather good, primarily due to the fact that the country does not produce fossil fuels and emission rates are relatively low.
References
[1] List of sovereign states and dependencies by area / Wikipedia / en.wikipedia.org/wiki/List_of_sovereign_states_and_dependencies_by_area
[2] List of countries and dependencies by population density / Wikipedia / en.wikipedia.org/wiki/List_of_countries_and_dependencies_by_population_density
[3] Armenia / The world factbook / Library / Central Intelligence Agency / www.cia.gov
[4] GDP, PPP (constant 2011 international $) / World Bank, International Comparison Program database. License: CC BY-4.0 / Data / The World Bank / www.worldbank.org
[5] GDP per capita, PPP (current international $) / World Bank, International Comparison Program database. License: CC BY-4.0 / Data / The World Bank / www.worldbank.org
[6] International Energy Statistic / Geography / U.S. Energy Information Administration / www.eia.gov/beta/international/
[7] 2010 Survey of Energy Resources (PDF) / 2010 / Uploads / World Energy Council / https://www.worldenergy.org/
[8] Solar resource data obtained from the Global Solar Atlas, owned by the World Bank Group and provided by Solargis / Global Solar Atlas / globalsolaratlas.info
[9] Wind Map / Global Wind Atlas 2.0, a free, web-based application developed, owned and operated by the Technical University of Denmark (DTU) in partnership with the World Bank Group, utilizing data provided by Vortex, with funding provided by the Energy Sector Management Assistance Program (ESMAP). For additional information: globalwindatlas.info
[10] Agricultural land (% of land area) /Food and Agriculture Organization, electronic files and web site. License: CC BY-4.0 / Data / The World Bank / www.worldbank.org
[11] Forest area (% of land area) /Food and Agriculture Organization, electronic files and web site. License: CC BY-4.0 / Data / The World Bank / www.worldbank.org
[12] What a Waste 2.0 (PDF) / Resources / The World Bank / www.worldbank.org
[13] BP Statistical Review of World Energy 2020-2022 (PDF) / BP / www.bp.com
[14] Armenia 2022. Energy Policy Review / PDF / https://iea.blob.core.windows.net/assets/8328cc7c-e65e-4df1-a96f-514fdd0ac31e/Armenia2022EnergyPolicyReview.pdf
The sources of charts and curves are specified under the images.
For more information about the energy industry in Armenia see here