
Contents
General State of the Economy
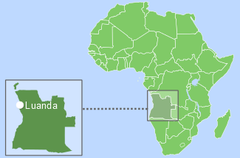
The Republic of Angola is located in the Southwest of the African continent, between Namibia and the Democratic Republic of the Congo. In terms of the size of the territory, Angola is 22nd in the world, and according to the population density the country is 194th [1,2].
The total length of the country's coastline is 1 600 km [3]. According to 2022 statistics, the country is home to around 34,7 million people [3].
| Republic of Angola / República de Angola | ||
|---|---|---|
| Capital: Luanda | Density: 24.97/km2 | Currency: Kwanza (AOA) |
| Official languages: Portuguese | Life expectancy at birth: 62.26 years | GDP (PPP): $ 260.323 billion (2023 est.) |
| National Day: 11 November | Area: 1,246,700 km2 | GDP - per capita (PPP): $7,077 (2023 est.) |
| Population: 35,981,281 (2023 est.) | Coastline: 1,600 km | Internet country code: .ao |
Source: [1,2,3,4,5]
The economy of Angola is mainly orientated towards the export of oil, the revenues from which account for about 70% of GDP [3]. For the majority of the selected indices Angola is either not represented or is at the bottom of the diagram (Fig. 1).
| Sources: 1. GDP (purchasing power parity), 2020 est. / The World Factbook/Library/Central Intelligence Agency *228 2. GDP - per capita (PPP), 2020 / The World Factbook/Library/Central Intelligence Agency *229 3. Inflation rate (consumer prices), 2019 est. / The World Factbook/Library/Central Intelligence Agency *228 4. Charges for the use of intellectual property, receipts (BoP, current US$), 2020 / International Monetary Fund, Balance of Payments Statistics Yearbook, and data files. / License: CC BY-4.0 *88 5. The Global Competitiveness Index 2019 / Rankings / Reports / World Economic Forum *141 6. High-technology exports (current US$) 2019-2020 / United Nations, Comtrade database through the WITS platform / License: CCBY-4.0 / Data *134 7. 2021 Index of Economic Freedom / International Economies / The Heritage Foundation *178 8. Reserves of foreign exchange and gold, 2017 est. / The World Factbook / Library / Central Intelligence Agency *195 9. Annual average GDP growth in %, for the last 10 years (2011-2020) / World Bank national accounts data, and OECD National Accounts data files / License: CC BY-4.0 *206 10. Public debt (% of GDP), 2017 est. / The World Factbook / Library / Central Intelligence Agency (from smallest to largest) *210 * Total number of countries participating in ranking Figure 1. Economic Indices of Angola |
Between 1994 and 2015, the country experienced rapid growth in GDP at purchasing power parity, amounting to $193.6 billion in 2017, and $203.71 in 2020 [3,4]. For this indicator Angola is 67th in the world, behind Morocco, but ahead of Sudan [3]. According to the GDP at purchasing power parity per capita, Angola shows a low indicator – $6,200 in 2020 (161st) [3,5]. The inflation rate in 2019 was 17.2% compared to 32.1% in 2017 [3]. The basis of Angola's exports are hydrocarbons. The dominant economic partners are China and India.
According to the Index of Economic Freedom, which is based on freedom of business, freedom from government intervention, property protection, and freedom from corruption, Angola was 140th in 2021, out of the 178 countries considered, ahead of many countries in the region, including Algeria. In terms of reserves of foreign exchange and gold, Angola is 63rd out of 195 countries. According to the indicator for the average GDP growth in percentage over the last 10 years, in 2020 the country was 146th out of 206 countries. In terms of public debt, calculated as a percentage of the country's GDP, Angola was ranked 60th out of 210 countries considered in 2017.
Energy Resources
The main resource of the country is definitely oil (Table 1). In terms of tons of oil equivalent, in 2021 proved reserves of conventional hydrocarbons in Angola were: oil – 77.5%, gas – 22.5% (Fig.5).
Table 1. Fossil energy resources of Angola
| Resource /Explanations | Crude oil* | Natural gas* | Coal | Shale Gas | Tight Oil | Oil Shale | Extra heavy oil |
|---|---|---|---|---|---|---|---|
| Value | 7.8(0.46%) | 13.5(0.19%) | - | - | - | - | - |
| Unit | billion barrels | Tcf | - | - | - | - | - |
| Year | 2021 | 2020 | - | - | - | - | - |
| Source | [15] | [15] | - | - | - | - | - |
*share of the country’s reserves in world total is provided in brackets
According to the information presented in [3], as of the beginning of 2021, oil reserves in the country amounted to 7.783 billion barrels and gas reserves were 343 Tcm. According to the BP report, from 1999 to 2020, the total proved oil reserves grew from 5.1 to 7.8 billion barrels [6].
Angola has a significant potential for the development of renewable energy (Table 2).
Table 2. Renewable energy resources of Angola
| Resource/ Explanations | Solar Potential (GHI)* | Wind Potential (50 м)* | Hydro energy Potential | Bio Potential (agricultural area) | Bio Potential (forest area) | Municipal Solid Waste |
|---|---|---|---|---|---|---|
| Value | 5.5 - 6.3 | 3.5 - 4.5 | 18.2 | 45.7 | 53.4 | 0.46 |
| Unit | kWh/m2/day | m/s | GW | % of land area | % of land area | kg/capita/day |
| Year | 2018 | 2018 | 2017 | 2020 | 2020 | 2016 |
| Source | [7] | [8] | [9] | [10] | [11] | [12] |
*for most of the territory of the country
Due to its favourable geographical location, Angola has a significant potential for the development of solar energy. The most typical level of global horizontal irradiation is 5.5-6.3 kW/m²/ day [7]. Wind speed in most parts of Angola is 3.5-4.5 m/s [8].
The country’s estimated hydropower potential is 18.2 GW [9]. 53.4% of the county is forested with around 45.7% covered by agricultural land [10,11]. Potential for the use of ocean energy and sea wave energy in the south of the country can reach 10 kW/m [13].
The level of generation of municipal waste in Angola is 0.46 Kg/capita/day, and by 2025 it could reach the level of 0.7 Kg/capita/day [12].
Energy Balance
Angola is the second largest oil producer in the region after Nigeria [14]. Oil production has been growing since 2001, then stabilized in 2008, and in 2017 it was 1 706 thousand barrels/day, however decreased to 1 318 in 2020 and 1 197 in 2021 [15].
The volume of consumption of this resource demonstrated stable growth (Fig. 2), and in 2019 reached the level of 133 thousand barrels/day, compared to 56 thousand barrels/day in 2006 [15]. As reported in [3, 15], the volume of oil exports from Angola in 2018 amounted to 1.367 million bbl/day.
Source: U.S. Energy Information Administration (Oct 2022) / https://www.eia.gov
Figure 2. The Production and Consumption of fossil fuels in Angola (coal – left, in the center – gas, oil – right)
Internal natural gas production in 2021 was 207 Bcf, demonstrating strong growth, compared to 60 Bcf in 2016 [15]. In 2019, according to [3], gas production amounted to 6.767 billion m3. Gas consumption in Angola has remained relatively stable since 2001; in 2021 the country consumed 32 Bcf [15]. In 2019 Angola exported 5.877 Bcf of natural gas, the main importers were China, Brazil and South Korea [3].
Historically, Angola has a high share of hydropower in electricity production (Fig. 3).
Sources: U.S. Energy Information Administration (Sep 2023) / https://www.eia.gov/ | ||
| Figure 3. Electricity Generation in Angola |
In 2021 Angola produced about 16.90 GWh of electricity, of which 71% was by hydropower, 28% by fossil fuel, and 1% by other renewable sources (Fig. 5).
Angola’s position in the comparative diagram of energy index is shown in Fig. 4.
As mentioned previously, the country has a potential of traditional fossil resources, which provides a high level of indices associated with crude oil and natural gas.
| Sources: 1. Crude oil proved reserves, 2021 / International Energy Statistic/Geography / U.S. Energy Information Administration (Nov 2021)*98 2. Natural gas proved reserves 2021 / International Energy Statistic / Geography / U.S. Energy Information Administration (Nov 2021) *99 3. Total recoverable coal reserves 2019 / International Energy Statistic / Geography / U.S. Energy Information Administration (Nov 2021) *81 4. Combination production-consumption for Crude oil 2018 / International Energy Statistic / Geography / U.S. Energy Information Administration (Nov 2021) *219 5. Combination production-consumption for Natural gas 2019 / International Energy Statistic / Geography / U.S. Energy Information Administration (Nov 2021) *123 6. Combination production-consumption for Coal 2019 / International Energy Statistic / Geography / U.S. Energy Information Administration (Nov 2021) *128 7. Electricity – from other renewable sources (% of total installed capacity), 2017 est. / The World Factbook / Library / Central Intelligence Agency *170 8. GDP per unit of energy use (PPP per unit of oil equivalent), 2020 *66 Primary energy consumption - BP Statistical Review of World Energy 2021/BP;GDP (purchasing power parity) - The World Factbook/Library/Central Intelligence Agency 9. Energy use (primary energy use of oil equivalent per capita) 2020 *127 Primary energy consumption – BP Statistical Review of World Energy 2021; Population - United Nations, Department of Economic and Social Affairs, Population Division (2019). World Population Prospects 2019, custom data acquired via website. Retrieved 15 November 2021*66 10. The Global Energy Architecture Performance Index Report (EAPI) 2017 / Rankings / Reports / World Economic Forum 11. Electric power consumption (kWh per capita), 2016 *217 Electricity Consumption - The World Factbook / Library / Central Intelligence Agency; Population - United Nations, Department of Economic and Social Affairs, Population Division (2019). World Population Prospects 2019, custom data acquired via website. Retrieved 15 November 2021 12. Combination of electricity production-consumption (kWh)/The World Factbook/Library/Central Intelligence Agency *216 * Total number of countries participating in ranking Figure 4. Energy indices of Angola |
The share of renewable energy in electricity production in Angola is about 1.6%, and in 2017 the country was 131st out of 170 countries selected for consideration.
In terms of electricity consumption per capita, the country is 173rd in the world; however, for the indicator of combination of electricity production-consumption, Angola is 90th in the ranked list of 216 countries.
Energy Infrastructure
The main offshore deposits of Angola are located northwest of its mainland. Deposits are divided into blocks, which in turn are divided into three groups; shallow water blocks 0-13 (group A); deep water blocks 14-30 (group B); and ultra-deepwater blocks 31-40 (group C). Exploration is also currently under way in a super-deep shelf below the Congo Basin. On the mainland, deposits are concentrated in the Cabinda region [16].
The country's main mining companies are the national Sociedade Nacional de Combustiveis de Angola (Sonangol), a Chevron subsidiary, Cabinda Gulf Oil Company (CABGOC), ExxonMobil, Total, and BP. Also, recently the Chinese Sinopec and CNOOC entered the Angolan market [11]. Infrastructure is concentrated in close proximity to deposits and along the coast. Angola exports various types of oil, including Cabinda Crude, with a sulphur content of about 0.12% and a density of 32.5 API [17].
Key oil terminals are also concentrated near the fields, a short distance from the capital. Currently, the country has a large LNG terminal - Angola Soyo LNG Terminal, with an installed capacity of 5.2 million tons/year [18]. The installed capacity of the existing Sonangol plant - Luanda Oil Refinery - 120 thousand barrels/day [19].
Figure 5. Basic Infrastructure facilities of the fossil fuel and electricity sector in Angola
Angola relies on hydropower to generate electricity, therefore hydroelectric and mixed-type power plants prevail in the country (Figure 5). The largest and most recent hydropower plant is Cambambe-2 with four units of 175 MW each [20]. The main operators of hydropower plants are Empresa de Producao de Electricidad and Empresa Nacional de Electricidade. As for the gas industry, it is worth noting the Soyo combined cycle power plant, which has a capacity of 750 MW [21].
The main focus of the national energy development strategy until 2025 is to increase electricity production capacity by 6 GW, 5 GW of which will be generated by means of hydropower [23]. It is also planned to commission Laúca hydroelectric power station with an installed capacity of 2070 MW [22] and to implement a number of joint projects with Namibia that will be built on the state border. Despite significant financial investments in hydropower, by 2017 it will be possible to activate only 30% of the country's total hydropower potential; in the long term it is planned to increase hydropower capacity to 9.9 GW [9].
Another priority area of the energy strategy is to increase the share of gas in the production of electricity by non-renewable sources up to 50% by increasing the installed capacity to 2.3 GW. The dynamics in this area was due to the doubling of the LNG capacity of the Angola Soyo terminal and the transition to natural gas of a number of combined cycle power plants at Cabinda, Luanda, Benguela and Namibe [9].
It is worth mentioning that the electrical infrastructure of Angola was badly damaged during the civil war. The government of the country, with the help of financial support from China, is carrying out restoration work, but only 20% of the country's population has access to electricity, by 2025 the government plans to increase this number to 60%. In this regard, wood fuel and charcoal are actively used in households. According to the UN, charcoal consumption in Angola is growing by 3% annually [9]. The country also has a Cacuso bioethanol plant owned by Biocom, which in 2019 produced 20,000 cubic metres of ethanol and 60 megawatts of electricity [24].
As noted above, Angola has excellent environmental conditions for the development of solar energy; therefore, as part of the national energy strategy until 2025, Angola also plans to build a number of solar power plants with a total capacity of 78 MW. In the field of wind energy it is also planned to implement a number of projects, one large in the Tombwa area and two small in Cuanza Norte and Lubango, thereby reaching a total installed capacity of 100 MW by 2025 [9].
Education and Innovation
The set of indices reflecting the position of Angola among other countries in the field of education and innovation can be seen in Figure 6. Angola is in the red zone in most of the ratings selected for this chart, thereby demonstrating a low level of education and innovation.
Sources: 1. The Global Innovation Index 2021, Rankings / Knowledge / World Intellectual Property Organization / Cornell University, INSEAD, and WIPO (2021): Energizing the World with Innovation. Ithaca, Fontainebleau, and Geneva *132 2. Patent Grants 2011-2020, resident & abroad / Statistical country profiles / World Intellectual Property Organization *185 3.Patents in Force 2020 / Statistical country profiles / World Intellectual Property Organization *109 4. QS World University Rankings 2022 *97 5. SCImago Country Rankings (1996-2020) / Country rankings / SCImago, (n.d.). SIR-SCImago Journal & Country Rank [Portal]. Retrieved 17 Nov 2021 *240 6. Internet users in 2018 / The World Factbook / Central Intelligence Agency *229 7. Internet users in 2018 (% Population) / The World Factbook / Central Intelligence Agency *229 8. Government expenditure on education, total (% of GDP), 2019 / United Nations Educational, Scientific, and Cultural Organization (UNESCO) Institute for Statistics. License: CCBY-4.0 / Data as of September 2021*177 9. Research and development expenditure (% of GDP), 2018 / UNESCO Institute for Statistics. License: CCBY-4.0 / Data *119 10. Scientific and technical journal articles, 2018 / National Science Foundation, Science and Engineering Indicators. License: CCBY-4.0 / Data *197 * Total number of countries participating in ranking Figure 6. The indices of education and innovation in Angola |
The country shows only two indexes corresponding to global average indicators - this is the index of Internet users (51st in the world in 2020), and Scimago Journal and Country Rank, which ranked the country is 159th in the world out of 240 countries. According to the Scientific and Technical journal articles, in 2018 Angola was 154th out of 197 countries.
Despite the fact that Angola ranks last 132nd in the Global Innovation Index 2021, the very fact of its return to this ranking, in which the country was last included in 2015, is positive.
According to the number of patents granted to Angolan residents, both inside the country and abroad, the country ranks 143rd in the world. By the number of patents in force, Angola ranks 97th out of 109 countries, indicating the country's unfavorable conditions for innovation.
In terms of the amount of government expenditure on research and development as a percentage of GDP, the country is 114th in the world. In terms of government expenditure on education as a percentage of the country's GDP, the country is 145th out of 177 countries considered.
Ecology and Environment Protection
A diagram of environmental indices of Angola is shown in Figure 7. These indices are quite controversial. Despite the active use of hydro resources in electricity production, CO2 emissions per capita are high.
At the same time, having a relatively large forest area, the country is showing negative trends in this area. As mentioned above, charcoal consumption is increasing, leading to deforestation. Every year, Angola loses an average of 106 thousand hectares of forest and 370 hectares of plantations [9].
| Sources: 1. CO2 total emission by countries 2020 / European Commission / Joint Research Centre (JRC) / Emission Database for Global Atmospheric Research (EDGAR)*208 2. CO2 per capita emission 2020/European Commission/Joint Research Centre (JRC) / Emission Database for Global Atmospheric Research (EDGAR) *208 3. Forest area 2020 (% of land area) / The Global Forest Resources Assessment 2020 / Food and Agriculture Organization of the United Nations *234 4. Forest area change 2010-2020 (1000 ha/year) / The Global Forest Resources Assessment 2020 / Food and Agriculture Organization of the United Nations *234 5. The Environmental Performance Index (EPI) 2020 / Rankings / Yale Center for Environmental Law & Policy / Yale University *180 6. Annual freshwater withdrawals (m3 per capita), 2017 *179 Annual freshwater withdrawals, total (billion m3), 2017 – Food and Agriculture Organization, AQUASTAT data. /License: CC BY-4.0; Population – United Nations, Department of Economic and Social Affairs, Population Division (2019). World Population Prospects 2019, custom data acquired via website. Retrieved 15 November 2021 7. The National Footprint Accounts 2017 (Biocapacity Credit / Deficit) / Global Footprint Network *188 8. Methane emissions (kt of CO2 equivalent), 2018 / Data for up to 1990 are sourced from Carbon Dioxide Information Analysis Center, Environmental Sciences Division, Oak Ridge National Laboratory, Tennessee, United States. Data from 1990 are CAIT data: Climate Watch. 2020. GHG Emissions. Washington, DC: World Resources Institute. Available at: License : Attribution-NonCommercial 4.0 International (CC BY-NC 4.0) *191 9. The Climate Change Performance Index (CCPI) 2022 / Overall Results / Jan Burck, Thea Uhlich, Christoph Bals, Niklas Höhne, Leonardo Nascimento / Germanwatch, NewClimate Institute & Climate Action Network *60 * Total number of countries participating in ranking Figure 7. Environmental Indices of Angola |
The Environmental Performance Index, which measures the effectiveness of the state’s environmental policy, is rather low in Angola (158th out of 180 member countries); however, the Environmental Vulnerability Index results (20th out of 234 member countries) and Ecological Footprint atlas results are the highest in the selected ratings.
References
[1] List of sovereign states and dependencies by area / Wikipedia / https://en.wikipedia.org/wiki/List_of_sovereign_states_and_dependencies_by_area
[2] List of countries and dependencies by population density / Wikipedia / https://en.wikipedia.org/wiki/List_of_countries_and_dependencies_by_population_density
[3] Angola / The world factbook / Library / Central Intelligence Agency / https://www.cia.gov/
[4] GDP, PPP (constant 2017 international $) / World Bank, International Comparison Program database. License: CC BY-4.0/ Data/ The World Bank/ http://www.worldbank.org/
[5] GDP, PPP (constant 2017 international $) per capita / World Bank, International Comparison Program database. License: CC BY-4.0/ Data/ The World Bank/ http://www.worldbank.org/
[6] BP Statistical Review of World Energy 2020 - 2022 (PDF)/ BP/ https://www.bp.com/
[7] Solar resource data obtained from the Global Solar Atlas, owned by the World Bank Group and provided by Solargis/ Global Solar Athlas/ http://globalsolaratlas.info/
[8] Wind Map/ Global Wind Atlas 2.0, a free, web-based application developed, owned and operated by the Technical University of Denmark (DTU) in partnership with the World Bank Group, utilizing data provided by Vortex, with funding provided by the Energy Sector Management Assistance Program (ESMAP). For additional information: https://globalwindatlas.info
[9] Angola Energia 2025 / Ministry of ENergy and Water / http://www.angolaenergia2025.com/sites/default/files/editor/livro_angola_energia_2025_baixa.pdf
[10] Agricultural land (% of land area)/ Food and Agriculture Organization, electronic files and web site. License: CC BY-4.0/ Data/ The World Bank/ http://www.worldbank.org
[11] Forest area (% of land area)/Food and Agriculture Organization, electronic files and web site. License: CC BY-4.0/ Data/ The World Bank/ http://www.worldbank.org/
[12] World Bank What a Waste/ Data/ The World Bank/ http://www.worldbank.org
[13] Wave power / Wikipedia / https://en.wikipedia.org/wiki/Wave_power
[14] Angola / Analysis / U.S. Energy Information Administration / January 25, 2021 / www.eia.gov/international/analysis/country/AGO
[15] International Energy Statistic / Geography / U.S. Energy Information Administration / www.eia.gov/international
[16] Angola Oil and Gas Profile / A Barrel Full / http://abarrelfull.wikidot.com/home
[17] Kabinda Crude / A Barrel Full / http://abarrelfull.wikidot.com/home
[18] Angola Soyo LNG Terminal / A Barrel Full / http://abarrelfull.wikidot.com/home
[19] Luanda Refinery / A Barrel Full / http://abarrelfull.wikidot.com/home
[20] Cambambe Hydroelectric Power Station / Wikipedia / en.wikipedia.org/wiki/Cambambe_Hydroelectric_Power_Station
[21] Soyo I Thermal Power Station / Wikipedia / en.wikipedia.org/wiki/Soyo_I_Thermal_Power_Station
[22] Laúca Hydroelectric Power Station / Wikipedia / en.wikipedia.org/wiki/La%C3%BAca_Hydroelectric_Power_Station
[23] Rapid Assessment and Gap Analysis | ANGOLA / Sustainable Energy For All / www.se4all-africa.org/fileadmin/uploads/se4all/Documents/Country_RAGAs/Angola_RAGA_EN_Released.pdf
[24] Angola’s bioenergy company starts exporting ethanol to Europe / Macauhub / 6 May 2019 / macauhub.com.mo
The sources of charts and curves are specified under the images.
For more information about the energy industry in Angola see here