
Contents
General State of the Economy
The State of Vietnam or the Socialist Republic of Vietnam is located on the Indochina Peninsula in Southeast Asia. Vietnam has land borders with Laos and Cambodia in the west and China in the north. In the east and in the south, Vietnam has a long coastline with access to the South China Sea.
| Vietnam / Socialist Republic of Vietnam | ||
|---|---|---|
| Capital: Hanoi | Density: 298.0/km2 | Currency: dong (VND) |
| Official languages: Vietnamese | Life expectancy at birth: 75.52 years | GDP (PPP): $1 434 trillion (2023 est.) |
| National Day: 2 September | Area (land): 331,210 km2 | GDP - per capita (PPP): $14,285 (2023 est.) |
| Population: 100,300,000 (2023 est.) | Coastline: 3,444 km | Internet country code: .vn |
Source: [1,2,3,4,5]
According to 2023 statistics, Vietnam, which ranks 66th in the world in terms of the size of its territory, is home to around 100 million people. In terms of population density, the country occupies the 49th place in the world [1,2,3]. The total length of the country's coastline is 3,444 km [3]. The political form of government is Unitary Marxist–Leninist one-party socialist republic. The administrative map of the country is divided into 58 provinces and five municipalities [3].
Vietnam’s ranking positions relative to other countries have been determined for an extensive list of economic, energy, innovative and educational indices, as well as for metrics reflecting the state of the environment. The economic indices include, for example, GDP per capita, annual average GDP growth, high-technology exports, and others. The list of energy indices includes proven reserves of oil, gas and coal, production-consumption ratio combined, and energy use, etc. Each of the indices has a ranked list of included member countries. Since the number of countries in each rating is different for each index, the positioning of the country of interest is displayed on a special chart, where the vertical axis is a uniform relative scale from 0 to 1, whereas the horizontal axis denominates the various indices and respective numbers relating to the descriptions given underneath.
Thus, in such a relative “0-1” diagram, the country’s position is marked with a dot in proportion to its location in the original rating list. If the country is among the leaders regarding the selected indicator, it will be marked close to 1 in the upper green zone on the relevant chart “0-1”, if the country is an outsider in the rating list, then it will be marked in the lower red zone of the chart “0-1”, etc.
Ranking position of Vietnam for list of economic indices:
| Sources: 1. GDP (purchasing power parity), 2020 est. / The World Factbook/Library/Central Intelligence Agency *228 2. GDP - per capita (PPP), 2020 / The World Factbook/Library/Central Intelligence Agency *229 3. Inflation rate (consumer prices), 2019 est. / The World Factbook/Library/Central Intelligence Agency *228 4. Charges for the use of intellectual property, receipts (BoP, current US$), 2020 / International Monetary Fund, Balance of Payments Statistics Yearbook, and data files. / License: CC BY-4.0 *88 5. The Global Competitiveness Index 2019 / Rankings / Reports / World Economic Forum *141 6. High-technology exports (current US$) 2019-2020 / United Nations, Comtrade database through the WITS platform / License: CCBY-4.0 / Data *134 7. 2021 Index of Economic Freedom / International Economies / The Heritage Foundation *178 8. Reserves of foreign exchange and gold, 2017 est. / The World Factbook / Library / Central Intelligence Agency *195 9. Annual average GDP growth in %, for the last 10 years (2011-2020) / World Bank national accounts data, and OECD National Accounts data files / License: CC BY-4.0 *206 10. Public debt (% of GDP), 2017 est. / The World Factbook / Library / Central Intelligence Agency(from smallest to largest) *210 * Total number of countries participating in ranking Figure 1. Economic Indices of Vietnam |
In terms of GDP, gold and foreign currency reserves, GDP growth dynamics, and especially, exports of high-tech products, Vietnam demonstrates quite high rates compared to other countries of the world. However, GDP per capita is relatively low. In addition, some data on the use of intellectual property is unavailable.
Energy Resources
Vietnam has substantial proven fossil fuel reserves. The share of oil reserves is 0.26% of the world’s total, the share of natural gas is 0.35%, and for coal this value is 0.32% [6]. The share of the population of Vietnam is approximately 1.3% of the world's population. However, at the same time, oil and gas reserves in Vietnam are significantly lower than those of the world leaders. For instance, oil reserves are more than 22 times less than in the United Arab Emirates, while gas reserves are more than 30 times less than in Qatar. Nevertheless, with regard to the region, the gas reserves in Vietnam are comparable with the reserves of Malaysia or Indonesia, and Vietnam noticeably exceeds these countries in terms of oil [6].
In terms of tons of oil equivalent, according to 2022 data, conventional proved reserves by fuel type were: 65.6% – coal, 16.8% – oil, and 17.6% – gas (Fig.5).
Table 1. Fossil energy resources of Vietnam
| Resource /Explanations | Crude oil* | Natural gas* | Coal* | Tight Oil** | Shale Gas** | Coal mine methane |
|---|---|---|---|---|---|---|
| Value | 4.4 (0.26%) | 24.7 (0.34) | 3 704 (0.32%) | no date | no date | 31.2 - 78.4 |
| Unit | billion barrels | Tcf | million short tons | - | - | bcm |
| Year | 2021 | 2020 | 2021 | - | - | 2018 |
| Source | [6] | [6] | [6] | [-] | [-] | [7,13] |
*unproved technically recoverable
** share of the country’s reserves in world total is provided in brackets
At present, the energy of numerous rivers is the main renewable resource of the country. However, hydropower capacities are close to exhaustion. Vietnam has good potential for wind power development. In a number of regions of the country, especially on the coast, wind speed reaches 8 m/s at a height of 50 m. Considerable forest and agricultural areas suggest that there is plenty of feedstock available for the development of bioenergy.
Table 2. Renewable energy resources of Vietnam
| Resource/ Explanations | Solar Potential (GHI)* | Wind Potential (50 м)* | Bio Potential (agricultural area) | Bio Potential (forest area) | Municipal Solid Waste |
|---|---|---|---|---|---|
| Value | < 4.0 | 5.0-6.5 | 39.4 | 46.7 | 0.33 |
| Unit | kWh/m2/day | m/s | % of land area | % of land area | kg/per capita/day |
| Year | 2018 | 2018 | 2020 | 2020 | 2018 |
| Source | [8] | [9] | [10] | [11] | [12] |
*for the majority of the territory of the country
As in all southern countries, Vietnam has favourable conditions for the development of solar power generation. However, it should be noted that the efficiency of solar energy is largely constrained by considerable cloudiness, which reduces solar activity values. This can be clearly seen in the diagram below. This circumstance makes the use of solar concentrators inefficient and promotes a shift of interests solely towards photovoltaics.
PHAN THIET, VIETNAM, Latitude: 10.93 Longitude: 108.1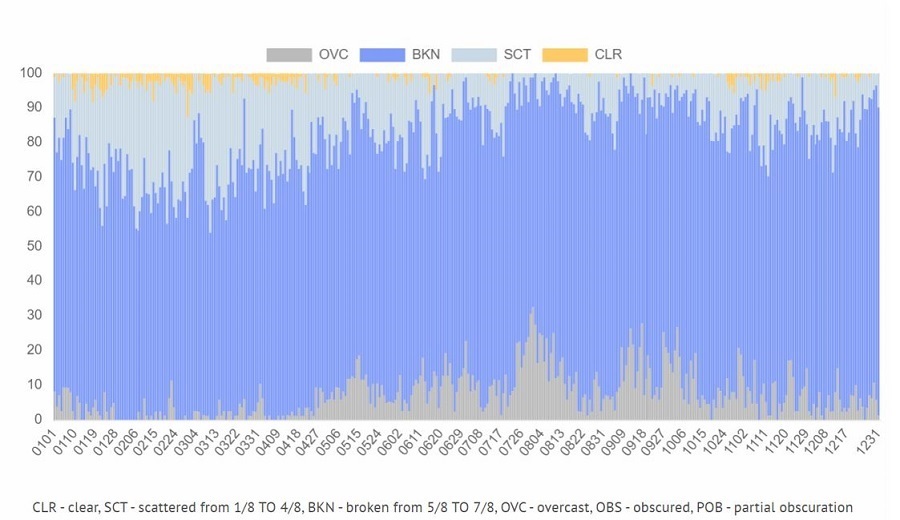
Energy Balance
According to [6], in 2022 in Vietnam, the total production of primary energy was 2.34 quadrillion Btu, while consumption was at the level of 3.841 quadrillion Btu. Thus, the share of domestic production in primary energy consumption was 60.9%. This makes Vietnam a country largely dependent on energy imports. According to the Statistical Review of World Energy 2022, primary energy consumption in Vietnam in 2021 amounted to 4.32 exajoules and was dominated by coal – 49.7 %, followed by: oil – 21.7%, gas – 6.0%, renewables – 6.25%, and hydroelectricity – 16.5% [7].
Source: U.S. Energy Information Administration (Mar 2024) / www.eia.gov
Figure 2. Production and consumption of fossil fuels in Vietnam (left – coal, in the center – gas, right – oil)
Fossil fuel production in Vietnam lags far behind the demand, due to the country's dynamic development in recent years. Thus, starting with 2009 the country was experiencing a shortage of oil, and from 2015 onwards coal followed. In 2022, oil consumption was more than twice as high as production and coal consumption almost twice as high. The parity in gas production and consumption is obviously caused by infrastructural problems – the absence of LNG receiving terminals. Otherwise, the consumption of natural gas would be substantially greater. In 2023, the Government of Vietnam plans to finish the construction of two LNG terminals with a total capacity of more than 150 Bcf/y.
Total electricity generation in Vietnam has grown by almost 2.5 times over the past ten years. In 2022, approximately 57% of electricity was produced by thermal power plants and 30% – by hydroelectric power plants.
Sources: U.S. Energy Information Administration (Mar 2024) / www.eia.gov | ||
| Figure 3. Electricity production in Vietnam |
From 2019, renewable energy started to make a significant contribution to the overall balance of electricity generation, achieving a share of almost 14% in 2022.
The chart of Vietnam's energy indices is presented in the figure below.
| Sources: 1. Crude oil proved reserves, 2021 / International Energy Statistic/Geography / U.S. Energy Information Administration (Nov 2021)*98 2. Natural gas proved reserves 2021 / International Energy Statistic / Geography / U.S. Energy Information Administration (Nov 2021) *99 3. Total recoverable coal reserves 2019 / International Energy Statistic / Geography / U.S. Energy Information Administration (Nov 2021) *81 4. Combination production-consumption for Crude oil 2018 / International Energy Statistic / Geography / U.S. Energy Information Administration (Nov 2021) *219 5. Combination production-consumption for Natural gas 2019 / International Energy Statistic / Geography / U.S. Energy Information Administration (Nov 2021) *123 6. Combination production-consumption for Coal 2019 / International Energy Statistic / Geography / U.S. Energy Information Administration (Nov 2021) *128 7. Electricity – from other renewable sources (% of total installed capacity), 2017 est. / The World Factbook / Library / Central Intelligence Agency *170 8. GDP per unit of energy use (PPP per unit of oil equivalent), 2020 *66 Primary energy consumption - BP Statistical Review of World Energy 2021/BP;GDP (purchasing power parity) - The World Factbook/Library/Central Intelligence Agency 9. Energy use (primary energy use of oil equivalent per capita) 2020 *127 Primary energy consumption – BP Statistical Review of World Energy 2021; Population - United Nations, Department of Economic and Social Affairs, Population Division (2019). World Population Prospects 2019, custom data acquired via website. Retrieved 15 November 2021*66 10. The Global Energy Architecture Performance Index Report (EAPI) 2017 / Rankings / Reports / World Economic Forum 11. Electric power consumption (kWh per capita), 2016 *217 Electricity Consumption - The World Factbook / Library / Central Intelligence Agency; Population - United Nations, Department of Economic and Social Affairs, Population Division (2019). World Population Prospects 2019, custom data acquired via website. Retrieved 15 November 2021 12. Combination of electricity production-consumption (kWh)/The World Factbook/Library/Central Intelligence Agency *216 * Total number of countries participating in ranking Figure 4. Energy indices of Vietnam |
Vietnam is one of the world's leading countries in terms of fossil fuel reserves, however, oil and coal production lags far behind consumption rates. According to the data provided, until 2017, Vietnam had extremely low electricity generation from renewable sources (except for hydropower). However, this trend has changed dramatically in recent years. Against this background, Vietnam has a moderately good ratio of production and consumption of electricity. In terms of such indicators as GDP per unit of energy use and Energy use per capita, Vietnam's rating positions are substantially lower than the world average.
Energy Infrastructure

Vietnam has an extensive network of hydroelectric power plants positioned on numerous rivers, whose headwaters are often located in the mountainous areas of neighbouring countries. They produce more than 30% of electricity. Several large coal plants are located near the coal mining areas in the north of the country. The largest of them, Vin Tan, has a capacity of more than 6 GW. A number of large gas power plants are located in the south in the Ho Chi Minh region, in close proximity to gas production areas.

Hydropower prevails in terms of installed renewable energy capacities (about 50%), followed by solar photovoltaics (about 40%). The share of wind energy in 2022 was less than 10%. At the same time, the volume of electric power generation by hydroelectric power plants in 2021 was about 70% of the total of all renewable sources.

The majority of solar and wind power plants are concentrated in the southern part of the country. Some of them have a capacity of more than 100 MW.
Among other sectors of renewable energy, bioenergy is under active development in Vietnam, especially the production of first-generation ethanol and the production of pellets.
According to expert sources, there is a downward trend in electricity generation through hydropower plants in Vietnam due to saturation. In addition, the demand for coal more and more exceeds production, which constrains the generation of electricity by coal-fired power plants. According to the Government's plans (The National Power Development Plan 8 (PDP8) and the National Energy Master Plan), by 2030 it is planned to increase the generation of electricity from renewable sources up to 32%. The plans involve the establishment of a flexible electricity sale tariff system, the elimination of administrative barriers to development, and the attraction of long-term foreign investment. Considerable attention is paid to the problems of energy storage, which are planned to be solved in Vietnam by the development of a system of pumped storage stations. As mentioned above, several LNG terminals are under construction in Vietnam.
Education and Innovation
The following chart shows Vietnam's positions in terms of education and innovation:
Sources: 1. The Global Innovation Index 2021, Rankings / Knowledge / World Intellectual Property Organization / Cornell University, INSEAD, and WIPO (2021): Energizing the World with Innovation. Ithaca, Fontainebleau, and Geneva *132 2. Patent Grants 2011-2020, resident & abroad / Statistical country profiles / World Intellectual Property Organization *185 3.Patents in Force 2020 / Statistical country profiles / World Intellectual Property Organization *109 4. QS World University Rankings 2022 *97 5. SCImago Country Rankings (1996-2020) / Country rankings / SCImago, (n.d.). SIR-SCImago Journal & Country Rank [Portal]. Retrieved 17 Nov 2021 *240 6. Internet users in 2018 / The World Factbook / Central Intelligence Agency *229 7. Internet users in 2018 (% Population) / The World Factbook / Central Intelligence Agency *229 8. Government expenditure on education, total (% of GDP), 2019 / United Nations Educational, Scientific, and Cultural Organization (UNESCO) Institute for Statistics. License: CCBY-4.0 / Data as of September 2021*177 9. Research and development expenditure (% of GDP), 2018 / UNESCO Institute for Statistics. License: CCBY-4.0 / Data *119 10. Scientific and technical journal articles, 2018 / National Science Foundation, Science and Engineering Indicators. License: CCBY-4.0 / Data *197 * Total number of countries participating in ranking | ||
| Figure 8. Indices of education and innovation in Vietnam |
Vietnam is one of the world leaders in terms of the absolute number of Internet users. The country has slightly lower values for the share of Internet users in the population. Vietnam is well positioned in terms of indicators that assess the intensity of scientific publications by residents of the countries of the world. According to two indices – QS World University Rankings and Research and development expenditure (% of GDP), Vietnam's positions are below the world average.
Ecology and Environment Protection
Indicators related to environmental issues are presented in the following diagram:
| Sources: 1. CO2 total emission by countries 2020 / European Commission / Joint Research Centre (JRC) / Emission Database for Global Atmospheric Research (EDGAR)*208 2. CO2 per capita emission 2020/European Commission/Joint Research Centre (JRC) / Emission Database for Global Atmospheric Research (EDGAR) *208 3. Forest area 2020 (% of land area) / The Global Forest Resources Assessment 2020 / Food and Agriculture Organization of the United Nations *234 4. Forest area change 2010-2020 (1000 ha/year) / The Global Forest Resources Assessment 2020 / Food and Agriculture Organization of the United Nations *234 5. The Environmental Performance Index (EPI) 2020 / Rankings / Yale Center for Environmental Law & Policy / Yale University *180 6. Annual freshwater withdrawals (m3 per capita), 2017 *179 Annual freshwater withdrawals, total (billion m3), 2017 – Food and Agriculture Organization, AQUASTAT data. /License: CC BY-4.0; Population – United Nations, Department of Economic and Social Affairs, Population Division (2019). World Population Prospects 2019, custom data acquired via website. Retrieved 15 November 2021 7. The National Footprint Accounts 2017 (Biocapacity Credit / Deficit) / Global Footprint Network *188 8. Methane emissions (kt of CO2 equivalent), 2018 / Data for up to 1990 are sourced from Carbon Dioxide Information Analysis Center, Environmental Sciences Division, Oak Ridge National Laboratory, Tennessee, United States. Data from 1990 are CAIT data: Climate Watch. 2020. GHG Emissions. Washington, DC: World Resources Institute. Available at: License : Attribution-NonCommercial 4.0 International (CC BY-NC 4.0) *191 9. The Climate Change Performance Index (CCPI) 2022 / Overall Results / Jan Burck, Thea Uhlich, Christoph Bals, Niklas Höhne, Leonardo Nascimento / Germanwatch, NewClimate Institute & Climate Action Network *60 * Total number of countries participating in ranking | ||
| Figure 9. Environmental indices of Vietnam |
Vietnam belongs to the group of countries with the largest amount of carbon dioxide and methane emissions. These facts are also responsible for its low ranking in the Environmental Performance Index (EPI). Among the positive environmental characteristics of the country, the Forest area change in 2010-2020 should be mentioned. Compared to other countries, annual freshwater withdrawals in Vietnam are quite high. In general, the environmental situation in the country requires significant improvement.
References
[1] List of sovereign states and dependencies by area / Wikipedia / https://en.wikipedia.org/wiki/List_of_sovereign_states_and_dependencies_by_area
[2] List of countries and dependencies by population density / Wikipedia / https://en.wikipedia.org/wiki/List_of_countries_and_dependencies_by_population_density
[3] Vietnam / The-world-factbook / Library / Central Intelligence Agency / https://www.cia.gov/
[4] GDP, PPP (constant 2011 international $) / World Bank, International Comparison Program database. License: CC BY-4.0 / Data / The World Bank / http://www.worldbank.org/
[5] GDP per capita, PPP (current international $)/ World Bank, International Comparison Program database. License: CC BY-4.0 / Data / The World Bank / http://www.worldbank.org/
[6] International Energy Statistic / Geography / U.S. Energy Information Administration / http://www.eia.gov/
[7] BP Statistical Review of World Energy 2020 - 2022 (PDF) / BP / https://www.bp.com/
[8] Solar resource data obtained from the Global Solar Atlas, owned by the World Bank Group and provided by Solargis / Global Solar Atlas / http://globalsolaratlas.info/
[9] Wind Map / Global Wind Atlas 2.0, a free, web-based application developed, owned and operated by the Technical University of Denmark (DTU) in partnership with the World Bank Group, utilizing data provided by Vortex, with funding provided by the Energy Sector Management Assistance Program (ESMAP). For additional information: https://globalwindatlas.info
[10] Agricultural land (% of land area) / Food and Agriculture Organization, electronic files and web site. License: CC BY-4.0 / Data / The World Bank / http://www.worldbank.org
[11] Forest area (% of land area) /Food and Agriculture Organization, electronic files and web site. License: CC BY-4.0 / Data / The World Bank / http://www.worldbank.org
[12] World Bank What a Waste / Data / The World Bank / http://www.worldbank.org
[13] 2006 IPCC Guidelines for National Greenhouse Gas Inventories, Volume 2, Energy, Fugitive Emissions (PDF) / The Intergovernmental Panel on Climate Change (IPCC) / www.ipcc-nggip.iges.or.jp
The sources of charts and curves are specified under the images.
For more information about the energy industry in Vietnam see here