
Contents
General State of the Economy
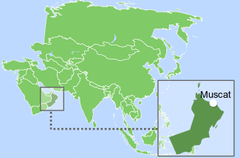
Oman, officially the Sultanate of Oman, is an Arab country located in Western Asia, occupying the southeastern coast of the Arabian Peninsula at the confluence of the Persian Gulf and Arabian Sea. The country has land borders with Saudi Arabia, the United Arab Emirates, and Yemen, and it shares maritime borders with Iran and Pakistan.
| Oman / Sultanate of Oman | ||
|---|---|---|
| Capital: Muscat | Density: 15/km2 | Currency: Omani rial (OMR) |
| Official languages: Arabic | Life expectancy at birth: 76.9 years | GDP (PPP): $200.295 billion (2023 est.) |
| National Day: 18 November | Area (land): 309,500 km2 | GDP - per capita (PPP): $39,336 (2023 est.) |
| Population: 3,764,348 (2022 est.) | Coastline: 2,092 km | Internet country code: .om, عمان. |
Source: [1,2,3,4,5]
According to 2022 statistics, Oman, which in terms of the size of its territory is 72nd in the world, is home to around 3,7 million people. In terms of population density, the country is 219th in the world [1,2,3]. The total length of the country's coastline is 2,092 km [3]. The political form of Oman is an absolute monarchy, where the Sultan of Oman is both head of state and head of government. The administrative map of the country is divided into 11 governorates [3].
Oman’s ranking positions relative to other countries have been determined for an extensive list of economic, energy, innovative and educational indices, as well as for metrics reflecting the state of the environment. The economic indices include, for example, GDP per capita, annual average GDP growth, high-technology exports, and others. The list of energy indices includes proven reserves of oil and gas, production-consumption ratio combined, and energy use, etc. Each of the indices has a ranked list of included member countries. Since the number of countries in each rating is different for each index, the positioning of the country of interest in the rating is displayed on a special chart, where the vertical axis is a uniform relative scale from 0 to 1, whereas the horizontal axis denominates the various indices and respective numbers relating to the descriptions given underneath.
Thus, in such a relative “0-1” diagram, the country’s position is marked with a dot in proportion to its location in the original rating list. If the country is among the leaders regarding the selected indicator, it will be marked close to 1 in the upper green zone on the relevant chart “0-1”, if the country is an outsider in the rating list, then it will be marked in the lower red zone of the chart “0-1”, etc.
Ranking position of Oman for list of economic indices:
| Sources: 1. GDP (purchasing power parity), 2020 est. / The World Factbook/Library/Central Intelligence Agency *228 2. GDP - per capita (PPP), 2020 / The World Factbook/Library/Central Intelligence Agency *229 3. Inflation rate (consumer prices), 2019 est. / The World Factbook/Library/Central Intelligence Agency *228 4. Charges for the use of intellectual property, receipts (BoP, current US$), 2020 / International Monetary Fund, Balance of Payments Statistics Yearbook, and data files. / License: CC BY-4.0 *88 5. The Global Competitiveness Index 2019 / Rankings / Reports / World Economic Forum *141 6. High-technology exports (current US$) 2019-2020 / United Nations, Comtrade database through the WITS platform / License: CCBY-4.0 / Data *134 7. 2021 Index of Economic Freedom / International Economies / The Heritage Foundation *178 8. Reserves of foreign exchange and gold, 2017 est. / The World Factbook / Library / Central Intelligence Agency *195 9. Annual average GDP growth in %, for the last 10 years (2011-2020) / World Bank national accounts data, and OECD National Accounts data files / License: CC BY-4.0 *206 10. Public debt (% of GDP), 2017 est. / The World Factbook / Library / Central Intelligence Agency(from smallest to largest) *210 * Total number of countries participating in ranking Figure 1. Economic Indices of Oman |
The highest indicator for Oman depicted in the ranking is Inflation rate. Data concerning the use of intellectual property and exports of high-tech products is unavailable. The rest of the indicators are well above the average rating values.
Energy Resources
Oman has substantial proven fossil fuel reserves. The share of oil reserves is 0.32% of the world’s total, the share of natural gas is 0.32% as well [6]. The share of the population of Oman is approximately 0.06% of the world's population. However, at the same time, oil and gas reserves in Oman are significantly lower than those of the world leaders. For instance, oil reserves are more than 9 times less than in the United Arab Emirates, while gas reserves are more than 36 times less than in Qatar [6]. It should be taken into account that in most fields in Oman oil has a high density and viscosity, therefore for its extraction costly methods of steam stimulation are used.
Table 1. Fossil energy resources of Oman
| Resource /Explanations | Crude oil* | Natural gas* | Coal | Tight Oil** | Shale Gas** |
|---|---|---|---|---|---|
| Value | 5.373 (0.32%) | 23 (0.32%) | 0 | 6.2 | 48.3 |
| Unit | billion barrels | Tcf | - | billion barrels | Tcf |
| Year | 2021 | 2020 | - | 2015 | 2015 |
| Source | [6] | [6] | [-] | [7] | [7] |
*share of the country’s reserves in world total is provided in brackets
**unproved technically recoverable
In terms of tons of oil equivalent, according to 2024 data, conventional proved reserves by fuel type were: 55.5% – oil, and 44.5% – gas (Fig.5). In addition to conventional oil and gas resources, Oman has significant reserves of Tight Oil и Shale Gas [7].
Because of its location in a desert region, the use of hydropower technology in Oman is not feasible because the country has few permanent water resources. Oman has good potential for wind power development. The most common wind speed is over 6.00 m/s up to 8.00 m/s at 50 m are distributed in the southeastern part of country, in Dhofar and Al Wusta Governorates, in some places along country coast with the Arabian Sea.
Table 2. Renewable energy resources of Oman
| Resource/ Explanations | Solar Potential (DNI)* | Wind Potential (50 м)* | Bio Potential (agricultural area) | Bio Potential (forest area) | Municipal Solid Waste |
|---|---|---|---|---|---|
| Value | 5.0-6.0 | 4.5-6.0 | 4.7 | 0.0 | 1.19 |
| Unit | kWh/m2/day | m/s | % of land area | % of land area | kg/per capita/day |
| Year | 2018 | 2018 | 2020 | 2020 | 2018 |
| Source | [8] | [9] | [10] | [11] | [12] |
*for the majority of the territory of the country
Like all southern countries, Oman has favourable conditions for the development of solar power generation.
There are many areas in the country where solar activity averages 6.0 kWh/m2 per day. The highest DNI solar intensity reaches 6.8-7.1 kWh/m2 per day, which is recorded in the south, in Dhofar province and in some places in the northeast between the three governorates of Oman.
Due to the lack of forests and the small area of agricultural land in the country, there is little raw material for the development of bioenergy. However, there is potential to use animal manure and wastewater for electricity generation [13].
Energy Balance
According to [6], in 2022 in Oman, the total production of primary energy was 3.753 quadrillion Btu, while consumption was at the level of 1.411 quadrillion Btu. Thus, the share of domestic consumption in primary energy production is 37.6%, meaning that Oman is largely energy independent. The country is an important exporter of crude oil and gas, in particular to Asian countries. According to the BP Statistical Review of World Energy 2022, primary energy consumption in Oman in 2021 amounted to 1.50 exajoules and was dominated by natural gas – 71%, followed by oil – 28%, and coal – 0.7% [14].
Source: U.S. Energy Information Administration (Mar 2024) / www.eia.gov
Figure 2. The production and consumption of fossil fuels in Oman (left – coal, in the center – gas, right – oil)
Although fossil fuel consumption has increased in recent years, gas and oil production in Oman significantly exceeds domestic demand. In 2022, oil production was more than forth times higher than consumption and gas production about one and a half times higher. As noted above, natural gas accounted for about 70% of Oman’s domestic energy consumption. The only fossil product fully imported in Oman is coal, although consumption is insignificant. Total electricity generation and consumption in Oman have grown almost 2 times over the past ten years. In 2022, approximately 99% of electricity was produced by thermal power plants.
Sources: U.S. Energy Information Administration (Mar 2024) / www.eia.gov | ||
| Figure 3. Electricity generation in Oman |
Renewables make almost no contribution to the overall electricity production balance, barely reaching a share of 0.6% through solar power plants.
The chart of Oman's energy indices is presented in the figure below.
| Sources: 1. Crude oil proved reserves, 2021 / International Energy Statistic/Geography / U.S. Energy Information Administration (Nov 2021)*98 2. Natural gas proved reserves 2021 / International Energy Statistic / Geography / U.S. Energy Information Administration (Nov 2021) *99 3. Total recoverable coal reserves 2019 / International Energy Statistic / Geography / U.S. Energy Information Administration (Nov 2021) *81 4. Combination production-consumption for Crude oil 2018 / International Energy Statistic / Geography / U.S. Energy Information Administration (Nov 2021) *219 5. Combination production-consumption for Natural gas 2019 / International Energy Statistic / Geography / U.S. Energy Information Administration (Nov 2021) *123 6. Combination production-consumption for Coal 2019 / International Energy Statistic / Geography / U.S. Energy Information Administration (Nov 2021) *128 7. Electricity – from other renewable sources (% of total installed capacity), 2017 est. / The World Factbook / Library / Central Intelligence Agency *170 8. GDP per unit of energy use (PPP per unit of oil equivalent), 2020 *66 Primary energy consumption - BP Statistical Review of World Energy 2021/BP;GDP (purchasing power parity) - The World Factbook/Library/Central Intelligence Agency 9. Energy use (primary energy use of oil equivalent per capita) 2020 *127 Primary energy consumption – BP Statistical Review of World Energy 2021; Population - United Nations, Department of Economic and Social Affairs, Population Division (2019). World Population Prospects 2019, custom data acquired via website. Retrieved 15 November 2021*66 10. The Global Energy Architecture Performance Index Report (EAPI) 2017 / Rankings / Reports / World Economic Forum 11. Electric power consumption (kWh per capita), 2016 *217 Electricity Consumption - The World Factbook / Library / Central Intelligence Agency; Population - United Nations, Department of Economic and Social Affairs, Population Division (2019). World Population Prospects 2019, custom data acquired via website. Retrieved 15 November 2021 12. Combination of electricity production-consumption (kWh)/The World Factbook/Library/Central Intelligence Agency *216 * Total number of countries participating in ranking Figure 4. Energy indices of Oman |
Oman is one of the world's leading countries in terms of natural gas and oil reserves with production exceeding consumption rates. According to the data provided, Oman has extremely low electricity generation from renewable sources. However, Oman plans to launch several renewable energy projects in the next few years, thus realizing the country's huge solar potential. The country has a good ratio of production and consumption of electricity. In terms of GDP per unit of energy use, Oman's rating positions are substantially lower than the world average. On the contrary, the indicator of energy use per capita is very high.
Energy Infrastructure
A territorial map showing distribution of the largest infrastructure projects of the fossil fuel sector in Oman is displayed in Figure 5. As previously mentioned, oil reserves account for 55.5% of conventional proved reserves and natural gas for 44.5% (Fig.5).
The main oil and gas fields under development are located in the in the central and north-western part of the country, while the main heavy oil extraction fields are located closer to its southern regions. Oman’s conventional oil infrastructure include 2 operating oil refineries with a total crude oil processing capacity of 303 000 bpd; some oil terminals and oil storages. Another refinery at the port town of Duqm with a capacity of 230,000 barrels per day will be commissioned at the end of 2023. There are 3558 km of crude oil and 264 km of refined products pipelines.
Oman is one of the most advanced countries in the world in terms of heavy oil extraction. International thematic exhibitions and conferences devoted to this sector are traditionally held here. Many oil companies apply advanced technologies to develop heavy oil fields. In 2018, Petroleum Development Oman and GlassPoint Solar launched the first phase of the unique Miraah CSP project, which combines technologies to concentrate solar energy and inject steam into oil-bearing formations to subsequently reduce oil viscosity and facilitate its delivery to the surface. Solar energy is concentrated through parabolic mirrors, whose design was developed by GlassPoint Solar. The thermal capacity of the concentrators is 1,021 MW, which is an absolute world record. The daily steam generation in the final design is 6,000 tons. This makes it possible to significantly reduce the consumption of natural gas and reduce harmful emissions into the atmosphere [15].
Conventional natural gas include: one operating LNG export terminal with a total export capacity of 10.8 million tons per year; some gas processing plants; 4224 km of natural gas and 106 km of condensate pipelines.
Figure 5. Basic infrastructure facilities of the fossil fuel sector in Oman (click on the map to view a PDF version)
In 2019, Oman had 8.9 GW of electricity generating capacity installed. Oman doesn't have a hydropower energy industry. As previously mentioned, in 2022, approximately 99% of electricity was produced by thermal power plants. The large solar power plant Amin with a total capacity of 105 MW is located near the Nimr area and started its commercial operation in 2020. However, there are plans to build solar plants with a capacity of up to 500 MW. One of them, Ibri 2 solar field, opened in January 2022 in Ad-Dhahirah province [16]. Oman has a large operating wind farm in the Dhofar Governorate comprising 50 MW.
Figure 6. Electricity production and renewable energy in Oman (click on the map to view a PDF version)
The Omani Government has announced the intention to expand its power generation capacities through green energy projects and plans to increase renewable energy capacity by about 4 GW by 2030 as well as to get about 40% of electricity from renewables by 2040. In addition, several gigawatt-scale green hydrogen projects have been announced, including a 14 GW plant powered by 25 GW of wind and solar power [17].
Education and Innovation
The following chart shows Oman's positions in terms of education and innovation:
| Sources: 1. The Global Innovation Index 2021, Rankings / Knowledge / World Intellectual Property Organization / Cornell University, INSEAD, and WIPO (2021): Energizing the World with Innovation. Ithaca, Fontainebleau, and Geneva *132 2. Patent Grants 2011-2020, resident & abroad / Statistical country profiles / World Intellectual Property Organization *185 3.Patents in Force 2020 / Statistical country profiles / World Intellectual Property Organization *109 4. QS World University Rankings 2022 *97 5. SCImago Country Rankings (1996-2020) / Country rankings / SCImago, (n.d.). SIR-SCImago Journal & Country Rank [Portal]. Retrieved 17 Nov 2021 *240 6. Internet users in 2018 / The World Factbook / Central Intelligence Agency *229 7. Internet users in 2018 (% Population) / The World Factbook / Central Intelligence Agency *229 8. Government expenditure on education, total (% of GDP), 2019 / United Nations Educational, Scientific, and Cultural Organization (UNESCO) Institute for Statistics. License: CCBY-4.0 / Data as of September 2021*177 9. Research and development expenditure (% of GDP), 2018 / UNESCO Institute for Statistics. License: CCBY-4.0 / Data *119 10. Scientific and technical journal articles, 2018 / National Science Foundation, Science and Engineering Indicators. License: CCBY-4.0 / Data *197 * Total number of countries participating in ranking Figure 7. The indices of education and innovation in Oman |
Oman has a relatively high share of internet users as a percentage of its population. The absolute number of internet users is slightly lower, but still above the global average. Oman is very well positioned in the SCImago Country Rankings and in terms of the number of publications of specialist scientific and technological journals and patent activities. The country also performs above the world average in terms of government expenditure on education (% of GDP). The country ranks fairly low in government’s expenditure on research and development as well as in QS World University Rankings 2022.
Ecology and Environment Protection
Indicators related to environmental issues are presented in the following diagram:
| Sources: 1. CO2 total emission by countries 2020 / European Commission / Joint Research Centre (JRC) / Emission Database for Global Atmospheric Research (EDGAR)*208 2. CO2 per capita emission 2020/European Commission/Joint Research Centre (JRC) / Emission Database for Global Atmospheric Research (EDGAR) *208 3. Forest area 2020 (% of land area) / The Global Forest Resources Assessment 2020 / Food and Agriculture Organization of the United Nations *234 4. Forest area change 2010-2020 (1000 ha/year) / The Global Forest Resources Assessment 2020 / Food and Agriculture Organization of the United Nations *234 5. The Environmental Performance Index (EPI) 2020 / Rankings / Yale Center for Environmental Law & Policy / Yale University *180 6. Annual freshwater withdrawals (m3 per capita), 2017 *179 Annual freshwater withdrawals, total (billion m3), 2017 – Food and Agriculture Organization, AQUASTAT data. /License: CC BY-4.0; Population – United Nations, Department of Economic and Social Affairs, Population Division (2019). World Population Prospects 2019, custom data acquired via website. Retrieved 15 November 2021 7. The National Footprint Accounts 2017 (Biocapacity Credit / Deficit) / Global Footprint Network *188 8. Methane emissions (kt of CO2 equivalent), 2018 / Data for up to 1990 are sourced from Carbon Dioxide Information Analysis Center, Environmental Sciences Division, Oak Ridge National Laboratory, Tennessee, United States. Data from 1990 are CAIT data: Climate Watch. 2020. GHG Emissions. Washington, DC: World Resources Institute. Available at: License : Attribution-NonCommercial 4.0 International (CC BY-NC 4.0) *191 9. The Climate Change Performance Index (CCPI) 2022 / Overall Results / Jan Burck, Thea Uhlich, Christoph Bals, Niklas Höhne, Leonardo Nascimento / Germanwatch, NewClimate Institute & Climate Action Network *60 * Total number of countries participating in ranking Figure 8. Environmental Indices of the Oman |
Oman belongs to the group of countries with high carbon dioxide and methane emissions. These facts are also responsible for its relatively low ranking in the Environmental Performance Index (EPI). The country is slightly above the world average in two indicators – annual freshwater withdrawals and methane emissions (kt of CO2 equivalent). In general, the environmental situation in the country requires significant improvement.
References
[1] List of sovereign states and dependencies by area / Wikipedia / https://en.wikipedia.org/wiki/List_of_sovereign_states_and_dependencies_by_area
[2] List of countries and dependencies by population density / Wikipedia / https://en.wikipedia.org/wiki/List_of_countries_and_dependencies_by_population_density
[3] Oman / The-world-factbook / Library / Central Intelligence Agency / https://www.cia.gov/
[4] GDP, PPP (constant 2011 international $) / World Bank, International Comparison Program database. License: CC BY-4.0 / Data / The World Bank / http://www.worldbank.org/
[5] GDP per capita, PPP (current international $)/ World Bank, International Comparison Program database. License: CC BY-4.0 / Data / The World Bank / http://www.worldbank.org/
[6] International Energy Statistic / Geography / U.S. Energy Information AdministrationJanuary, 7, 2019 / http://www.eia.gov/
[7] World Shale Resource Assessments / Analysis / U.S. Energy Information Administration (September 24, 2015) / https://www.eia.gov/
[8] Solar resource data obtained from the Global Solar Atlas, owned by the World Bank Group and provided by Solargis / Global Solar Atlas / http://globalsolaratlas.info/
[9] Wind Map / Global Wind Atlas 2.0, a free, web-based application developed, owned and operated by the Technical University of Denmark (DTU) in partnership with the World Bank Group, utilizing data provided by Vortex, with funding provided by the Energy Sector Management Assistance Program (ESMAP). For additional information: https://globalwindatlas.info
[10] Agricultural land (% of land area) / Food and Agriculture Organization, electronic files and web site. License: CC BY-4.0 / Data / The World Bank / http://www.worldbank.org
[11] Forest area (% of land area) /Food and Agriculture Organization, electronic files and web site. License: CC BY-4.0 / Data / The World Bank / http://www.worldbank.org
[12] World Bank What a Waste / Data / The World Bank / http://www.worldbank.org
[13] Biomass: A promising source for renewable energy development in Oman / 6 November 2022 / Observer / https://www.omanobserver.om
[14] BP Statistical Review of World Energy 2020 - 2022 (PDF) / BP / https://www.bp.com/
[15] Miraah/ 330 MW SOLAR THERMAL PROJECT IN THE SULTANATE OF OMAN www.glasspoint.com/projects/miraah
[16] Oman inaugurates 500MW Ibri 2 solar field / www.pv-magazine.com/2022/01/24/oman-inaugurates-500mw-ibri-2-solar-field/
[17] Oman - Country Commercial Guide / Country Commercial Guides / International Trade Administration / www.trade.gov
The sources of charts and curves are specified under the images.
For more information about the energy industry in Oman see here