
Contents
General State of the Economy
Venezuela (Bolivarian Republic of Venezuela), is located in the north of South America between Brazil (in the south), Colombia (in the west) and Guyana (in the east). The northern part of the country faces the Caribbean coast of the Atlantic Ocean.
In terms of its size, Venezuela (34th in the world) is slightly smaller than Colombia and much smaller than Brazil, however its population density is superior to Brazil’s, but less than Colombia [1,2]. According to this index the republic is 188th in the world, with an average density of 35 people per 1 km2 [2]. The total length of the country's coastline is 2 800 km [3].
| Bolivarian Republic of Venezuela | ||
|---|---|---|
| Capital: Caracas | Density: 33.74/km2 | Currency: Bolívar fuerte (VEF) |
| Official languages: Spanish | Life expectancy at birth: 71.10 years | GDP (PPP): $191.329 billion (2022 est.) |
| National Day: 05 July | Area: 916,445 km2 | GDP - per capita (PPP): $7,108 (2022 est.) |
| Population: 30,518,260 (2023 est.) | Coastline: 2,800 km | Internet country code: .ve |
Source: [1,2,3,4,5]
| Sources: 1. GDP (purchasing power parity), 2020 est. / The World Factbook/Library/Central Intelligence Agency *228 2. GDP - per capita (PPP), 2020 / The World Factbook/Library/Central Intelligence Agency *229 3. Inflation rate (consumer prices), 2019 est. / The World Factbook/Library/Central Intelligence Agency *228 4. Charges for the use of intellectual property, receipts (BoP, current US$), 2020 / International Monetary Fund, Balance of Payments Statistics Yearbook, and data files. / License: CC BY-4.0 *88 5. The Global Competitiveness Index 2019 / Rankings / Reports / World Economic Forum *141 6. High-technology exports (current US$) 2019-2020 / United Nations, Comtrade database through the WITS platform / License: CCBY-4.0 / Data *134 7. 2021 Index of Economic Freedom / International Economies / The Heritage Foundation *178 8. Reserves of foreign exchange and gold, 2017 est. / The World Factbook / Library / Central Intelligence Agency *195 9. Annual average GDP growth in %, for the last 10 years (2011-2020) / World Bank national accounts data, and OECD National Accounts data files / License: CC BY-4.0 *206 10. Public debt (% of GDP), 2017 est. / The World Factbook / Library / Central Intelligence Agency(from smallest to largest) *210 * Total number of countries participating in ranking Figure 1. Economic Indices of Venezuela |
Falling oil prices in 2014-2015, had a negative impact on the country's economy, which the economic indices show in the comparative diagram (Fig. 1). However, a number of indicators, such as GDP, foreign exchange reserves and gold, and the market value of publicly traded shares, are higher than the average, or close to it.
Between 2003 and 2012, the country experienced a steady growth of GDP at purchasing power parity and per capita, but then it slowed down [4]. Over the past three years this kind of GDP has dropped from $531.1 billion in 2015 to $381.6 billion in 2017 and to $269 billion in 2018, which still allows Venezuela to occupy 57th place in the world ranking for this indicator [3]. GDP at purchasing power parity per capita is significantly lower (155th in 2018), which has also been demonstrating negative dynamics: $12,500 in 2017 and $7,704 in 2018 [3]. In 2019, inflation in Venezuela reached the critical value of 146,101.7% — 227th (the last) place in the world [3].
According to the Global Competitiveness Index, presented by the World Economic Forum in 2019, Venezuela is 133rd, from an estimated total of 141 countries. This rating reflects the effectiveness of the use of the country’s own resources for sustainable development. In addition to a number of economic indicators this index also takes into account such variables as education, health, level of innovation, etc.
According to the Index of Economic Freedom in 2021, Venezuela was ranked almost at the bottom – 177th, behind Cuba, but ahead of North Korea. This ranking takes into account business freedom, freedom from government action, protection of property, and freedom from corruption.
In terms of gold reserves and foreign exchange reserves in 2017 Venezuela was 75th in the world.
According to the indicator for the average GDP growth in percentage over the last 10 years, in 2020 the country was 122nd out of 206 countries. In terms of public debt, calculated as a percentage of the country's GDP, Venezuela was ranked 135th out of 210 countries considered in 2017.
Energy Resources
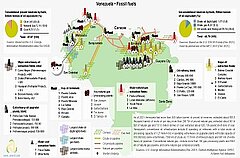
Venezuela has abundant natural resources (Table. 1). There are large deposits of natural gas, including shale gas, and small deposits of coal. But the main resource of the country is oil. In terms of tons of oil equivalent in 2021, proved reserves of conventional hydrocarbons in Venezuela are: oil –88%, natural gas –10.9%, coal –1.1%. The unconventional natural resource matrix looks much different: oil sands and heavy oil 86.8%, shale gas 9.3%, shale oil (tight oil) 3.9% (see Figure 5.).
Table 1. Fossil energy resources of Venezuela
| Resource / Explanations | Crude oil* | Natural gas* | Coal* | Shale Gas** | Tight Oil** | Extra Heavy Oil& Oil Sands |
|---|---|---|---|---|---|---|
| Value | 303.8(17.84%) | 200.4(2.76%) | 806(0.07%) | 167.3 | 13.4 | 278.209 |
| Unit | billion barrels | Tcf | million short tons | Tcf | billion barrels | billion barrels |
| Year | 2021 | 2020 | 2021 | 2013 | 2013 | 2015 |
| Source | [6] | [6] | [6] | [9] | [9] | [8] |
*share of the country’s reserves in world total is provided in brackets
**unproved technically recoverable
Venezuela has the largest oil reserves (considering the heavy oil and bitumen) in the world. There are various quantitative assessments of this resource. According to information presented in [3], as of 2021 the total oil reserves in Venezuela amounted to 303.8 billion barrels. According to the BP Statistical Report 2021 at the end of 2020 total oil reserves were estimated at 303.8 billion barrels [7]. According to the statistical report of PDVSA in 2015 [8], proved oil reserves in 2015 were estimated at 300.878 billion barrels, among them 278.209 billion barrels were heavy oil and extra heavy oil.
Venezuela has significant reserves of oil shale (tight oil) – about 13.4 billion barrels as of 2013, second only to Argentina in the region [9].
Although there are significant natural gas reserves in Venezuela they amount to less than its oil reserves. According to [6], Venezuelan proven gas reserves were 200 Tcf in 2021. According to [7] the level of reserves of natural gas was estimated to 6.3 Tcm in 2020. According to the PDVSA report [8], in 2015 Venezuela had 201.349 Tcf of natural gas.
The volumes of shale gas in Venezuela amount to 167,3 Tcf, and are the third largest in South America following Brazil and Argentina [9]. Several studies have also confirmed the presence of gas hydrates in northern Venezuela [10].
Coal reserves in Venezuela in 2020 were estimated at 731 million tonnes [7]. A selection of basic indicators of this type of resource is presented in Table 2.
The level of solar radiation is low (5.5-6.0 kWh/m²/day) and scattered over most of the country. The highest level of solar radiation — 6 kWh/m²/day can be observed in the northwestern part of the country, Zulia and Falcon states and in the northeast, in Nueva Esparta state [11].
Table 2. Renewable energy resources of Venezuela
| Resource/ Explanations | Solar Potential (GHI)* | Wind Potential (50 м)* | Hydro energy Potential** | Bio Potential (agricultural area) | Bio Potential (forest area) | Municipal Solid Waste |
|---|---|---|---|---|---|---|
| Value | 5.5-6.0 | <4.0 | 731 | 24.4 | 52.4 | 0.88 |
| Unit | kWh/m2/day | m/s | GWh/year | % of land area | % of land area | kg/per capita/day |
| Year | 2018 | 2018 | 2009 | 2020 | 2020 | 2016 |
| Source | [12] | [13] | [13] | [15] | [16] | [17] |
*for most of the territory of the country
**gross theoretical hydro power potential
Distribution of wind resources is as follows: in the central part of the country the average wind speed is typically less than 4.0 m/sec [12]. The maximum registered speed was along the Venezuelan northwestern coastline with the Caribbean Sea and the Atlantic Ocean in the northeast, in the states of Zulia and Falcon, where it may exceed 7.5 m/sec (at a height of 50 m) [12].
Venezuela, like most countries in South America, has a varied terrain, and the Orinoco River basin occupies about four-fifths of its territory. This is a very significant resource for the production of electricity via hydropower. In theory, the hydro power potential of the country is 731 GWh/year, which in comparison with other countries seems little, but for Venezuela it is sufficient, given the size of the country [13]. Moreover, in the north-east of the country there is a certain potential for tidal energy, which can reach between 10-15 kW/m [14].
More than 52.4% of Venezuela is forested with around 24.4% covered by agricultural land [15,16]. This resource has the potential to play a significant role in energy production.
This energy review of Venezuela would not be complete without mentioning municipal waste (0.88 kg per capita per day), which in many countries has become a significant source of energy [17]. However, this trend has not yet been developed to any significant degree in the country.
Energy Balance
Primary energy consumption in Venezuela in 2021 amounted to 2.03 exajoules and was dominated by natural gas – 42.4%, followed by oil – 29%, hydropower – 28.6% [7].
Venezuela is one of the world's largest oil producers and exporters [6]. Oil production has declined over the past ten years (Figure 2), and in 2021 amounted to 614 million barrels/day, according to [6], and to 604,800 barrels/day in 2021, according to [3]. In 2018 the country produced 1.4-1.5 million barrels per day [6,7]. It should be noted, that these figures are significantly lower compared to the peak figures of the 1990s and early 2000s. The decline in production, according to [18], occurred because of a lack of technical knowledge and missed payments to oil service companies.
Oil consumption in this period did not exceed the level of 858 barrels/day and amounted to 471 barrels/day in 2019 [18].
Crude oil exports from Venezuela in 2018 amounted to 1.002 million barrels/day [3].
The U.S. remains to be the main destination of crude oil exports, followed by Asia, the Caribbean nations and Europe [18].
Unlike petroleum, natural gas consumption levels over the last 20 years have fluctuated between 506 billions of cubic feet to 972 billions of cubic feet (Figure 2). According to [6] in 2021, Venezuela produced 563 Bcf of natural gas, and consumed the same amount of 563 Bcf [6]. This is also confirmed by BP data, according to which in 2021 the average volume of natural gas production was 24 Bcm, while consumption was also 24 Bcm [6].
Source: U.S. Energy Information Administration (Sep 2023) / www.eia.gov
Figure 2. The production and consumption of fossil fuels in Venezuela (coal — left, gas — in the center, oil — right)
Coal production has decreased over the past 15 years, and in 2021 was 0.174 million short tons, while consumption was 0.067 million short tons [6].
Historically, Venezuela has a high share of hydropower in electricity production (Fig. 3).
In 2020, Venezuela produced about 103,72 TWh of electricity, of which 69,4% was by hydroelectric plants, 30,5% by thermal power plants on fossil fuels, and 0,1% by other renewable energy sources (Fig.6).
Sources: U.S. Energy Information Administration (Sep 2023) / https://www.eia.gov | ||
| Figure 3. Electricity production in Venezuela |
According to [3] the level of electricity consumption in 2019 was at 78.08 TWh. The share of hydropower in electricity generation dropped by 12% between 2014-2016, and increased again by 6% till 2019 [19].
Venezuela’s position in the comparative diagram of energy index is shown in Figure 4.
The indices based on reserves of oil and export opportunities show Venezuela’s distinct advantage over most of the world. When considering the GDP per unit of energy use, Venezuela is 46th out of 66 countries surveyed. In terms of energy use per capita the country is 53rd out of 66 countries.
| Sources: 1. Crude oil proved reserves, 2021 / International Energy Statistic/Geography / U.S. Energy Information Administration (Nov 2021)*98 2. Natural gas proved reserves 2021 / International Energy Statistic / Geography / U.S. Energy Information Administration (Nov 2021) *99 3. Total recoverable coal reserves 2019 / International Energy Statistic / Geography / U.S. Energy Information Administration (Nov 2021) *81 4. Combination production-consumption for Crude oil 2018 / International Energy Statistic / Geography / U.S. Energy Information Administration (Nov 2021) *219 5. Combination production-consumption for Natural gas 2019 / International Energy Statistic / Geography / U.S. Energy Information Administration (Nov 2021) *123 6. Combination production-consumption for Coal 2019 / International Energy Statistic / Geography / U.S. Energy Information Administration (Nov 2021) *128 7. Electricity – from other renewable sources (% of total installed capacity), 2017 est. / The World Factbook / Library / Central Intelligence Agency *170 8. GDP per unit of energy use (PPP per unit of oil equivalent), 2020 *66 Primary energy consumption - BP Statistical Review of World Energy 2021/BP;GDP (purchasing power parity) - The World Factbook/Library/Central Intelligence Agency 9. Energy use (primary energy use of oil equivalent per capita) 2020 *127 Primary energy consumption – BP Statistical Review of World Energy 2021; Population - United Nations, Department of Economic and Social Affairs, Population Division (2019). World Population Prospects 2019, custom data acquired via website. Retrieved 15 November 2021*66 10. The Global Energy Architecture Performance Index Report (EAPI) 2017 / Rankings / Reports / World Economic Forum 11. Electric power consumption (kWh per capita), 2016 *217 Electricity Consumption - The World Factbook / Library / Central Intelligence Agency; Population - United Nations, Department of Economic and Social Affairs, Population Division (2019). World Population Prospects 2019, custom data acquired via website. Retrieved 15 November 2021 12. Combination of electricity production-consumption (kWh)/The World Factbook/Library/Central Intelligence Agency *216 * Total number of countries participating in ranking Figure 4. Energy indices of Venezuela |
Venezuela also demonstrates extremely negative results for a number of indicators. For example, the country is not included in the list of 170 countries in terms of the share of electricity production from renewable energy sources (excluding hydropower). Despite significant reserves of natural gas, Venezuela has an imbalance between production and consumption of natural gas, which is reflected in the above chart.
Venezuela is ranked 97th in the EAPI of 2017 (Energy Architecture Performance Index), which is based first on the level of economic growth, environmental safety, and energy independence of the country, including access to energy. From 2009 to 2016 the country dropped 32 ranking positions (the source is shown in Fig. 4).
In terms of electricity consumption per capita, the country is 99th in the world, however, for the indicator of combination of electricity production-consumption, Venezuela is 12th in the ranked list of 216 countries.
Energy Infrastructure
A territorial map of the distribution of the largest infrastructure projects of the fossil-fuel sector in Venezuela is shown in Figure 5.
As mentioned above, oil is the main fossil fuel resource of the country. It is worth noting that most of the oil in Venezuela is extra heavy, but the country also possesses significant reserves of conventional crude oil and tight oil. The main oil fields are located in the north-east, in the north-west of the country, and in the area of the delta of the Orinoco River. According to [6], the largest fields of extra heavy oil are Cerro Negro, Zuata, Huyapari, and conventional oil fields are mainly concentrated in the Bolivar Coastal Complex, Barinas-Apure and El Furial. The production volume of Cerro Negro, is 498 million barrels per day (Figure 5). Most of Venezuela's oil fields are mature and require large investments to maintain current production levels [20].
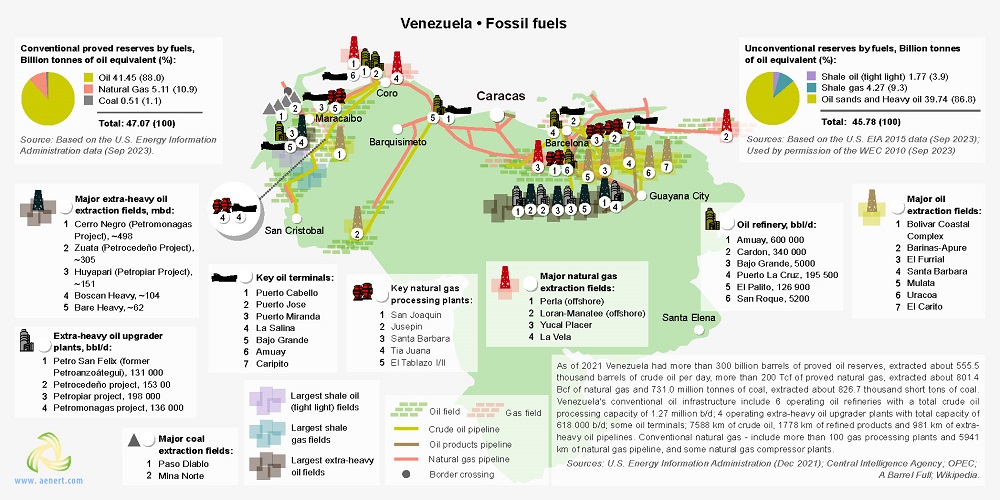
Figure 5. Basic infrastructural facilities of Venezuela: fossil fuels
Many heavy benchmark crudes, produced in Venezuela, have a density of less than 20o API at high viscosity and are classified as extra heavy oil, for example, such well-known brands as Cerro Negro (16o API), Boskan (16o API ), Tia Juana Pesado (12,1o API), Campo Tia Juana (16o API), Zuata (16o API).
Three types of oil pipelines connect the oil fields with the major refineries: pipelines for crude oil with a total length of 7588 km, oil pipelines for the transportation of petroleum products with a length of 1778 km; an extra heavy oil pipeline 981 km long (Figure 5).
Venezuelan refineries process more than 1.3 million barrels of oil per day, and about 630 thousand barrels of heavy oil is subjected to enrichment (upgraders) to produce lighter grades of oil (Figure 5). Major refineries are located in the north of the country. Paraguaná Refinery Complex (PDVSA) is the third largest refinery in the world. Three refineries (Amuay Refinery, Bajo Grande Refinery and Cardón Refinery), included in the complex have an installed capacity of more than 940 000 barrels/day [21]. This complex accounts for over 70% of all Venezuelan refining capacity. The largest plant for the processing of heavy oil is Petromonagas with an installed capacity of 190 000 barrels/day [18,22]. The key oil terminals are Puerto Miranda and La Salina with capacities of 4.26 million barrels and 5.27 million barrels, respectively [23].
The most important gas fields are concentrated in the north-east and north-west of the country, the largest of which is the offshore Perla Gas Field (16 Tcf) [24]. Infrastructure of natural gas processing is concentrated in the vicinity of the fields. San Joaquin, which is the largest processing plant, has an installed capacity of 45 000 barrels per day [25]. The main shale gas and shale oil fields are located in the west of the country near the Maracaibo Basin, on the border with Colombia [9].
Figure 6 shows the most important facilities in Venezuela producing electrical energy.
The share of fossil fuels in electricity production in Venezuela is a 30.5%, with around 69.4% coming from hydro power (Figure 6). In the first case, the power generation is carried out mainly at the expense of oil and gas.
There are about ten combined cycle power plants over 450 MW, five large gas power plants, and three oil power plants, with a capacity of more than 100 MW (Figure 6).
The largest gas power plant in the country is El Sitio, with a capacity of more than 1 GW [26], and the largest oil power plant is Josefa Rufina & Margarita, with the capacity of more than 300 MW [27]. The largest combined cycle power plant is Planta Centro, with a capacity of 2 GW [28].
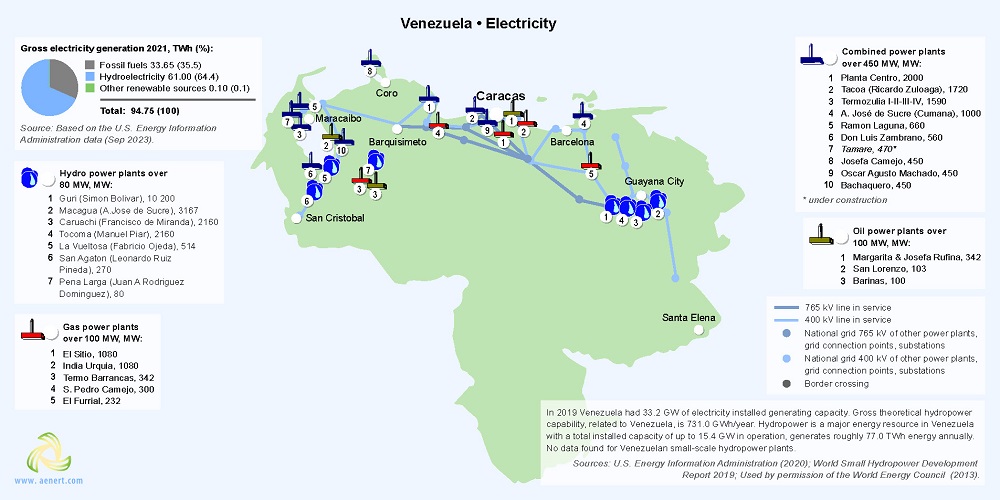
Figure 6. Electricity production in Venezuela
The installed capacity of hydroelectric power plants in Venezuela in 2021 was estimated to be at 16.52 MW, and the country was ranked second in the region behind Brazil; the generation was estimated at 76 004 GWh in 2016-2017 [19,31]. Venezuela’s largest hydroelectric power station, Guri(Simon Bolivar), is among the ten largest hydroelectric power stations in the world, with a capacity of 8850 MW [29].
In Figure 7, you can see the main facilities of the Venezuelan infrastructure for the production of energy from renewable sources.
Figure 7. Basic infrastructural facilities of Venezuela: renewable energy
As noted above, renewable energy in Venezuela, excluding hydro power, has no decisive influence on the production of the main types of energy. Thus, the total production of electricity from renewable sources in 2020, with the exception of hydro power, barely exceeded 0.1%. The level of solar radiation in the most densely populated areas of the country does not exceed 5.5-6.0kWh/m² per day, and wind speed does not exceed 4.0m/s. Nevertheless, there are several renewable energy facilities, particularly solar and wind power plants (see Fig.7).
In the last ten years there has been no subsequent growth of new capacities in the solar energy sector, however, the installed capacity of wind power increased from 30 MWe in 2012 to 50 MWe in 2017 [19].
The National Energy Strategy 2013-2019 (Programa de la Patria, 2013-2019), which was primarily focused on increasing the share of renewable energy in electricity production and the diversification of energy sources. The Development Plan for the National Electric System 2013-2019 (PDSEN, adopted in 2011, implies an increase in renewable energy capacity to 613 MW, 500 MW of which will be generated using wind energy [30]. A wind farm with a capacity of 10 GW will be built in Guajira. Moreover, this program “aims to electrify communities further than 70 km from the grid with renewable energy, ... comprising 65MW of solar PV and hybrid systems” [30]. Currently, Venezuela does not have laws for the implementation of solar, geothermal, wind and hydropower projects, but the urgent need to create a regulatory framework for the development of renewable energy is actively discussed. The new Venezuelan Special Economic Zones Organic Law, adopted in 2022, offers great opportunities for the development of energy projects in the country after the entry into force of the long-discussed Renewable Energy Law [32].
Education and Innovation
To a greater or lesser extent the level of education and innovation in any country affects its energy indices, due to the possibility of mobilising the intellectual resources to address pressing energy problems, or to practically implement advanced energy projects.
The set of indices reflecting the position of Venezuela among other countries in the field of education and innovation can be seen in Figure 8.
For some indicators Venezuela is either not represented in the selected contact ratings or shows extremely low levels. Thus, in the Global Innovation Index of 2021, Venezuela is not represented. According to the number of patents granted to Venezuelan residents, both inside the country and abroad, the country ranks 105th in the world. However there is no data regarding, the number of patents in force.
In terms of government expenditure on education as a percentage of the country's GDP, the country demonstrates a very low result – 175th out of 177 countries selected for consideration. Nevertheless, 5 Venezuelan universities are included in the QS University Rating.
Venezuela is well positioned when considering the number of publications of specialists in scientific and technological journals — 87th place out of 197 countries considered. It is also regarded highly by the Scimago Journal and Country Rank —69th out of 240 countries.
| Sources: 1. The Global Innovation Index 2021, Rankings / Knowledge / World Intellectual Property Organization / Cornell University, INSEAD, and WIPO (2021): Energizing the World with Innovation. Ithaca, Fontainebleau, and Geneva *132 2. Patent Grants 2011-2020, resident & abroad / Statistical country profiles / World Intellectual Property Organization *185 3.Patents in Force 2020 / Statistical country profiles / World Intellectual Property Organization *109 4. QS World University Rankings 2022 *97 5. SCImago Country Rankings (1996-2020) / Country rankings / SCImago, (n.d.). SIR-SCImago Journal & Country Rank [Portal]. Retrieved 17 Nov 2021 *240 6. Internet users in 2018 / The World Factbook / Central Intelligence Agency *229 7. Internet users in 2018 (% Population) / The World Factbook / Central Intelligence Agency *229 8. Government expenditure on education, total (% of GDP), 2019 / United Nations Educational, Scientific, and Cultural Organization (UNESCO) Institute for Statistics. License: CCBY-4.0 / Data as of September 2021*177 9. Research and development expenditure (% of GDP), 2018 / UNESCO Institute for Statistics. License: CCBY-4.0 / Data *119 10. Scientific and technical journal articles, 2018 / National Science Foundation, Science and Engineering Indicators. License: CCBY-4.0 / Data *197 * Total number of countries participating in ranking Figure 8. The indices of education and innovation in Venezuela |
Venezuela is among the 50 leading countries of the world for the number of Internet users.
Among the country’s leading universities that train specialists in the field of energy is Universidad Central de Venezuela, which offers training programs in various engineering specialties including Mining Engineering, Petroleum Engineering, Electrical Engineering, etc.
Universidad Central de Venezuela, Instituto Venezolano de Investigationes Cientificas (IVIC), Universidad de los Andes are actively involved in the research n the field if synthetic fuels. Intevep SA is among the leaders of patenting among Venezuelan companies in the field of extraction and processing of unconventional oil. Studies in this field have been conducted by Petroleos de Venezuela S.A. (PDVSA) and Universidad de los Andes.
Research on coal seam methane is carried out by Universidad Central de Venezuela, Petroleos de Venezuela S.A. (PDVSA).
Insistuto Venezolano de Investigaciones Cientificas (IVIC) and Intevep SA have the largest number of research papers, in the field of non-traditional oil production, including directional drilling and hydro-cracking.
In the field of gas hydrates, the leaders in the number of publications are Petroleos de Venezuela S.A. (PDVSA) and Universidad Central de Venezuela.
The leader in research and development in the field of bioenergy is Insituto Venezolano de Investigationes Cientificas (IVIC).
A large number of Venezuelan companies patent their inventions in the field of CSP, the leading one is Intevep SA. Among universities conducting research in this field one should mention Universidad Nacinal Experimental Politecnica de la Fuerza Armada Nacional and Universidad Central de Venezuela. In the field of wind energy — Universidad Simon Bolivar.
Ecology and Environment Protection
Figure 9 shows the indices that have an indirect effect on the energy sector, but in many respects predetermine its future. First of all, the country demonstrates relatively high level of CO2 emissions in general, and per capita.
There is a negative trend in forest area change, which has decreased by 0.27% in the period between 2010-2020. However, according to the forest area as % of land area, Venezuela is among the world leaders.
Venezuela also belongs to a group of countries with very high levels of methane emissions. The overall negative picture is confirmed by the Ecological Footprint Atlas rating, according to which Venezuela is among the ecological debtors. The situation brightens, however, by a relatively high valuation of Venezuela in the Environmental Performance Index rankings 2020 (EPI), which focuses primarily on assessing the environmental performance of national governments — here the country is 59th out of 180 countries.
| Sources: 1. CO2 total emission by countries 2020 / European Commission / Joint Research Centre (JRC) / Emission Database for Global Atmospheric Research (EDGAR)*208 2. CO2 per capita emission 2020/European Commission/Joint Research Centre (JRC) / Emission Database for Global Atmospheric Research (EDGAR) *208 3. Forest area 2020 (% of land area) / The Global Forest Resources Assessment 2020 / Food and Agriculture Organization of the United Nations *234 4. Forest area change 2010-2020 (1000 ha/year) / The Global Forest Resources Assessment 2020 / Food and Agriculture Organization of the United Nations *234 5. The Environmental Performance Index (EPI) 2020 / Rankings / Yale Center for Environmental Law & Policy / Yale University *180 6. Annual freshwater withdrawals (m3 per capita), 2017 *179 Annual freshwater withdrawals, total (billion m3), 2017 – Food and Agriculture Organization, AQUASTAT data. /License: CC BY-4.0; Population – United Nations, Department of Economic and Social Affairs, Population Division (2019). World Population Prospects 2019, custom data acquired via website. Retrieved 15 November 2021 7. The National Footprint Accounts 2017 (Biocapacity Credit / Deficit) / Global Footprint Network *188 8. Methane emissions (kt of CO2 equivalent), 2018 / Data for up to 1990 are sourced from Carbon Dioxide Information Analysis Center, Environmental Sciences Division, Oak Ridge National Laboratory, Tennessee, United States. Data from 1990 are CAIT data: Climate Watch. 2020. GHG Emissions. Washington, DC: World Resources Institute. Available at: License : Attribution-NonCommercial 4.0 International (CC BY-NC 4.0) *191 9. The Climate Change Performance Index (CCPI) 2022 / Overall Results / Jan Burck, Thea Uhlich, Christoph Bals, Niklas Höhne, Leonardo Nascimento / Germanwatch, NewClimate Institute & Climate Action Network *60 * Total number of countries participating in ranking Figure 9. Environmental Indices of Venezuela |
According to The Environmental Vulnerability Index, which is based on years of observations and 50 indicators and includes for example, changing climatic characteristics or the quality of water resources, waste volumes, oil spills and other hazardous substances, etc. Venezuela is 100th, and is characterized as "vulnerable", as well as, for example, New Zealand.
References
[1] List of sovereign states and dependencies by area / Wikipedia / https://en.wikipedia.org/wiki/List_of_sovereign_states_and_dependencies_by_area
[2] List of countries and dependencies by population density / Wikipedia / https://en.wikipedia.org/wiki/List_of_countries_and_dependencies_by_population_density
[3] Venezuela / The world factbook / Library / Central Intelligence Agency / https://www.cia.gov/
[4] GDP, PPP (constant 2011 international $) / World Bank, International Comparison Program database. License: CC BY-4.0 / Data / The World Bank / http://www.worldbank.org/
[5] GDP per capita, PPP (current international $)/ World Bank, International Comparison Program database. License: CC BY-4.0 / Data / The World Bank / http://www.worldbank.org/
[6] Venezuela / Geography / U.S. Energy Information Administration / http://www.eia.gov/
[7] BP Statistical Review of World Energy 2019 - 2022 (PDF) / BP / https://www.bp.com/
[8] Principales Actividades (PDF) / 2015 / PDVSA / http://www.pdvsa.com
[9] World Shale Resource Assessments (PDF)/ U.S. Energy Information Administration (11/28/2018 )/ https://www.eia.gov/
[10] Database of Worldwide Gas Hydrates / U.S. Geological Survey Gas Hydrates Project / https://www.usgs.gov
[11] Solar resource data obtained from the Global Solar Atlas, owned by the World Bank Group and provided by Solargis / Global Solar Atlas / http://globalsolaratlas.info/
[12] Wind Map / Global Wind Atlas 2.0, a free, web-based application developed, owned and operated by the Technical University of Denmark (DTU) in partnership with the World Bank Group, utilizing data provided by Vortex, with funding provided by the Energy Sector Management Assistance Program (ESMAP). For additional information: https://globalwindatlas.info
[13] 2013 Survey of Energy Resources (PDF) / World Energy Council / www.worldenergy.org/
[14] Wave power / Wikipedia / https://en.wikipedia.org/wiki/Wave_power
[15] Agricultural land (% of land area) / Food and Agriculture Organization, electronic files and web site. License: CC BY-4.0 / Data / The World Bank / http://www.worldbank.org
[16] Forest area (% of land area) /Food and Agriculture Organization, electronic files and web site. License: CC BY-4.0 / Data / The World Bank / http://www.worldbank.org/
[17] What a Waste (PDF) / Data / The World Bank / http://www.worldbank.org
[18] International Energy Statistic / Geography / U.S. Energy Information Administration (Jan 2019) /http://www.eia.gov/beta/international/
[19] Venezuela / IRENA / http://resourceirena.irena.org/
[20] Venezuela / A Barell Full / http://abarrelfull.wikidot.com/venezuela-oil-and-gas-news
[21] Paraguaná Refinery Complex / Wikipedia / https://en.wikipedia.org/wiki/Paraguan%C3%A1_Refinery_Complex
[22] List of oil refineries / Wikipedia / en.wikipedia.org/wiki/List_of_oil_refineries
[23] Oil marine terminals in western Venezuela are underutilized: PDVSA report / Mery Mogollon / S&P Global Platts / http://www.platts.com/
[24] Perla Field / Offshore Technology / http://www.offshore-technology.com/
[25] PDVSA 5.0 Industry Status / Fischer-Tropsch Archive / http://www.fischer-tropsch.org/
[26] Inspeccionaron el Complejo Generador Termocentro Planta «El Sitio»: generará más de 1.080 MW / Caracas 30 de agosto / Noticias24 / http://www.noticias24.com/
[27] Barcazas Josefa Rufina y Margarita Barge Gas Power Plant / Industry About / www.industryabout.com/
[28] Planta Centro Thermal Power Plant Venezuela / Global Energy Observatory / http://globalenergyobservatory.org/
[29] List of largest hydroelectric power stations Wikipedia / https://en.wikipedia.org/wiki/List_of_largest_hydroelectric_power_stations
[30] Venezuela (PDF) / 2015 / IRENA / http://www.irena.org/
[31] Tracking the latest hydropower developments in Latin America / 01 Feb 2021 / NS Energy / https://www.nsenergybusiness.com/
[32] Renewable energy projects under the new Venezuelan Special Economic Zones Organic Law / 30 September 2022 / International Bar Association / https://www.ibanet.org
The sources of charts and curves are specified under the images.
For more information about the energy industry in Venesuela see here