Table of content
Basic definitions
Solar energy is fundamental to life on our planet, from regulating temperature and climate and generating weather patterns, to providing the energy for photosynthesis. Solar energy is a form of thermal electromagnetic radiation produced by thermonuclear reactions in the sun that we receive as sunlight and heat. The main quantitative unit of solar energy is solar irradiance (SI), a unit of SI being determined by the power of solar electromagnetic radiation per unit area in a unit of time.
Solar energy has been utilized by humans for heating, drying, cooking, etc. all over the world since ancient times. However it is only in recent decades that energy conversion into other useful forms and, in particular, to electricity has been achieved at a large-scale industrial level. This could happen due to practical effective exploitation of currently known basic laws of Physics – refraction and reflection of light, photo effect, theory of semi-conductors, as well as due to upgraded supporting technological processes – manufacturing of high-purity glass, processing of silica materials, production of reliable inverters and many others. Eventually, several industrial areas of technology concerning solar power conversion into heat and electrical power were developed.
Among these technologies, photovoltaics is the most widespread. Photovoltaic technology is based on the direct conversion of solar energy to electricity in solar PV photovoltaic cells via the photovoltaic effect. One of the pioneering inventions in this field was made by American inventor Russell Shoemaker Ohl in 1946 (R. S. OHL, US 2402662 A) and was called a light-sensitive electric device. This was followed a few years later, in 1954, the famous American “Bell Laboratories” made the first photo galvanic cell, and in 1958 the first space satellite Vanguard 1 was launched, equipped with solar cells as its electric sources.
Another promising direction of solar energy conversion is CSP or Concentrating Solar Power for effective heating of a special heat transfer liquid (typically oil or brine solutions) and its sequential heat-exchange with water until water steam is formed, i.e. at the first stage solar energy is converted to thermal energy of steam. Further, the conventional process of electricity generation is used – superheated steam rotates a steam turbine connected to an electricity generator and thus conversion of mechanical to electric power occurs. There are also options to convert solar energy directly to mechanical power (the Stirling Engine) and, further, via power generators, to electricity. Sometimes technologies of concentrating solar energy are applied only for production of heated steam, which is used afterwards in other technological processes, for instance, for heating heavy oil in underground reservoirs to decrease its viscosity.
In addition to generating electricity, solar energy is widely used to heat water using solar collectors. It is worth noting that although these technologies are used mainly in individual households, the global capacity of solar water heating collectors is approaching 500 GWth.
In recent years there has also been a growing interest amongst researchers in the development of solar radiation conversion into different fuels, for example, using electrolysis or photolysis; nevertheless these technologies are still in the experimental research phase.
A simplified diagram of principal solar energy conversion technology options is given in Fig.1. Each of them has additional major characteristics – the availability or absence of solar tracking systems and solar energy concentration systems. While for CSP converters this separation is by definition irrelevant, for PV and SWH technologies, on the contrary, it is crucial because it significantly changes their basic performance parameters – equipment, efficiency, capital and operating costs, etc.
Fig. 1. Solar energy conversion options

The application of solar energy collection, as with other solar tracking systems with the exception of CSP, is gradually expanding into PV and SWH technologies. Solar energy collection is mainly achieved utilizing specially designed mirrors that focus the sun’s rays onto a solar receiver of a limited surface area. The solar tracker provides parallel motion of solar receivers (PV panels, solar reflectors, and collectors) following the sun’s movement from dawn-till-dusk, thus ensuring the maximum possible reception of solar radiation. In one of the options solar trackers can rotate only on one axis, in another they ensure tracking on two axes. These systems are relatively expensive, vulnerable, and difficult to control, and their implementation imposes supplementary challenges to solar plants particularly with regard to solar receiver supports, actuating mechanisms, monitoring and control systems. Despite the apparent simplicity of solar inverters (even those with a joint configuration of concentrating systems and solar trackers) and the availability of a free source of energy in solar radiation, their cost-effective application for electricity generation is subject to in-depth research and advanced engineering solutions. The industry faces tough competition with conventional, fossil fuel-based technologies of electricity generation and has so far has proved inferior to them in a range of parameters.
For more comprehensive information about this section refer to the sources [1 -7].
Solar Resources
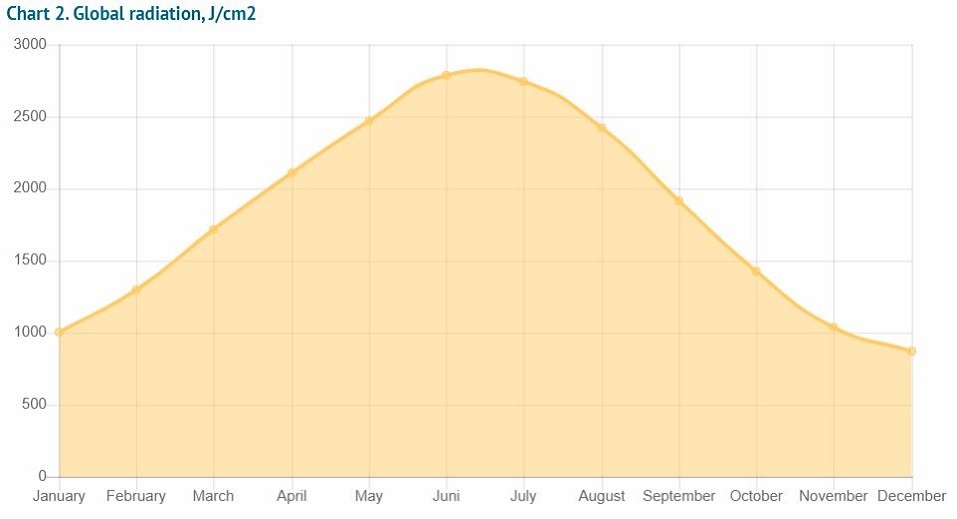
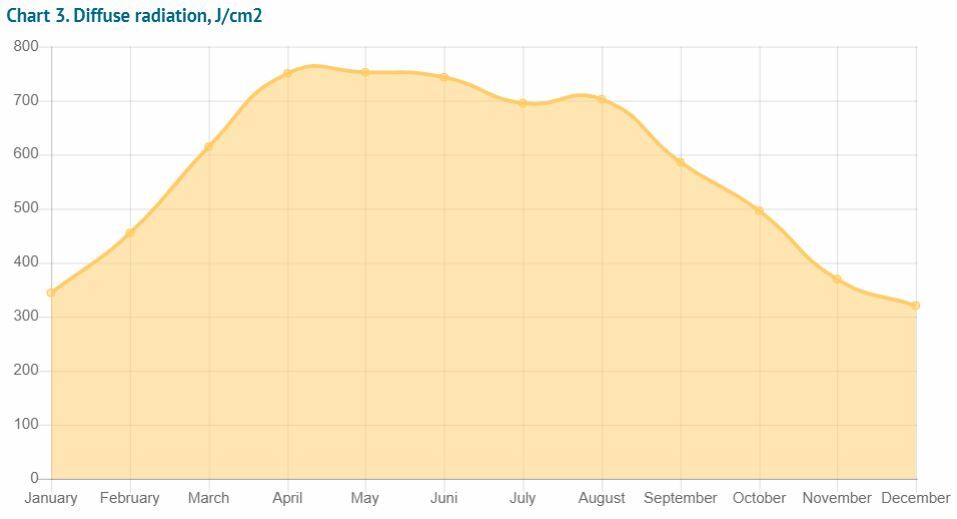
The amount of solar energy received on different segments of the earth’s surface depends on many factors and has an extremely uneven distribution. Here, the determining factors include the distance from a certain location of the earth’s surface to the sun, the solar azimuth angle, the degree of sunlight dispersion in the atmosphere. Direct Normal Irradiance - DNI corresponds to solar energy, acquired at a point perpendicular to the sun and under absence of diffuse sunlight. Diffuse Horizontal Irradiance – DHI considers only diffuse solar energy on a horizontal surface. The sum of both kinds of solar irradiance is called Global Horizontal Irradiance - GHI. The importance of such recording has a specific practical application. For instance, concentrating solar energy is possible only for direct normal irradiance, while photogalvanic cells are capable of generating electrical current from any kind of solar irradiance. Accordingly, application of photogalvanic technologies is possible in latitudes with fewer bright, cloudless sunny days, which in many ways predetermine their greater prevalence. Currently, there exist several methods of measuring solar radiation at each location of the earth’s surface ranging from standard metrology methods to advanced space technologies. If you click on the links [8-16] you can find various sources that provide data on the level of solar irradiance at different locations of the earth’s surface, historic data and all the necessary definitions. The level of solar irradiance changes significantly even within a small country. For example, average DNI value in the North of Sweden is less than 2.5 KWh/m2/d, but in the South is can exceed 3.0. In the North of Spain average DNI value is around 6 KWh/m2/d, but in the South, it can reach up to 8 KWh/m2/d. In countries with higher insulation – Australia, Chile, USA, Saudi Arabia and others, the DNI value can exceed 8.0 KWh/m2/d. In addition to that, the operation of solar power plants depends a lot on local hours of sunny daylight, particularly in conditions of full sunlight. Nevertheless, in reality the areas with the greatest potential of solar energy are not always convenient for deployment of solar plants (too far from energy users, do not have a developed auxiliary infrastructure, difficult terrain, land use restrictions, etc.). If, for private residential and commercial entities, deployment of solar installations is determined mainly by building configurations and their solar pointing, for industrial solar plants (usually utilities with capacities of over 1 MW ) this is an issue of the highest priority. That is why selection of optimal land plots is a matter of difficult compromises. In some solar resource databases, for example in [17], the territory of every country analysed is ranged by plots differing in the degree of received solar radiation. In this, a specific country usually features a wide range of various levels of solar radiation in different regions, especially if the country occupies a vast territory.
The map in Figure 2 shows examples of the distribution of solar activity on the earth's surface at various geographic points. The interactive map of the solar activity database contains the monthly mean of daily duration totals of sunshine, global radiation and diffuse radiation for more than 1500 locations in all regions of the world, as well as averaged data for sky cover for the observation period between 2004 and 2014 for more than 11,000 relevant meteorological observations locations. The map was created based on the data from the World Radiation Data Center (WRDC) and Global-Historical-Climatology-Network (GHCN) of National Oceanic and Atmospheric Administration U.S.
To retrieve information, select the source name in the legend - WRDC or GHCN and click one of the active locations on the map. Depending on your initial choice, you will receive either sunshine duration, global radiation, diffuse radiation or sky cover diagrams, with a different colour highlighting the respective sky cover state fractions - clear, scattered from 1/8 to 4/8, broken from 5/8 to 7 / 8, overcast, obscured, partial obscuration.
By selecting the following layers in the legend: GHCN SKC, you can see the average values of sky cover with the corresponding colour scheme for specific geographic areas, in a cross section, measuring: latitude = 1, longitude = 0.5 (degrees), and calculated based on the data of meteorological stations located inside this cross section of the map.
Fig. 2. Interactive map of solar resources
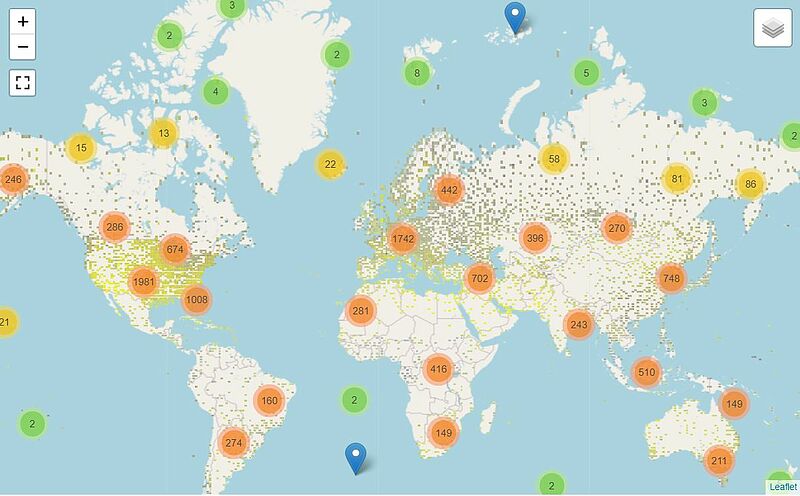
Source: Based on the data of the World Radiation Data Center (WRDC) and the National Oceanic and Atmospheric Administration U.S.
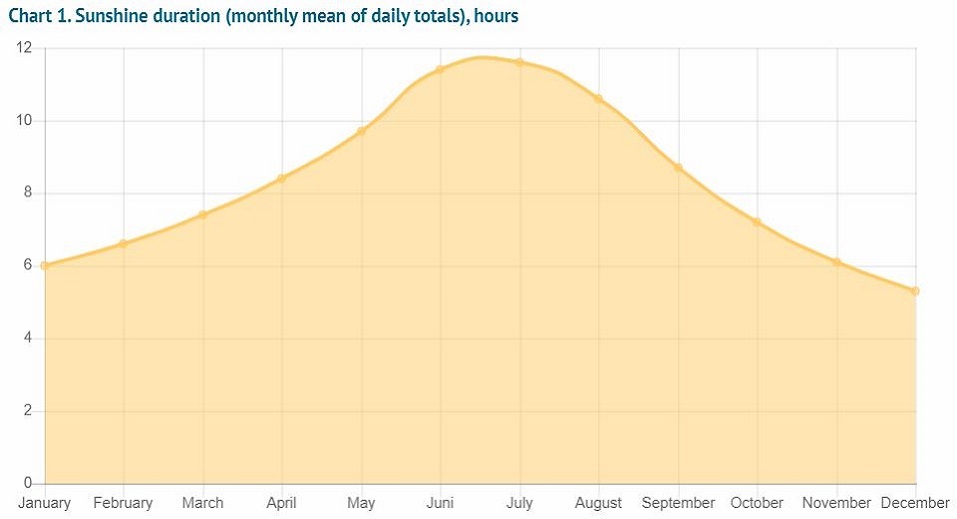
Fig. 2.1. Average monthly distribution of Sunshine duration and Solar radiation throughout the year, Malaga, Spain
Fug.2.2. Sky cover, Malaga, Spain

Countries with high levels of Direct Normal Irradiance are most suitable for the development of solar concentrating technologies. Photovoltaic technologies are applicable practically across all countries, even in those with low DNI, but in every case it is the level of solar irradiance that will primarily determine the basic parameters of solar power plants’ performance.
Mainstream technologies
The direct conversion of solar energy into electricity using photovoltaic technology has become widespread. The principle of solar cell operation is shown in Figure 3. Photovoltaic generation of electricity is based on the photoelectric effect, i.e. the emission of electrons when exposed to the sunlight. The highest efficiency of the process has been achieved using various semi-conductors, starting with silicon (Table 1).
Fig. 3. PV solar cell operation
1. Solar panels; 2. Inverter; 3. Electric box; 4. Home power; 5. Battery; 6. Utility grid; 7. Glass cover; 8. Anti-refl ective coating; 9. Front contact grid (negative electrode); 10. n-type semiconductor (silicon with phosphorus); 11. p-n junction; 12. p-type semiconductor (silicon with boron); 13. Back contact (positive electrode); 14. Electrical circuit
A typical solar cell consists of two doped Si wafers in contact, each having boundary layers alloyed with specially tailored chemical elements. One of these is alloyed with phosphorus (n-type semiconductor), another one with boron (p-type semiconductor). The choice of elements is based on the fact that phosphorus, in contrast to silicon, has 5 electrons in its outer shell, as opposed to silicone’s 4. The alloyed layer of silicon therefore has free electrons, which build a negative charge and produce an n-type semiconductor. When silicon is alloyed with boron the reverse situation occurs. As there are only three electrons in the outer shell of boron atoms, cavities appear - so-called ‘holes’, in the crystalline lattice of the boron-alloyed silicon layer - producing a positive charge and hence a p-type semiconductor.
Upon connecting two Silicon wafers, alloyed with Phosphorus and Boron respectively, there occurs mutual diffusion of excess electrons and holes to adjacent wafers through a p-n junction, which recombine with each other and form a sustainable structure. Alongside this an excess negative charge is built up in the boundary Silicon layer alloyed with Boron, and in the boundary Silicon layer alloyed with Phosphorus a positive charge is conversely created. When light falls on the Silicon n-type wafer a portion of photons are reflected or absorbed in the crystalline lattice, but their energy is dissipated into heat; furthermore, another portion of photons, by overcoming the energy of the crystalline lattice resistance, release electrons that can move inside the wafer. Upon connecting two alloyed silicon wafers using a circuitous metal low-resistance electrode it starts providing a motion of free-formed electrons, i.e. there is derived electric current, as far as transition of electrons through the junction between two wafers will be influenced by the electric field at the p-n junction. Along with that, the holes that form in place of electrons removed from the crystal lattice can freely diffuse through the p-n junction as they are electrically neutral. Displaced electrons from the n-type semiconductor enter the p-type semiconductor through a junction electrode, where they recombine with the holes. If the light continues to fall on the p-type Silicon wafer, the electric current in the circuit between the wafers will be maintained by new portions of newly-formed free electrons being exposed to the impact of photons; if the optical source disappears the electric current also stops flowing.
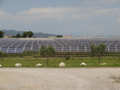
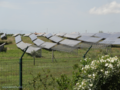
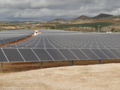
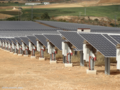
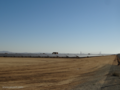
Fig. 4-5. Different types of PV cells: stationary and dual-axis tracker driven


Moreover, it is mandatory for the design of solar cells to include a grid of contact electrodes, contacting the wafers, a glass cover and anti-reflective coating, and an inverter providing conversion of constant current in the electric circuit between the wafers into alternating current, being used in the utility grid. Also, sunlight concentrators and solar tracking systems are sometimes applied.
Functional efficiency of solar panels depends primarily on solar intensity, the properties of the semiconductor materials used, and the design of solar cells. Table 1 displays the results for the most effective solar panels made from different materials and for different designs.
Table 1. Efficiency of sunlight conversion using different technologies
| № | Technologies | Sub-Technology | Researcher | Year | Efficiency, % |
|---|---|---|---|---|---|
| 1 | Multijunction Cells (2-Terminal, Monolithic) | Four-Junction or more (Concentrator) | Fraunhofer, ISE/Soitec | 2015 | 46 |
| 2 | Multijunction Cells | Three-Junction (Concentrator) | Sharp (IMM,302x) | 2013 | 44,4 |
| 3 | Multijunction Cells | Four-junction or more (Non-Concentrator) | Boeing-Spectrolab (5-J) | 2013 | 38,8 |
| 4 | Multijunction Cells | Three-Junction (Non-Concentrator) | Sharp (IMM) | 2013 | 37,9 |
| 5 | Multijunction Cells | Two-Junction (Concentrator) | NREL (38.1x) | 2017 | 35,5 |
| 6 | Multijunction Cells | Two-Junction (Non-Concentrator) | LG Electronics | 2017 | 32,8 |
| 7 | Single-Junction GaAs | Concentrator | LG Electronics | 2016 | 29,3 |
| 8 | Single-Junction GaAs | Thin-Film Cristal | Alta Device | 2012 | 28,8 |
| 9 | Single-Junction GaAs | Single Cristal | LG Electronics | 2017 | 27,8 |
| 10 | Cristoline Si Cells | Single Cristal (Concentrator) | Amonix (92x) | 2005 | 27,6 |
| 11 | Cristoline Si Cells | Silicon Heterostructures (HIT) | Kaneka | 2016 | 26,6 |
| 12 | Cristoline Si Cells | Single Cristal (Non-Concentrator) | Fraunhofer-ISE | 2017 | 25,8 |
| 13 | Thin-Film Technologies | CIGS (Concentrator) | NREL (14.7x) | 2014 | 23,3 |
| 14 | Emerging PV | Perovskite Cells (Not Stabilized) | KRICT | 2017 | 22,7 |
| 15 | Thin-Film Technologies | CIGS | ZSW | 2016 | 22,6 |
| 16 | Cristoline Si Cells | Multicristalline | Fraunhofer-ISE | 2017 | 22,3 |
| 17 | Thin-Film Technologies | CdTe | First Solar | 2015 | 22,1 |
| 18 | Cristoline Si Cells | Thin-Film Crystal | Solexel | 2014 | 21,2 |
| 19 | Thin-Film Technologies | Amorphous Si:H (Stabilized) | AIST | 2016 | 14 |
| 20 | Emerging PV | Quantum Dot Cells | NREL | 2017 | 13,4 |
| 21 | Emerging PV | Inorganic Cells (CZTSSe) | IBM | 2013 | 12,6 |
| 22 | Emerging PV | Dye-Sensitized Cells | Sharp | 2012 | 11,9 |
| 23 | Emerging PV | Organic Cells (Various) | UST | 2015 | 11,5 |
| 24 | Emerging PV | Organic Tandem Cells | UCLA-Sumitomo Chem. | 2012 | 10,6 |
Source: www.nrel.gov/pv/assets/images/efficiency-chart.png
As you can see from Table 1, single-junction PV cells convert sunlight into electric energy with an efficiency of just over 20%. The application of solar concentrators allows that ratio to be increased to 30%, nevertheless further improvement of efficiency is possible only with use of multijunction PV cells of semiconductor systems, again coupled with solar concentrators. Multijunction PV cells consist of an array of photovoltaic cells of different semiconductor materials connected together and assembled in descending order of their band gap or energy gap, i.e., the energy being necessary for transition of valence electrons in the solid body into conduction electrons.
Higher efficiency of such cells is provided by extra use of a portion of photons whizzed through the first outer layer of a semiconductor with photoelectrons being formed in the following layer. Along with silicon as a semiconductor material other inorganic semiconductor materials are used, for instance, alloys of cadmium and tellurium (CdTe), chalcopyrite compound, copper indium gallium diselenide – CIGS. Various structural states of semiconductors – crystalline, multicrystalline, amorphous, and microcrystalline (Table 1) were also tested. At present multijunction PV cells are under research and are not used for commercial applications, but LCPV and HCPV systems already have multiple examples of commercial applications [18]. In addition to the above, such applications are equipped with solar tracking systems, often coupled with cooling systems. However, single-junction PV cells have found much greater usage both in large-scale applications and household facilities owing to their simplicity and reliability. Such solar cells are mainly manufactured from monocrystalline or polycrystalline silicon. Large-scale manufacturing of thin-film solar cells is also gathering pace owing to their additional advantages – lower cost, higher manufacturing efficiency, flexibility and less weight. A disadvantage of this technology is that it offers lower efficiency of solar energy conversion.
Another important parameter of any solar technology is concentration of solar energy with the help of special devices – concentrators. In some cases specially-designed lenses are used, but most often parabolic mirror concentrators and similar mirror systems are used.
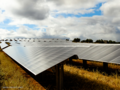
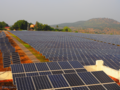
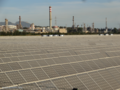
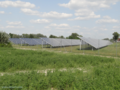
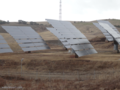
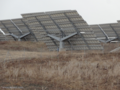
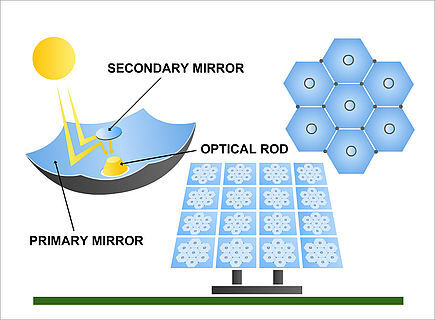
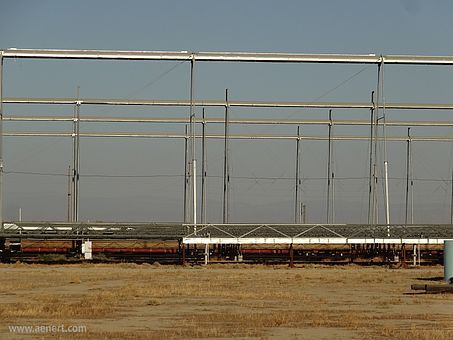
Also, flat mirror systems (heliostats) are often used. These concentrate sunlight onto a small area. For CSP technologies concentration is a key feature. Recently there has been research carried out concerning different options of solar energy concentration with regard to increasing PV efficiency, demonstrating real results. These technologies are called concentrating photovoltaics (CPV). Low concentration units usually feature concentration rates below 100 (LCPV); high ones (HCPV) can reach 1000 (Fig. 4–5) [18-19]. Commercial options for concentrating facility applications are also available for solar water heaters (SWH) [20].
Fig. 6 - 7. HCPVs and LCPVs for PV technologies

It should noted that the application of concentrators in photovoltaic systems requires the cooling of photovoltaic cells as the resulting high temperatures dramatically reduce the efficiency of their performance, or can even disable them. So far, existing commercial applications have rarely used cooling, but HCPV systems with multijunction cells invariably require water cooling, which adds an additional layer of complication to the technology.
Another common method of converting solar energy into electricity is by using concentrating solar power (CSP) technologies. In this case, unlike photovoltaics, solar energy is first converted into heat and only then into electricity.
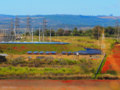
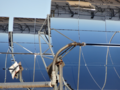
Fig. 8 – 9. Concentrating solar power facilities with use of parabolic mirrors


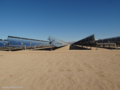
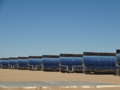
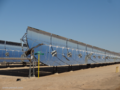
There are several options for concentrating solar power for further conversion into heat exist, three of which have been commercialized. Over 80% of all CSP plants are based on parabolic trough technology [1,21], consisting of an array of parabolic mirrors – reflectors that concentrate sunlight at the focus of a paraboloid - in which a solar receiver is installed. A solar receiver is a tube of high-quality clear glass featuring another tube inside. This inner tube is made of metal and circulates liquid, typically a specialist oil (Fig. 8-9). Such a design ensures high heat insulation. The liquid inside the metal tube is normally heated up to 400oС. The surface temperature of the outer glass tube is much lower and can be touched by hand without causing burns. Using mechanical pumps, the heated specialist liquid inside is transported to a steam generator where the heated oil in the heat-exchanger transfers its energy to the steam generator’s circulating water producing superheated steam. Solar tracking is driven by rotating the array of parabolic mirrors about the mounting axis. From this point electricity is generated in a conventional manner: the steam is fed into a steam turbine and rotates it simultaneously with the rotor of an electric generator. As previously referenced, concentrating solar power has been utilized in other related industries beyond those of electricity production. Notably, the Glass Point Solar company successfully operates CSP plants for steam generation to recover high-viscosity oil in Oman and construction of a giant 850 MW solar-powered steam generation plant has also been planned in California. In both cases the company uses parabolic collectors as solar concentrators [22-23].
Ibersol Ciudad Real (Puertollano) CSP Plant, Parabolic Trough technology, 50.0 MW, Puertollano, Castilla-La Mancha, Spain
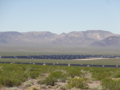
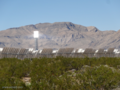
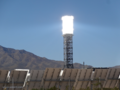
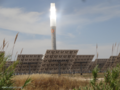
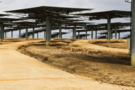
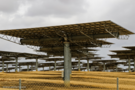
Solar Power Tower or Central Receivers is also a promising technology in the field of concentrating solar energy, currently maintaining an approximately 13% share of the global CSP market [21] (Fig. 10-11). This technology is based on the utilization of flat mirror reflectors (heliostats) installed on trackers, which provide dual-axis solar tracking, coupled with a solar tower equipped with a collector at the top in the focal point of heliostats – a central receiver of concentrated solar light. As with the parabolic concentrator, the working liquid is heated in the receiver which in turn heats water and generates superheated steam in the heat-exchanger.
Fig. 10 - 11. Concentrating solar power facility using a field of heliostats and a central receiver


From this stage on standard electricity generation techniques are employed: a steam turbine and an electricity generator. The constructive specifics of this technology allow the working liquid to be heated to higher temperatures – over 500oС, and, with the use of molten salts, offer promising prospects for improving the efficiency in plants of this design.
Gemasolar CSP Plant, Tower technology, 19.9 MW, Fuentes de Andalucía, Sevilla, Spain
Commercialization of the specially-designed high-temperature receiver, CentRec (the particle receiver CentRec), which has been developed by The Institute for Solar Research – DLR, Germany, can turn into a unique achievement. The main innovation of this design is a rotating chamber filled with ceramic particles below 1 mm in diameter, and receiving concentrated solar radiation from a solar mirror field through the opening. During rotation of the chamber heated ceramic particles adhere to its inner surface and provide even heat distribution. This construction allows downstream temperatures of up to 775oС to be reached, but inside the chamber – up to 900oС. Bauxites are used as a ceramic material; they are accessible, safe for people and the environment, and are more cost-effective compared to molten salts. Additionally, such a design avoids some other pitfalls compared to molten salts – heat losses are reduced with the help of additional metal components, the heating problem of pipes and tanks with molten salts during a plant stoppage and subsequent hardening of the salts is eliminated. This technology can provide a water steam heating temperature up to 620oС compared to maximum temperature 565oС for molten salts. In addition to electricity generation using the Solar Tower CSP system with such a chamber, the acquired heat can be used for metal-casting works. At present this technology is being tested [97,98].
Both technologies, the parabolic trough and the solar tower, have principal differences, advantages and disadvantages. The bottleneck of the tower technology is a single receiver. Should its normal operation be interrupted it can lead to the stoppage of either the entire plant or else a significant part of it, if it only has one tower. The parabolic system features the option of being able to stop the parabolic concentrators by section without stoppage of the entire plant. Heliostat defocusing can cause a serious failure, as has been the case at the solar plant Ivanpach [24]. Flat mirrors of heliostats have large areas that are sensitive to wind and require the installation of more expensive dual-axis trackers. However, parabolic mirrors of reflectors themselves are complex structures both in manufacturing and in operation. A major advantage of the tower technology is it provides the opportunity to employ more effective working liquids, for example, brine solutions, which can be heated to high temperatures. In the case of parabolic concentrator technology, application of such heat-transfer liquids is still at the pilot stage.
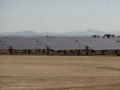
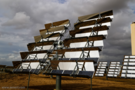
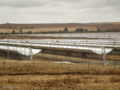
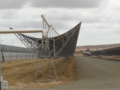
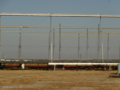
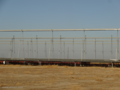
One more industrial CSP option is the technology of Linear Fresnel Reflectors, which are essentially rows of flat mirror strips positioned at an increasing angle, and thus appearing like a sectional paraboloid.
Fig. 12 -13. Concentrating solar power facilities with Fresnel Reflectors

The main benefit of such a concentrator is its significantly lower cost when compared with parabolic designs. Furthermore, operation of Fresnel concentrators is cheaper however their efficiency is considerably below the efficiency of parabolic concentrators.
A conceptually different option of concentrating solar power was adopted in a design that combines a parabolic dish concentrator and a Stirling engine, located in the focal point of the paraboloid mirror and connected to a generator. This option inherits all the deficiencies inherent to Stirling engines, yet possesses the highest efficiency of solar energy conversion into electric power compared to other options previously mentioned, which exceeds 30% [25-27]. By packaging these standalone concentrators together, it makes it possible to design a scalable solar power plant [28].
Fig. 14. Dish concentrator with Stirling engine

Concentrators with Stirling engines have a number of significant advantages compared to other CSP technologies:
- such a design helps to achieve the highest efficiency of conversion of sunlight - 34%;
- it is possible to implement a modular concept;
- water cooling is not required.
Laboratories all over the world are conducting intensive research into this technology, but it has not yet reached the stage of commercialization. All solar energy conversion technology has one major deficiency: a fluctuating pattern of operation, defined by the duration of sunshine (for photovoltaics and water heating technologies), as well as the availability of direct normal irradiance (for all concentrating solar power technologies). The solution to this issue is being principally developed on two fronts: hybrid systems and application of energy storage technologies. Hybrid systems integrate solar power stations with other solutions, which combined provide the ability to generate power, regardless of the natural environment. Such integrated solar and gas turbine plants or diesel facilities - for instance, the project of Sonatrach 150 MW ISCC Hassi R'mel power station in Algeria - consist of a CCGT plant and a 20 MW parabolic trough thermal power plant [21]. Opponents of this solution, with some justification, remark that the use of fossil fuels in a hybrid system distorts the very essence of renewable energy. There have also been a number of different solutions implemented based solely on renewable technologies. For example, in 2016, in Nevada, USA, the company Enel Green Power opened the Stillwater hybrid station as part of their geothermal (33 MW), photovoltaic (26 MW), and solar thermal (2 MW) plants. Combining these technologies in a single plant enabled overall output to be increased by 3.6% compared to a single geothermal plant [21]. In Denmark the Aalborg CSP hybrid power station project was implemented, which included CSP with a capacity of 16,6 MW and a biomass conversion facility for the combined production of heat and electricity. What is surprising about this project is that it was implemented in latitudes with a low level of solar radiation, especially for concentrating technologies [29]. A more large-scale solution is network optimization, whereby fluctuating electric power generation from solar power plants is supported by excess capacities of hydro accumulating stations. Still, such an option is only possible if the appropriate costly infrastructure is available.
Energy storage technologies constitute one of the most important domains of the modern energy industry. This is particularly true in the context of the most promising renewable energy technologies – solar and wind. In spite of an abundance of suggested solutions the choice ultimately comes down to whether to use accumulator batteries or to manufacture a different energy product with extended storage capacity. Regarding the former there are high expectations placed on lithium ion accumulators as they are being intensively developed for use in electric vehicles, which will inevitably reduce their cost. Regarding the latter, promise was seen at intermediate stages of production and hydrogen storage, but further development requires breakthrough solutions, starting with the electrolysis or other similar technologies, capable of maintaining its effective production. However, neither in the first nor the second case have any industrial levels been reached so far. Additionally, it should be noted that some countries (Germany, Sweden, etc.) have programs supporting the Residential Energy Storage Scheme (together with solar photovoltaic systems) which include financial incentives towards covering the costs of part of the battery, control unit, etc. [30] that hope to stimulate consumer demand both for photovoltaic systems and storage batteries. However, concentrating solar power technologies allow for the highly efficient storage of energy on account of the intermediate stage of heat production, often consumed for heating additional heat-transfer liquid stored in special thermal insulated storages (tanks) and utilized for the production of superheated steam as required when direct sunlight is not available. This gives CSP an advantage over PV technologies, partly compensating for their main disadvantage – the inability to function in the absence of direct sunlight. The general concept of a CSP plant with a thermal energy storage facility is given in Figure 15.
Fig. 15. Layout of a solar power plant with an energy storage facility
1. Heliostat field, 2. Central receiver, 3. Salt tank (hot 565oC), 4. Condenser, 5. Salt tank (cold 290oC), 6. Steam generator, 7. Turbine, 8. Generator, 9. Transformer, 10. Grid, 11. Cooling tower
The storage system consists of two tanks, one for the heat-transfer liquid being heated to maximum temperatures and another for the liquid from the steam generator with reduced temperature. In the period of solar activity the first tank is filled with heated working liquid, but after sunset it is used for steam generation and pumped to the second tank. Molten salts, potassium and sodium nitrates are most commonly used as heat-transfer liquids; some other compounds have also been tested - ZnCl2,MgCl2, Na2CO3 and others [31]. The substances applied should have high heat capacity, low corrosiveness, low fusion temperature, and low cost. More detailed information about different kinds of energy storage for solar power plants and the corresponding materials used will be discussed later [21,31 -33].
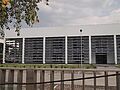
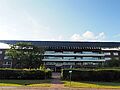
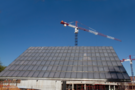
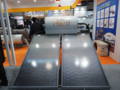
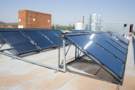
Currently solar water heating or cooling technologies have become widespread, being significantly simpler than electric power generation technologies. Water heating occurs in thermal collectors, which are flat-plate heat insulated airtight panels filled with a heat carrier which has special tubes (metal, polymer, etc.) inside designed for the circulation of heated water, air or other heat carriers. There are a great number of thermal collectors which can be studied in detail in corporate manufacturing brochures. You can get background information about this technology, trace recent trends and learn about different development programmes from numerous sources [34-40]. It should be noted that the most effective are evacuated tube collectors with solar energy concentrators and solar tracking systems. These enable water to reach high heating temperatures, significantly exceeding its boiling temperature (250 -3000С).
Fig. 16 – 17. Designs of water heating solar collectors
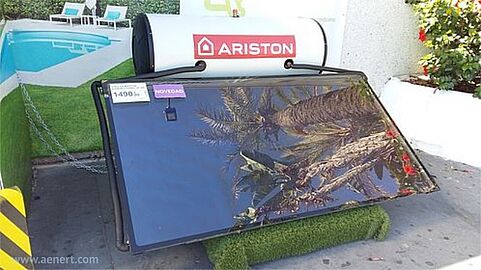
These systems look like CSP structures. Paraboloid reflectors are used in most cases. Such complex structures are predominantly used in countries with a moderate climate, as the targeted purpose of solar collectors in southern countries, water heating for household needs, is ensured adequately with the help of cheaper and simpler devices.
Advantages and disadvantages
Technologies of solar energy conversion into other useful forms have their advantages and disadvantages, which has been briefly mentioned above. One of the most important performance indicators for energy technologies is their capacity factor, determined as a ratio of actual electrical energy over a given period of time to the maximum possible electrical energy output over that period.
One of the main disadvantages of solar power technologies is the low capacity factor, which in the first instance relates to daily rotation accompanied with alternation of day and night, whereupon operation of a solar power plant within the common framework cannot be continuous without supplementary facilities. Currently, the difference of capacity factor values between traditional technologies based on fossil fuels and main renewable energy technologies – wind and solar – remains significant. At this rate, according to statistical data [41], the annual average capacity factor for energy sectors in USA in 2013-2016 was: for nuclear power – over 89.9 – 92.3%; for coal-fired plants - 53.3 - 61.1%; for municipal waste-fired plants – 68.7 - 69.7%; for conventional hydropower plants – 35.8 -38.9%; for geothermal plants – 73.6 -74,3%. For wind energy this value was within 32.2 – 34.5% (maximum 43.2% - in April), for Solar PV - 25.1 – 25.9% (maximum in June and July - 31.7%), for solar thermal plants – 19.8 – 22.2% (maximum in July – 36.9%). Also, it should be noted that the capacity factor when fossil fuels such as coal and gas are used, as well in the case of hydropower, can reach significantly higher values and commensurate to those for nuclear power [42], but for wind and solar power these values are considerably lower (without energy storage systems).
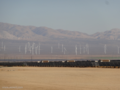
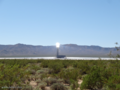
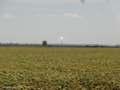
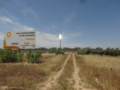
Fig. 18 – 19. CSP plant stops due to high clouds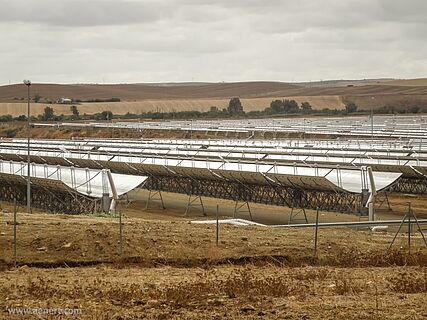

Thus, the capacity factor is one of the most crucial indicators when comparing solar energy to fossil-fuel driven electricity generation and hydropower plants. The most advanced solutions for increasing the solar power capacity factor are associated with the use of energy storage systems, but this solution is only promising for CSP technologies. According to [43], 6-hour energy storage systems at parabolic trough power stations can increase their capacity factor to 45-53%, whereas 12-15-hour energy storage systems at heliostat power plants to 65-80%. This solution can potentially represent a breakthrough which can create real competition to fossil fuels in electric power production.
As for PV, given the issues discussed above, the potential to increase the capacity factor appears more complicated and depends to a great extent on the parallel development of electrical energy storage technologies.
Table 2. Annual average (maximum) capacity factors of the main energy technologies in existing industrial practices
| Annual average capacity factors, % | Maximum capacity factors, % | |
|---|---|---|
| Nuclear power | 91.5 | 92.3 |
| Coal fired electricity | 57.2 | 95 - 98 |
| Gas fired electricity | 52 | 80 - 83 |
| Hydro power | 35.7 | 80 |
| Wind energy | 33.3 | 43.2 |
| Solar PV | 25.6 | 31.7 |
| CSP | 21.4 | 65 - 80 (with thermal storage) |
Sources: [41,42,43]
Another important comparative indicator for evaluating the advantages and disadvantages of solar technologies is the efficiency of solar energy conversion to electric energy. For CSP and Solar PV, efficiency is determined by fundamentally different factors because these technologies are based on different physical laws. The ultimate efficiency of a single-junction PV cell was determined by Shockley and Queisser and is 33.16%. Real efficiency depends on the type of applied semi-conductors, structural features of PV cells, and of course on the intensity of sunlight in a certain location, etc. For polycrystalline silicon PV cells efficiency is usually 14-22% (43-46), thin-film technologies have the efficiency of 4-17%, non-silica systems have efficiency of around 5%. As mentioned previously, further optimization of efficiency can reach up to 46% owing to the application of concentrators and multijunction PV cells made from semiconductor systems.
Efficiency of CSP technologies, except for natural factors, is determined primarily by characteristics of solar concentrators and receivers, and to a great degree also by the design features of a solar plant and applied materials – accuracy of solar tracking systems, properties of heat carriers, heat losses, power capacity and reliability of steam generators and turbines, and other components. The effective organization of plant operation is clearly an important factor. The most effective solar energy conversion technologies in this sector are Stirling Energy Systems. For a long time, since 1984 the highest achievement was 29.4%, but the project of Sandia National Laboratories and Stirling Energy Systems (SES) hit the threshold in 2008 and the top efficiency level was increased up to 31.25%. Later on several even more reassuring messages appeared, but one of them specified that Swedish technologists reached 34% efficiency of solar power plant with Stirling engines [25-27]. However, in this case we are talking about experimental results. In real practice the efficiency of this technology is somewhat lower - 20-25% [28]. Here, the systematic efficiency evaluations for other CSP technologies are given, which include: parabolic trough – 15-16%, Central Receivers – 12-20%, Linear Fresnel Reflectors – 8-10%.
Table 3. Some important indicators of solar power efficiency
| Indicators | Solar power efficiency, % |
|---|---|
| Ultimate efficiency of a single-junction PV cell | 33.16 |
| Maximum current efficiency of multi-junction cells with concentrators | 46 |
| Maximum current efficiency of concentrators with Stirling engine | 34 |
| Solar PV efficiency in existing industrial practice | 14 - 22 |
| CSP efficiency in existing industrial practice | 8 - 20 |
Sources: [25-28, 43-46]
Production output costs, which are mainly determined by CAPEX and OPEX costs, appear to be one more fundamental comparative performance indicator of the solar power industry. The pattern of capital cost breakdown to produce one kilowatt of electricity from different energy sources is given, for instance, in [46]. According to this work, natural gas combustion turbines (single shaft) feature the least capital costs, estimated as 994 - 1,004 $/kW. Capital costs for conventional hydropower power plants are 1,297 - 4,905 $/kW. When compared to this data, onshore wind and solar PV (even with tracking) power plants look quite competitive - 1,234 - 2,037 and 1,263 - 1,593 (2019, $/kW). According to [47], recent capital costs in the USA (1st quarter of 2017) amounted to $1,300/kW for fixed-tilt utility-scale PV units and $3,200/kW for private residential PV systems. At the same time the difference between fixed axis and one-axis tracker systems is only marginal.
However, most popular CSP technologies (parabolic trough and central receiver) integrated with energy storage systems require significantly greater initial investments – over 7,000 $/kW, which is commensurate with specific capital costs for construction of nuclear and geothermal plants and is approximately twice as expensive as for the construction of hydropower plants. Meanwhile energy system costs amount to about 6 - 11% of total costs [28], and initial investments of up to 40% are necessary for systems of mirror reflectors. CSP operating costs are significantly higher and the proportion of capital investment on a year-on-year basis reaches 84% [28]. These are very considerable constraints to develop such kind of technologies.
Table 4. Overnight cost for deployment of major types of power plants
| Types of power plants technology | Total overnight cost (2019 $/kW) | Сhanges overnight cost (2019 $/kW) |
|---|---|---|
| Advanced nuclear | 6,317 | 5,963 - 7,688 |
| Combined-cycle—single shaft | 1,079 | 994 - 1,004 |
| Conventional hydropower | 2,752 | 1,297 - 4,905 |
| Wind | 1,319 | 1,234 - 2,037 |
| Biomass | 4,104 | 3,808 - 6,614 |
| Solar photovoltaic —tracking | 1,331 | 1,263 - 1,593 |
| Solar thermal | 7,191 | 6,936 - 8,61 |
Source: [46]
One of the most important indicators is the cost of generated electricity. As a result, this indicator, which accumulates all the interim costs and the cost of equipment production, amount of capital costs, efficiency of energy conversion, etc., demonstrates the level of commercial competitiveness of a certain technology. Upgrade of equipment, control systems and growth in the number of solar power plants contribute markedly to the final price of supplied energy for consumers [28, 43, 48 -50]. For example, [48] states that for every doubling of PV module sales their price is reduced by 22%. Forecasting price changes of solar technologies is the subject of numerous studies. For example, [18] presented forecasts of levelized cost reduction by 2020 for PV technologies from approximately 0.055 Euro2013/kWh, for CPV from 0.06, and for CSP from 0.11 Euro2013/kWh. These figures are not particularly impressive; however, more encouraging results have appeared. Thus, according to [51 - 53], in 2017 the prices of CSP with energy storage systems were decreasing much faster, from less than $0.1/kWh to less than $0,05/kWh over a period of six months; but starting from 2006, when the price was equal to $0.31/kWh, it was reduced to $0.094/kWh or by almost 70% by 2017. The prices of Solar PV were reducing commensurately. Thus, in the second part of 2017 solar energy in the USA reached the target price of solar energy equal to $0,06/kWh, originally forecasted to be reached by the year 2020. Moreover, the target value of 2030 also looks quite realistic - $0.03/kWh, which might be reached in the coming years [54]. Thus, by its price characteristics solar energy has become not just competitive compared to fossil-fuel driven technologies, but also stands at the forefront of price trends.
In 2017 prices of electric energy from Solar PV plants reached a sustainable value of $0.06 /kWh tending to decrease to $0.03 /kWh in the coming years.
In 2017 prices of electric energy from CSP with energy storage systems dropped to $0.094/kWh comparing to $0.31/kWh in 2006.
These prices are competitive with prices of traditional technologies.
In not relying on fossil fuels, solar energy is considered environmentally friendly, but there are several factors that interfere in seeing this concept in absolute terms. For CSP technologies high levels of water consumption appear to be a serious technical problem, which can turn into environmental one for a range of regions, and is also commensurate to conventional technologies. This level is 2835 – 3780 L/MWh, whereas the upper value refers to Linear Fresnel Reflectors, and the lower one to solar power towers [21, 28, 55]. Application of dry cooling is also considered as an alternative, however, operating costs for electric power production increase considerably and total efficiency decreases approximately by 7% [28].
Environmental organizations have expressed concerns regarding solar power tower technologies due to birds dying in large numbers having flown into a high-temperature area of sun ray concentration. One recent article on this issue referred to around 6,000 birds killed within a year at the Ivanpach facility, the Mojave Desert, Nevada, USA [56]. Naturally, given that the data is correct, this becomes a serious challenge, requiring an effective solution. Another complaint that appeared in 2013 after the start-up of that large facility is regarding aircraft pilots being blinded by light coming from the high temperatures in the tower receivers when passing in the area [24]. It is apparent that this issue can be solved with technical and institutional arrangements, but its foregrounding might become a serious obstacle on the way to the granting of construction permits for solar tower plants in the vicinity of airports and other sensitive relevant sites.
Solar PV technologies are also subject to some issues of environmental concern. Most commonly these include the issues of sustainable waste recycling in the manufacturing of semiconductor photocells and used PV cells. Also, higher life cycle GHG emissions of silicon solar cells have been reported, cadmium toxicity raises concerns etc., than those of other technology designs [48].
Taken together, the existing issues of environmental concern connected to solar energy conversion technologies are not critical and can be solved by means of integrated organizational and technical measures.
Solar energy statistics
The share of renewable energy in the total electricity generation is steadily increasing, including due to solar technologies. For example, in 2016, all photovoltaic plants produced 314.5 TWh of electricity (1.25% of world production), and in 2018 - about 550 TWh (2%). At the same time, the share of electricity generation through solar energy among all renewable sources in 2019 reached 43% [57,58].
Fig. 20. Share of solar energy technologies in the total volume of renewable electric power, 2019, %
Source: [58]
Moreover, the introduction of new PV capacities in recent years has increased total capacity by around 25- 30% annually, greatly exceeding similar values for wind power. The total capacity of the photovoltaic industry by late 2019 is about 630 GW [40, 58] and 6.3 GW for CSP. Furthermore, it should be noted that nearly 480 GWth of worldwide solar heating capacity has been installed. The leaders of installed capacities and solar PV electricity generation are China, Japan, Germany, the USA and India, whereas each of these countries generated over 30 TWh in 2019, and in China just over 178 TWh [58].
Fig. 21. Top 10 countries global installed solar PV power capacity , 2019, MW
Source: [58]
When viewing the PV proportion of the energy balance in each country the general background turns out to be significantly different, and the top 10 solar PV countries of those mentioned above include only Italy, as an absolute leader, Germany, and Japan. Given that the calculated worldwide mean proportion is roughly equal to 2%, this value in Italy exceeds 8%, which is a unique result.
In 2017 considerable progress in the field of renewable energy was achieved in Europe – here for the first time the total production of electric power using wind, biomass and solar PV exceeded the total production from coal-fired power stations [59]. Whereas, the PV proportion increased from 3.4% in the previous year to 3.7%. According to reports from the same source another historic event occurred on the first day of 2018 in Germany - 95% of total power were generated using renewable sources, wind and solar energy to begin with. Clearly this cannot happen every day, but in any case it is a perfect demonstration of the opportunities that exist. In 2018 electricity from grid connected renewable energy plants in Germany is expected to move to first place having left behind coal-fired electricity generation.
But in spite of the results achieved, European authorities express their concern about the decline in investments into renewable energy. According to reports from Deutsche Welle regarding Bloomberg New Energy Finance, the total investment in Europe decreased in 2017 to $57.4 bln, while the leader – China – celebrated its rise to a giant value of $132.6 bln. Referring to [60] the total installed PV capacities in China were 25.3%, but by 2021 under an optimistic scenario it might exceed 160 GW. Annual investments into renewable energy have also stabilized in the USA, being $56.9 bn in 2017. The country’s share of installed PV capacities in the global total was 13.8% in 2016 [60].
Fig. 22. Top 10 countries with the largest share of PV power generation in the total electricity generation (with a total generation volume of at least 10 TWh per year), 2018, %
Source: [57, 58]
Evaluation of solar tracker system applications for solar PV plants is an issue, and in recognition of this an evaluation based on manufacturer and operator surveys was performed by PV magazine [95]. According to the results, by the middle of 2016 14.7 GW of capacities in the world were using tracker systems, most commonly in the USA (10 GW). Another 1.5 GW are under construction and about 3 GW are under contract negotiation. Thus, basic calculations demonstrate that approximately 6% of PV facilities are equipped with solar tracker systems. The reasons for the prevalence of solar PV many times over that of other CSP technologies have already been mentioned, but we should re-emphasize that in many cases this can be attributed to their inherent requirements regarding sunlight conditions. PV cells are efficient under DNI conditions, while CSP and CPV can only function under DNI conditions, while their satisfactory performance only starts from 5-6 KWh/m2/day. In this regard almost all European countries, Russia, Canada, Brazil, countries of South-Eastern Asia and other regions are practically excluded from considering the deployment of concentrating technologies. PV facilities are frequently operated at just 2.5 - 3 KWh/m2/day. Another important advantage of Solar PV over concentrating solar radiation, and thus contributing to its high prevalence, is a fundamental difference in the principles of how PV functions. PV cells produce electricity individually and do not require additional generating mechanisms, while CSP is a process consisting of several stages, including the concentrator system, reflectors, steam generators, steam turbine, and power generator. Indeed, this makes the operation of a CSP plant much more difficult and, more importantly, increases their initial capital investments. CSP, however, has its own advantages: good prospects of efficiency gains and an opportunity of thermal energy storage, which can increase the capacity factor up to 50-60% (and potentially to even 80%) compared to approximately 20% for solar PV plants. That is why, in spite of the prevalence of solar PV, CSP has its own patterns of growth, though lower than was forecasted some years ago. Growth in total CSP capacities worldwide is shown in Figure 23.
Fig. 23. Growth in Solar thermal capacities worldwide, MW
Source: [21]
Two countries in the world, Spain and the USA, are absolute leaders, though over the past few years capacity additions have been with other countries, first of all with India, the United Arab Emirates, and South Africa. Solar thermal plants with energy storage systems are of considerable interest; their share in the world according to the database [21] is over 40%. Such types of power plants are commonly found in Spain. Most of the plants in operation have storage capacity of 6-9 hours and are of the parabolic trough type. The largest is Xina Solar One, put into operation in 2017, located in South Africa, and featuring a turbine capacity of net 100 MW, with a dry cooling, and storage capacity for 5.5 hours [21]. Solar towers feature greater thermal energy storage capacities. Among the plants currently in service the Gemasolar Thermosolar Plant in the South of Spain is one of the first commercial plants of this type, which has a 15-hour installed capacity of thermal storage and provides perfect opportunities of uninterrupted operation. The plant, Golmud, in China is currently under construction and will have a total turbine capacity of 200 MW with similar storage characteristics, and is going to become the largest in the world in this class. In the vast majority of cases energy storage systems use molten salts as a heat-transfer fluid in [21].
Fig. 24 - 25. Solar energy with concentrators. Distribution by types of concentrators and the proportion of plants with energy storage systems, %.
Source: [21]
Fig. 26 - 27. Distribution of solar thermal plants by types of concentrators in Spain and the USA, %
Source: [21]
Globally, three types of CSP plants are operated on an industrial scale. The most popular are parabolic trough plants with a share of approximately 80%. Solar tower plants make up more than 18% of the market. The rest are plants with linear Fresnel reflectors. In Spain around 97% of plants are parabolic trough plants, other types are met only in 3% of cases. The most common size for these plants is 50 MW. The largest solar tower plants – the previously mentioned Gemasolar Thermosolar Plant and Planta Solar 20 have 20 MW capacity. A large solar plant with Linear Fresnel Reflectors - the 30 MW Puerto Errado 2 Thermosolar is also operated in Spain.
In the second large CSP technology market – the USA – parabolic trough plants also prevail. But the share of solar towers is much higher and is around 28% [21]. The largest solar tower plant in the world in service is the Ivanpah Solar Power Facility, with a net capacity of 377 MW, as well as some largest parabolic trough plants - Mojave Solar Project, Solana Generating Station and Genesis Solar Energy Project each with a net capacity of 250 MW, and 30 MW are designed for internal consumption at the plant. The USA also has several low-power pilot scale plants with linear Fresnel reflectors and Stirling engines. According to [61] the three most active US states – Nevada, Arizona and California reported total installed capacities of 1,777 MW in 2015, but the proportion of CSP in total solar power generation reached 8% (utility-scale solar photovoltaic (PV) made up 53%, and distributed solar PV made up 38%).
Over the past few years CSP deployment in other countries has been developing at high rates. In India total capacity of functioning plants at the end of 2017 exceeded 225 MW, including the largest plant in the world, a Fresnel plant – 125 MW Dhursar. Capacities of 300 MW have been developed in South Africa, and 100 more are at construction stage. High R&D activity in the field of CSP technologies is observed in Morocco, Israel, China, Chile, Arab Emirates and some other countries.
Water heating collectors also have a significant place in the solar energy market.
Fig. 28. Global distribution of installed solar collector capacities, 2019
Source: [40]
In 2016 this amount reached 456 GWth [39,40]. Over the past 10 years the total capacities of solar water heating have almost tripled. In spite of the fact that in recent years growth rates of new capacities have slowed down to 6-7%, compared to 2011-2012 when they made 15-17%, development of this technology still looks impressive. The absolute leader here is China, with a market share exceeding 70%. Lagging far behind follow the USA, Turkey, Germany and others. The prevailing technology in this field are evacuated tube collectors which make up 75% of the market share.
The share of flat plate collectors is approximately 21% [39]. Solar water heating are most commonly used in private households; nevertheless, in certain countries they are intensively applied for solar district heating, the leader here is Denmark which has deployed several plants of this type with the largest having a capacity of 110 MW.
Comprehensive statistical data on solar energy can be found in publications and websites [21,40,57,58,60,62].
Solar power plants
The rapid development of solar energy is constantly changing statistical data, including the lists of plants in service and under construction. In the case of PV power stations accounting is especially difficult due to their large number and widespread distribution, not to mention standalone photovoltaic systems. Comprehensive information on the solar PV industry by country is available, for instance, in [63-69], and on the web-site Advanced Energy Technology.
Fig. 29 shows a map of the largest solar power plants by types for Denmark, not possessing abundant solar energy resources, but Table 5 gives the sample top 10 Solar PV stations in the world at the end of 2019, as reported in Wikipedia.
Fig. 29. The largest solar power plants in Denmark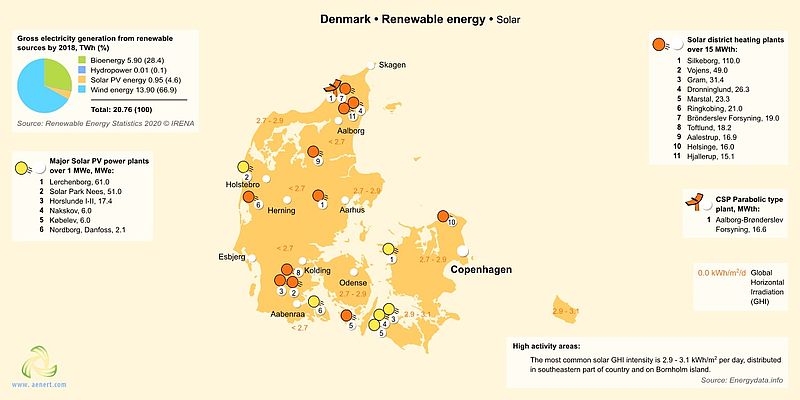
In recent years the technological barrier of 1000 MW capacity for solar plants has been overcome which places them within the range of the largest fossil-fuel fired power plants. Thus, for instance, only several power plants in the world have a capacity exceeding 10,000 MW (the largest is Three Gorges Dam with 22,500 MW in China), but most of the top 20 largest power plants are in the range of 5,500-6,500 MW, including the largest fuel oil and natural gas plants [70]. China and India have become the leaders in PV power station capacities, having sidestepped American producers.
Table 5. Top 10 world's largest photovoltaic power stations
| Name | Capacity, MW | Location | Year |
|---|---|---|---|
| Bhadla Solar Park | 2 245 | India | 2020 |
| Huanghe Hydropower Golmud Solar Park | 2 200 | China | 2020 |
| Pavagada Solar Park | 2 050 | India | 2019 |
| Benban Solar Park | 1 650 | Egypt | 2019 |
| Tengger Desert Solar Park | 1 547 | China | 2016 |
| Noor Abu Dhabi | 1 177 | United States | 2019 |
| Mohammed bin Rashid Al Maktoum Solar Park | 1 013 | United Arab Emirates | 2020 |
| Kurnool Ultra Mega Solar Park | 1 000 | India | 2017 |
| Datong Solar Power Top Runner Base | 1 000 | China | 2016 |
| NP Kunta | 900 | India | 2020 |
Source: List of photovoltaic_power_stations / Wikipedia
In recent years there has been growing interest amongst producers for hybrid systems with different configurations, including photovoltaics. The hybrid plant project by the company Enel Green Power - Stillwater, which integrates geothermal, PV and CSP power stations has already been mentioned; another project with a total capacity over 1 GW, implemented by the American companies eSolar and General Electric, and MetCap Energy Investments, in Karaman, Turkey, and approved by the Turkish government, in addition to a natural gas station, includes a 22 MW wind farm and a 5 MW solar tower station [96].
Most reports refer, however, to the integration of PV power and hydropower. Of these the best known is a Chinese project, Longyangxia Dam Solar Park, where a solar PV plant is integrated with a local hydropower plant [71]. Integration of the plants ensured grid stability and an increase in economic efficiency for both facilities.
Another similar project was implemented in 2017 in Portugal - floating solar panels at Alto Rabagão dam [72,73]. PV panels, capable of generating over 300 МWh electric power annually are coupled with hydro-turbines. PV panels ensure production of electric power in the daytime, but the hydropower facility is used additionally during peak loads and after nightfall. This allows a significant increase in general economic efficiency for the hybrid facility.
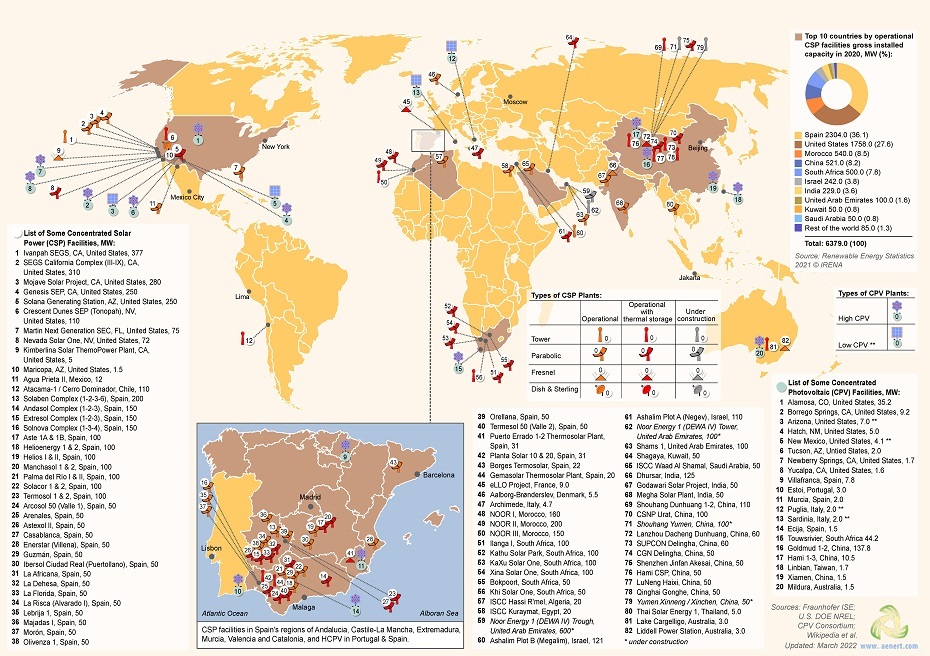
A comprehensive list of global CSP power stations is given in the detailed database in [21], and in [74]. The list of CPV projects is available in [18, 75].
The largest plants of this type are marked on the map (Fig. 30). In spite of the fact that most concentrating plants are located in Spain and the USA, these technologies are also developing dynamically in other countries – China, India, the SAR, and Morocco. China and the SAR also have the largest high-concentration CPV stations – Coldmud and Touwsrivier with a capacity of 78,9 and 44,2 MW, respectively.
Fig. 30. Major CSP plants in the world
Major companies
Over the course of 20 years of solar energy commercialization, some fundamental changes have occurred in the markets of PV product manufacturing and consumption. Despite the existence of epicenters of this process, it is nowadays possible to say unequivocally that this market has become global. On one hand this is due to exponential and practically ubiquitous growing consumption, and on the other to the fact that most major manufacturers, irrespective of their national origin, actively expand their productive capacities to other countries depending on commercial viability.
When considering the most active players in this market, the strengthening positioning of Chinese companies should first be mentioned. According to some accounts over the past 10 years their share in the market has grown from 7-8% to almost 60%. Taiwanese companies took another 20% in 2015 while American, Japanese and Western German manufacturers have lost ground [76]. For example, according to [77] the total US imports of PV modules in 2016 grew to almost 13 GW from less than 2 GW in 2010; these imports originated predominantly from Malaysia, China, South Korea and Vietnam (more than 9 GW).
A group of companies has been established known as the Silicon Module Super League (SMSL). Between them they control a significant part of global polycrystalline and monocrystalline silicon manufacturing, and global production and sales of PV modules. This group includes Trina Solar, JinkoSolar, Canadian Solar, Hanwha Q-CELLS, JA Solar, GCL and LONGi Solar. Of these, only Hanwha Q-CELLS and Canadian Solar are not of Chinese origin (and are from South Korea and Canada, respectively). The total share of goods, dispatched by these companies globally has grown from 8-9% in 2013 to almost 45% in 2017 over the last 5 years [78]. A Chinese company Xi'an LONGI Silicon Materials Corp. is the largest manufacturer of monocrystalline silicon in the world (4.5 GW – in 2015), and GCL-Poly Energy Holdings Limited, headquartered in Hong-Kong, the largest manufacturer of polycrystalline silicon (15 GW in 2015 - GCL). A Chinese company - Trina Solar - has entered the top three in recent years with overall scope of supplies exceeding 30 GW, and who employ over 15 000 people and have more than 1300 patents. The scope of supplies of a Chinese JinkoSolar with headquarters in Shanghai improved markedly in 2015 (by more than 53%). Production facilities of the company are located in China, Malaysia, Portugal and South Africa [79].
Founded in 2001 in Canada, Canadian Solar have installed more than 25 GW PV panels, produced under the brand name in Canada, China and Vietnam, during 16 years of business activities. One more Chinese company making the super league, JA Solar, realized around 23 GW of its production by the end of 2017. 31 % gross sales are made to Japan, 33% remain in China, 13% are shipped to Europe, another 6% of the company supplies go to the American market. The only South Korean company in the above list - Hanwha Q-CELLS has an extensive network of production outlets in China, Malaysia and South Korea. Research centres of the company are located here and in Germany. Its production capacities are calculated as 8 GW. An important feature of First Solar is its use of cadmium telluride (CdTe) as a semiconductor in solar cells.
According to various sources the top 10 largest PV module suppliers globally in recent years include:
• JinkoSolar (China)
• JA Solar (China)
• Trina Solar (China)
• LONGi Solar (China)
• Canadian Solar (Canada)
• Hanwha Q-CELLS (S. Korea)
• Risen Energy (China)
• First Solar (USA)
• GCL System Integration Technology (China)
• Shunfeng Photovoltaic(China)
In listing the world leaders in the PV industry we cannot ignore the companies that have to some extent lost their market share but remain notable players in the market: the Japanese company Sharp and the American Sunpower. The famous round-the-world record set by a solar-powered airplane, Solar Impulse, used Sunpower PV panels.
The development of CPV technology has seen considerably more fluctuation. This sector does not have any outright leader but installed capacities across the world are many times smaller than that of conventional photovoltaics. The leaders with the highest installed capacities are Soitec (France/Germany), Amonix, Solaria, SunPower (all American), and Suncore Photovoltaic, RedSolar (all Chinese). However, it should be noted that the majority of these companies have sold their facilities, or suspended development of this sector. Thus, one of the first large-scale CPV stations in Alamoza (USA) was eventually bought by a Korean company Korea Electric Power Corp (Kepco) for a negligible $34 million. Soitec, SolFocus and GreenVolts [80] announced that they have ceased operating in this sector, which makes Chinese companies dominant in the market.
When considering the world leading companies developing CSP technologies, it is necessary to remember that most of CSP capacities are concentrated in Spain and the USA. Figures 31 -32 show shares of major owners of relevant energy facilities in these countries. It can be seen that a Spanish company Abengoa Solar has the total largest installed capacity in both countries (part of facilities have outside shareholders). But financial problems of this company have seriously damaged the general impression of its steady growth in the sector [81-83]. NextEra, Bright Source Energy (USA), ACS/Cobra Group, Acciona (Spain) must be mentioned as other market players.
Fig. 31. Major concentrating solar power companies in Spain, %
Source: [21]
Fig. 32. Major concentrating solar power companies in the USA, %
Source: [21]
While Spanish companies mainly prefer parabolic trough facilities; Bright Source Energy is developing Power tower technologies and operates the largest station in the USA - Ivanpah Solar Power Facility with a capacity of 377 MW. It holds shares in a large facility in Israel - Megalim, with a capacity of 121 MW. The largest manufacturers of mirrors and receivers for CSP facilities are Schott, Flabeg (Germany), Rioglass (who have headquarters in Brussels), St Gobain (France) and others. Turbines for solar power stations are most commonly supplied by Siemens (Germany), GE (USA), Alstom (France) [21].
Figures 33-34 present a sample of share prices for some public companies specializing mainly in solar energy.
Fig. 33-34. Dynamics of share prices for the leading public companies in Solar PV and CSP, 2009-2019
Source: Yahoo Finance
Additional information about the companies that operate in the sector of solar energy is available in the databases [63, 84-86].
Research and innovations
The main stimulus driving research and innovation in solar energy is the solution of key problems specific for these technologies, which have been briefly mentioned above. Among them we might outline the main ones – intermittent operation of converters due to natural factors, low efficiency of solar energy conversion to electric power, high capital and operational costs of erection and maintenance of solar power stations.
In the field of PV technologies, increased reliability of converters and inverters, tracker systems, reduction of production costs, reduced use of costly materials, development of thin-film technologies, enhancement of optics in concentrating systems are matters of particular interest.
Specific areas of CSP technological optimization among others include reduction of mirror costs, including replacement of costly silvered surfaces with other materials; development of storage systems, also with more effective heat carriers; optimization of solar tracker systems and solar concentrator field control systems; efficiency enhancement of receivers; reduction of water consumption and upgrade of dry cooling technologies; maximization of heat transfer fluid temperature and others.
A good indicator of innovation activity trends is the count of patent applications registered in the International Patent System (WIPO), as many inventors prefer to submit original applications to this institution to confirm their authorship before patenting in national patent offices. General trends in counts of patent applications to WIPO for different solar energy technologies are shown in Figures 35-36.
Fig. 35. Count of solar energy patent applications, filed in WIPO Fig. 36. Count of CSP patent applications, filed in WIPO
Source: WIPO
PV related technology is by far the most common in patent applications, which corresponds with the prevalence of installed PV capacities compared to other technologies. The growth in the number of applications concerning basic photovoltaics has not been interrupted, as compared to those of concentrating technologies. A more comprehensive analysis of the latter group shows a stabilization of patent activity (or even a decline) for all subgroups (paraboloids, Fresnel technologies, etc.), except for solar tower technologies. The rate of growth in patent filing for this technology is comparable to that for photovoltaics.
The team Advanced Energy Technologies made an estimate of innovative patent activities in the field of CSP technologies over the 10 years from 2009 till 2018 according to the data of the leading patent offices worldwide. The applied method of research is available on the Advanced Energy Technologies website. A brief extract from this work concerning only patents issued excluding submitted applications is given below. Altogether around 7500 documents were found. The map presented in Figure 37 shows distribution of patents issued by the top 10 national offices worldwide and distribution of patents received by applicants – residents of appropriate countries.
According to the acquired data, the undisputed leader in innovations is the USA, both in the number of patents issued and the number of residents-applicants. China has the second highest number of patents issued, followed by a large gap to Japanese, European and Australian patent offices.
Fig. 37. Distribution of CSP technology patents by countries of the world for the period 2009 - 2018

Source: Advanced Energy Technologies![]() Distribution of CSP technology patents by countries [0.5Mb]
Distribution of CSP technology patents by countries [0.5Mb]
All the patents found in patent databases were considered as belonging to a group with a preset content.
The first group listed basic concentrating solar power technologies and relevant and associated technologies – basic CSP technologies, including Parabolic Trough concentrators, Solar Tower systems, Dish Stirling systems, Linear Fresnel Reflector systems, as well as Experimental CSP and CSP in General. Furthermore, they list Storage CSP or Hybrid CSP technologies. It is often difficult or even impossible to uniquely identify ownership of a patent to a particular group. In such cases a document is related only to the group being clearly identified in a document text, but the remaining documents are not considered in an analysis of that item. If one document addressed simultaneously several technologies, for example Parabolic Trough and Storage CSP or Hybrid CSP, they were related to several groups of basic technologies.
Another group listed more specific technological operations, described as ‘technology elements’. All the patent documents found were assigned to a technology element, provided it was possible. As in the first case, if one document specified several corresponding technology elements, such relevance was allocated proportionally. The list of these elements was generated as follows: Optics, Receivers, Heat Removal, Turbines and other Power Generation, Control Systems; Storage, Tracker, Auxiliary Equipment and Support System.
Fig. 38. Change dynamics of the number of patents, related to basic CSP technology components, %
Source: Advanced Energy Technologies
UT - Solar updraft tower; ST - Solar Tower; SH - Storage CSP or Hybrid CSP; PT - Parabolic Trough; LFR - Linear Fresnel Reflector; H - Solar heating; G - CSP in General; E- Experimental CSP; DS - Dish / Stirling; CPV - Concentrator photovoltaics
The largest number of selected patents relates to Concentrator photovoltaics (31%), Parabolic Trough (15%) and Solar Tower (14%) technologies.
The top 10 applicants are listed in Table 6. The top six applicants are resident in Europe, the rest from the US, China and Taiwan. The leader by the number of patents received is the Spanish company Abengoa Solar New Technologies.
Table 6. Top 10 CSP patent holders and their share in the total number of patents issued worldwide between 2009 – 2018
| Status | Country | Name | Average rating | Total 2009 - 2018 |
|---|---|---|---|---|
| Company | ES | Abengoa Solar New Technologies, S.A. | 17.9 | 255 |
| Company | US | SunPower Corporation | 16.8 | 153 |
| Organization | FR | Commissariat a l'energie atomique et aux energies alternatives | 17.2 | 116 |
| Company | CH | Alstom Technology, Ltd | 16.5 | 86 |
| Company | DE | Siemens AG | 16.2 | 68 |
| Organization | DE | Deutsches Zentrum für Luft- und Raumfahrt (DLR) | 14.1 | 65 |
| Company | TW | Hon Hai Precision Industry Co., Ltd. | 13.4 | 61 |
| Company | US | 3M Innovative Properties Company | 15 | 53 |
| Organization | IL | Fraunhofer-Gesellschaft zur Förderung der Angewandten Forschung e.V. | 15.2 | 53 |
| Company | DE | Schott Solar AG | 15.2 | 42 |
Source: Advanced Energy Technologies
Fig.39. Distribution of documents by technology elements, 2009 – 2018, %
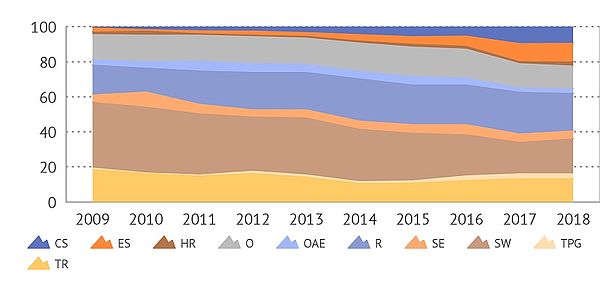
Source: Advanced Energy Technologies
O – Optics; R – Receiver; ES - Energy storage; TPG - Turbines and other power generation; TR – Tracker; CS - Control systems; HR - Heat removal; OAE - Other auxiliary equipment; SE - Structural elements; SW - System as a whole
Receivers and optics are the most popular products in the patents analyzed. In addition, solar tracker systems, supporting systems and auxiliary equipment, as well as energy storage have significant shares among the whole range of technological components.
The third group of patent documents related to CSP technologies was considered in relation to their application in solving various technical problems. If one document declared several problems at once, such a patent was filed for each of the problems. Taking into account existing and new technical terminology the list of problems addressed in patents can be extensive and ambiguous and can seriously impair analysis. In this respect every conceivable bottleneck was split into four basic sectors – administrative and organizational problems; environmental and social problems; issues of high cost; and low efficiency problems. The two latter problems were further broken down into sub-problems. There is a section covering vague or unspecified information in patent description problems.
Fig. 40. Distribution of documents by problems, 2009 – 2018
Source: Advanced Energy Technologies
AOP - Administrative and organisational problems; ESI - Environmental and social impact; HCEP - High costs of equipment production; HCG - High costs in general; HCM - High costs of maintenance; HCPC - High costs of plant construction; HCRR - High costs of repair and replacement; LEEF - Low efficiency due to environmental factors; LEG - Low efficiency in general; LEOA - Low efficiency of optics or absorber; LESE - Low efficiency of secondary equipment; LESM - Low efficiency due to solar movement; UP - Unclear problem
Approximately 55% of patents offered technical solutions to three main problems - low efficiency of optics or absorber, high costs of equipment production, and problems related to high costs of repair and replacement.
During the period from 2009 till 2018 there has been a significant growth in the relative number of patents offering technical solutions to high costs of maintenance or high costs of repair and replacement.
The technological interests of the top 10 patent holders for the period under consideration are shown in Figure 41. Each of the 10 leading companies has optics and receiver related patents to their credit. Abengoa Solar New Technologies had the most diverse technological components.
Fig. 41. Share of top 10 patent holders of specific CSP technological components, 2009 - 2018, %
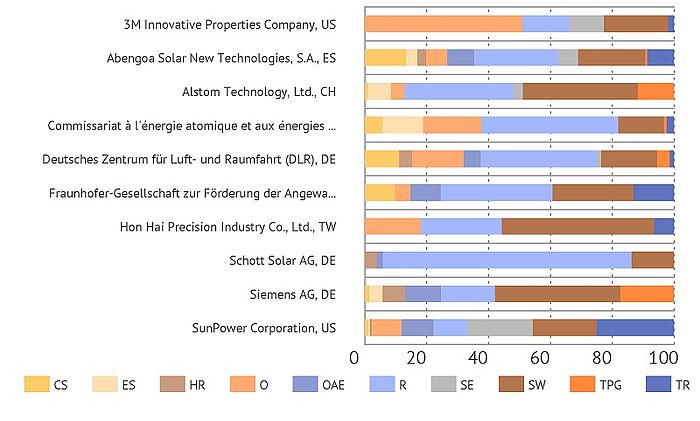
Source: Advanced Energy Technologies
CS – Control Systems; ES - Energy Storage; HR – Heat Removal; O – Optics; OAE – Other Auxiliary Equipment; R – Receivers; SE – Structural elements; SW – System as a whole; TPG – Turbines and other Power Generation; TR – Tracker
We note some groups of patents by specific subject matters, characterized with noticeable individual parameters. Thus, the company PPG Industries Ohio, Inc. patented a series of inventions offering various design options of a reflective article, yet reaching higher reflective properties and a longer lifetime for an article (for example, in a US patent - Reflective article/ P: US8497015B2 - due to application of different combinations of non-organic coatings). Patents offer new substances, which is a rather rare thing in concentrating solar energy sector (the total share of such documents does not exceed 7%). Altogether we have revealed 12 patents in this group, which were filed in 8 national patent offices.
The company SAINT-GOBAIN INDUSTRIEKERAMIK RODENTAL GmbH offered a series of inventions dedicated to a more advanced design of absorber and optional methods for its production (for example, an Australian patent - Method for the production of a ceramic absorber member for solar radiation, and absorber member/ P: AU2010209642B2). Seven of the documents found related to this group are patented in the USA, France, Morocco, Germany, South Africa, South Korea and Australia. All the documents refer to the problem of low efficiency of optics or absorber.
Schott Solar AG, specialize in the design of receivers and methods of their production, and in particular they proposed a series of inventions aimed at the optimization of absorber pipes. Fourteen documents of this series were patented in seven national and regional patent offices and include: P: MA33895B1, P: MA35424B1, P: MA37846B1 (Morocco), P: CN102639945B, P: CN103797311B, P: CN102575873B, P: CN103471267B (China), P: DE102009047548B4, DE102011082767B4, P: DE102013211381B4 (Germany), P: IL219830A (Italy), P: US9404674B2 (USA), P: AU2010326605B2 (Australia), P: EP2756236B1 (European Patent Office). Most of the patents were received in China, Morocco and Germany. Inventions are aimed at reducing the high costs of equipment production or the high costs of repair and replacement.
The total share of patents from the list analyzed that in one way or another addressed the issue of energy storage systems, accounted for a little more than 7%. Of these, a significant portion belong to the group of patents of an American company LightSail Energy Inc, specializing in the design of compressed air energy storage systems. In the past 10 years we have only found 25 patents filed by the company, registered in four national offices – in the USA (19 documents), Japan, South Korea, China, and in the European Patent Office. All these documents cover the problems of LESE - Low efficiency of secondary equipment and LESM - Low efficiency due to solar movement. Practically all documents refer to the optimization of the technical design of devices to combat this. The list of other companies that received more than 10 patents covering Storage CSP or Hybrid CSP during the past decade, excluding the previously mentioned LightSail Energy Inc., include an American company McAlister Technologies, LLC, a Swiss company Alstom Technology, Ltd., a Chinese company Wuhan Kaidi Engineering Technology Research General Institute Co., Ltd. and a Spanish company Abengoa Solar New Technologies, S.A.
The leader in the number of received patents covering solar tracker systems for the specified period, is an American company SunPower Corporation, better known for its developments in the field of Solar PV. The company has patented several groups of patents on the subject matter, including different designs and methods of control, including a tracking solar collector assembly, a tilt assembly for tracking solar collector assembly, a variable tilt tracker, and others. Altogether, the company received more than 20 patents on the subject matter. The company patents its inventions mainly in the USA, but also in Japan, China, and Australia. Other companies in the market that actively patent solar tracking technologies are Abengoa Solar New Technologies, S.A. and Mitsui Engineering & Shipbuilding Co., Ltd.
Trends of development
There are many different future scenarios of solar energy development, which normally consider individual impact scenarios for concurrent events, and performance indicators of this industrial sector are calculated based on special models. Most of them to some extent forecast an essential growth of the share of electric and thermal power production based on solar energy.
Thus, the International Energy Agency (IEA), with reference to an updated scenario against the previous one in 2010 [87] (hi-Ren Scenario), supposes that by 2030 there will be more than 1,700 GW of PV capacities installed, and by 2050 – almost 4 700 GW and will be generated over 6,000 TWh, which will be around 16 % of the total amount of generated electric power. In more advanced countries the share of Solar PV in the overall electric power generation can make: China and India – more than 20%, USA and Middle East about 20%. In the EU countries growth will be less than 10%.
According to more far-ranging predictions stated in [60], nearly 1 TW of total installed solar power is possible by 2021 in the most optimistic scenario, or 623.2 GW in a more conservative one. The five leaders in either scenario will be the following – China (88.4 -160.4 GW), India (49.8-88.4 GW), the USA (47.2-81 GW), Japan (19.8-40.2 GW), and Germany (7.6-18.8 GW). Injection of new capacities in Europe will freeze under the low scenario, staying within the region of 8.1 GW a year, but in the higher scenario will increase up to 27.3 GW by 2021.
The regional outlook in [88] conducted for the USA, shows the curve of increase in PV-driven electric power generation as an almost straight line until the year 2040. It is expected that by that time the total utility-scale and end-use solar electric power generation will provide 400 TWh a year.
Thus, the most optimistic scenarios of PV development in the world suppose the following indicators [87]:
Maximum installed capacities by 2050 - almost 4700 GW
Power generation in 2050 - more than 6000 TWh
PV-driven generation by 2050 - over 15%
Growth leaders – China, India, the USA, countries of the Middle East, developing countries of Asia.
The updated IEA Roadmap of 2014 [89] supposes that by the year 2050 the total solar thermal share in the global power production could exceed 10%. Furthermore, more than 250 GW of CSP capacities might be installed in the world by 2030, and about 1000 GW – by 2050. Most dynamically this sector of solar energy will develop in the Middle East, Africa, India, USA. The Roadmap also considers a substantial decline in investment costs for this kind of solar power station by 2050 - down to approximately 2000 $/ kW for stations without energy storage and to approximately 3500 $/ kW for those with thermal storage.
Such scenarios are based also on solar energy development roadmaps in specific countries and large regions. For example, Saudi Arabia declared its target to achieve 25 GW of CSP capacities, China is planning to deploy 3 GW by 2020, India announced 20 GW [28]. Saudi Arabia announced the construction of the world’s largest 700 MW CSP plant with a 260 high central tower [90]. In early 2018, Akesai government, Gansu Province and Huafeng Energy signed a memorandum on development of a CSP project with a total capacity of 1 GW and negotiate the prospects of its scaling-up to 10 GW [91]. By the end of 2017, with reference to estimates in [21], there were 22 CSP stations under construction in the world with a total capacity exceeding 1,400 MW, including those in China – 6 projects (600 MW), India – 5 (240 MW), Morocco – 2 (135 MW), as well as Saudi Arabia, Israel, Chile, South Africa and in other countries. Some other projects with a total capacity of 3,300 MW are under development. Most of them are also located in China. It is worth noting that some large projects are under consideration in Australia, Chile, United Arab Emirates, and South Africa.
When considering the future prospects of CSP technologies it is impossible to ignore the project MENA in the countries of the Middle East & North Africa, possessing unique environmental conditions with high level of Direct Normal Irradiance (DNI) and extended periods of cloudless days of sunshine. Development of an extensive network of solar stations in this region would provide not only sustainable power supply of the member countries, but also sell surplus electric power to other countries, particularly Southern Europe. Clearly, the positive evaluation of CSP development opportunities in this region made in [89] is based on the assumption of full-scale implementation of this massive project. However, its implementation requires enormous capital investments, intensified production of components, sufficient water supply, etc. In addition, political fluctuations in the region, military operations and intensive migration of the population have caused additional problems in implementing the project. Nevertheless, this project, being one of the most prospective and large-scale renewable projects, can become key to the strategies of climate change mitigation and sustainable power supply of the number of densely populated countries and regions of the world. More comprehensive information on this project is given in [92-94].
The most optimistic scenarios of CSP development in the world suppose the following indicators [89]:
Maximum installed capacities by 2050 - about 1000 GW
Power generation in 2050 - over 4000 TWh
CSP-driven generation in 2050 - over 10%
Growth champions – Middle East, North Africa, India, the USA, China.
References
[1] Solar Energy Basics / The National Renewable Energy Laboratory (NREL) / www.nrel.gov/workingwithus/re-solar.html
[2] SOLAR ENERGY TECHNOLOGIES OFFICE / U.S. Department of Energy / energy.gov/eere/solar/articles/solar-energy-technology-basics
[3] Solar power / Wikipedia / en.wikipedia.org/wiki/Solar_power
[4] SolarServer/ Basic Knowledge / www.solarserver.com/knowledge/basic-knowledge.html
[5] Renewable / Glossary / U.S. Energy Information Administration (Sep, 2020)/ www.eia.gov/tools/glossary/index.php
[6] Solar energy glossary / U.S. Department of Energy / energy.gov/eere/solar/solar-energy-glossary
[7] What is Solar Energy? Common Solar Terms Defined / us.sunpower.com/blog/2016/10/26/definition-common-solar-terms/
[8] Global Solar Atlas / globalsolaratlas.info
[9] National Centers for Environmental Information / www.ncdc.noaa.gov
[10] Solargis / solargis.info
[11] NASA Surface meteorology and Solar Energy: Global Data Sets / eosweb.larc.nasa.gov/cgi-bin/sse/global.cgi
[12] Vaisala / www.vaisala.com/en
[13] Photovoltaic Geographical Information System (PVGIS) / re.jrc.ec.europa.eu/pvgis/
[14] National Solar Radiation Data Base / rredc.nrel.gov/solar/old_data/nsrdb/
[15] The World Radiation Data Centre (WRDC) / wrdc.mgo.rssi.ru
[16] NASA Surface meteorology and Solar Energy – Definitions / eosweb.larc.nasa.gov/sse/text/definitions.html
[17] OpenEI / openei.org/wiki/Main_Page
[18] CURRENT STATUS OF CONCENTRATOR PHOTOVOLTAIC (CPV) TECHNOLOGY (PDF) / ISE and NREL / 2017 / www.ise.fraunhofer.de/content/dam/ise/de/documents/publications/studies/cpv-report-ise-nrel.pdf
[19] Concentrator photovoltaics / en.wikipedia.org/wiki/Concentrator_photovoltaics
[20] Sopogy MicroCSP / www.sopogy.org
[21] Concentrating Solar Power Projects / The National Renewable Energy Laboratory (NREL) / solarpaces.nrel.gov
[22] GlassPoint Brings Gigantic 850 MWth Solar EOR to California / www.solarpaces.org/glasspoint-brings-gigantic-850-mwth-solar-eor-to-california/
[23] GlassPoint cuts costs by 55pc at Oman concentrated solar power project / helioscsp.com/glasspoint-cuts-costs-by-55pc-at-oman-concentrated-solar-power-project/
[24] A Huge Solar Plant Caught on Fire, and That’s the Least of Its Problems / www.wired.com/2016/05/huge-solar-plant-caught-fire-thats-least-problems/
[25] Sandia, Stirling Energy Systems set new world record for solar-to-grid conversion efficiency / share-ng.sandia.gov/news/resources/releases/2008/solargrid.html
[26] This Is The World's Most Efficient Solar Electricity System, Swedish Researchers Claim / www.sciencealert.com/this-is-the-world-s-most-efficient-solar-electricity-system-swedish-researchers-claim
[27] 31% Efficient Stirling Engines Used to Convert 1.5MW of Arizona Solar Power / www.greenoptimistic.com/31-efficient-stirling-engines-used-to-convert-1-5mw-of-arizona-solar-power-20100102/
[28] Concentrating Solar Power SBC Energy Institute June 2013 (PDF) / energypedia.info/images/5/56/Concentrating_Solar_Power_-_Factbook.pdf
[29] 16.6MWTH CSP FOR COMBINED HEAT AND POWER GENERATION, DENMARK / www.aalborgcsp.com/projects/166mwth-csp-for-combined-heat-and-power-generation-denmark/
[30] Sweden Set to Launch Residential Energy Storage Scheme / www.renewableenergyworld.com/articles/2016/10/sweden-set-to-launch-residential-energy-storage-scheme.html
[31] Concentrating Solar Power Gen3 Demonstration Roadmap (PDF) / Mark Mehos, Craig Turchi, Judith Vidal, Michael Wagner, and Zhiwen Ma / The National Renewable Energy Laboratory (NREL) / www.estelasolar.org/Docs/Publications/Others/NREL_2017_gen3_roadmap.pdf
[32] Thermal Energy Storage for Concentrated Solar Power / HELIOSCSP / helioscsp.com/thermal-energy-storage-for-concentrated-solar-power/
[33] Molten salt instead of thermal oil in solar thermal parabolic trough plants shall reduce the levelized electricity costs / www.dlr.de/sf/en/desktopdefault.aspx/tabid-10436/20174_read-48143/
[34] IEA Solar Heating & Cooling Programme / www.iea-shc.org/country-reports
[35] Global Solar Thermal Energy Council / www.solarthermalworld.org
[36] Technology Roadmap: Solar Heating and Cooling / © OECD / IEA 2020, IEA Publishing, Licence: www.iea.org/t&c / International Energy Agency / www.iea.org/publications/freepublications/publication/technology-roadmap-solar-heating-and-cooling.html
[37] Solar Process Heat Basics / The National Renewable Energy Laboratory (NREL) / www.nrel.gov/workingwithus/re-solar-process.html
[38] Solar Water Heaters / U.S. Department of Energy / energy.gov/energysaver/water-heating/solar-water-heaters
[39] Solar Heat Worldwide (PDF) / Global Market Development and Trends in 2016 / Werner Weiss, Monika Spörk-Dür, Franz Mauthner / AEE INTEC / www.iea-shc.org/data/sites/1/publications/Solar-Heat-Worldwide-2017.pdf
[40] Renewables Global Status Report 2020 (PDF) / REN 21 / www.ren21.net/status-of-renewables/global-status-report/
[41] Electric Power Annual 2016 / U.S. Energy Information Administration (Sep, 2017)/ www.eia.gov/electricity/annual/
[42] World Energy Perspective: Cost of Energy Technologies / World Energy Council 2013 / www.worldenergy.org/publications/2013/world-energy-perspective-cost-of-energy-technologies/
[43] RENEWABLE ENERGY TECHNOLOGIES: COST ANALYSIS SERIES (PDF) / International Renewable Energy Agency (IRENA), Abu Dhabi / www.irena.org/documentdownloads/publications/re_technologies_cost_analysis-csp.pdf
[44] What are the most efficient solar panels on the market? / news.energysage.com/what-are-the-most-efficient-solar-panels-on-the-market/
[45] Ultra-Efficient Solar Power Doubling the efficiency of solar devices would completely change the economics of renewable energy. Here is a design that just might make it possible / www.technologyreview.com/featuredstory/513671/ultra-efficient-solar-power/
[46] Cost and Performance Characteristics of New Generating Technologies, Annual Energy Outlook 2020 / U.S. Energy Information Administration (Jan 2020) / www.eia.gov
[47] U.S. Solar Photovoltaic System Cost Benchmark: Q1 2017 (PDF) / The National Renewable Energy Laboratory (NREL) / www.nrel.gov/docs/fy17osti/68925.pdf
[48] Solar Photovoltaic / SBC Energy Institute June 2013 / energypedia.info/images/4/41/SBC_Energy_Institute_Solar_PV_FactBook.pdf
[49] Renewable Energy Cost Analysis - Solar Photovoltaics /International Renewable Energy Agency (IRENA), Abu Dhabi / www.irena.org/publications/2012/Jun/Renewable-Energy-Cost-Analysis---Solar-Photovoltaics
[50] ELECTRICITY STORAGE AND RENEWABLES: COSTS AND MARKETS TO 2030 (PDF) / International Renewable Energy Agency (IRENA), Abu Dhabi / www.irena.org/-/media/Files/IRENA/Agency/Publication/2017/Oct/IRENA_Electricity_Storage_Costs_2017.pdf
[51] Dispatchable Solar Concentrated Solar Power Broke Price Records in 2017/ helioscsp.com/dispatchable-solar-concentrated-solar-power-broke-price-records-in-2017/
[52] Solar Thermal Power Prices have Dropped an Astonishing 50% in Six Months / www.solarpaces.org/solar-thermal-energy-prices-drop-half/
[53] CSP tower installation costs drop on heliostat innovations, pre-assembly / analysis.newenergyupdate.com/csp-today/csp-tower-installation-costs-drop-heliostat-innovations-pre-assembly
[54] Solar in 2018: Better Technology, Record-Breaking Installations / www.renewableenergyworld.com/articles/print/volume-21/issue-1/features/solar/solar-in-2018-better-technology-record-breaking-installations.html
[55] Concentrating Solar Power and Water Issues in the U.S. Southwest (PDF) / The National Renewable Energy Laboratory (NREL) / www.nrel.gov/docs/fy15osti/61376.pdf
[56] Horror at the world's largest solar farm days after it opens as it is revealed panels are SCORCHING birds that fly over them / www.dailymail.co.uk/news/article-2560494/Worlds-largest-solar-farm-SCORCHING-BIRDS-fly-it.html
[57] BP Statistical Review of World Energy June 2020 (PDF) / www.bp.com/content/dam/bp/en/corporate/pdf/energy-economics/statistical-review-2020/bp-statistical-review-of-world-energy-2020-full-report.pdf
[58] Renewable Energy Statistics 2020 (PDF) / International Renewable Energy Agency (IRENA), Abu Dhabi / www.irena.org/-/media/Files/IRENA/Agency/Publication/2020/Jul/IRENA_Renewable_Energy_Statistics_2020.pdf
[59] Europe breaks own renewables record — but can't keep up with China / www.dw.com/en/europe-breaks-own-renewables-record-but-cant-keep-up-with-china/a-42386502
[60] Global Market Outlook For Solar Power (PDF) / 2017 – 2021/ www.solarpowereurope.org/fileadmin/user_upload/documents/WEBINAR/Free_SolarPower_Webinar__Global_Market_Outlook_2017-2021.pdf
[61] Crescent Dunes concentrating solar plant begins producing electricity / U.S. Energy Information Administration (Mar, 2016) / www.eia.gov/todayinenergy/detail.php
[62] Statistics / © OECD / IEA 2020, IEA Publishing, Licence: www.iea.org/t&c / International Energy Agency / www.iea.org/statistics/
[63] Energy Research & Data / Power Plant Tracker / Enerdata / www.enerdata.net/research/power-plant-database.html
[64] U.S. Energy Mapping System / U.S. Energy Information Administration (Sep, 2020) / www.eia.gov/state/maps.php
[65] Operational UK Renewable Electricity Sites (Beta) / ukdataexplorer.com/renewables/
[66] Wiki-SolarThe authority on utility-scale solar power / wiki-solar.org/map/continent/index.html
[67] List of photovoltaic power stations / en.wikipedia.org/wiki/List_of_photovoltaic_power_stations
[68] SOLAR ENERGY TECHNOLOGIES OFFICE / U.S. Department of Energy / energy.gov/eere/solar/solar-projects-map
[69] Solar Energy Industries Association / Major Solar Projects List / www.seia.org/research-resources/major-solar-projects-list
[70] List of largest power stations / en.wikipedia.org/wiki/List_of_largest_power_stations
[71] Solar PV–hydro hybrid system at Longyangxia, China / www.hydropower.org/blog/case-study-solar-pv%E2%80%93hydro-hybrid-system-at-longyangxia-china
[72] The world’s first power plant combining hydroelectric and solar power is now open / futurism.com/the-worlds-first-power-plant-combining-hydroelectricity-and-solar-energy-is-now-open/
[73] The World’s First Power Plant To Combine Hydro And Solar Opens In Portugal / www.huffingtonpost.com/entry/hydro-solar-plant_us_595f96dee4b02e9bdb0c0fa6
[74] CSP Projects Around the World / SolarPACES—Solar Power and Chemical Energy Systems / www.solarpaces.org/csp-technologies/csp-projects-around-the-world/
[75] Listing projects / CPV Consortium / web.archive.org/web/20160310052314/http://cpvconsortium.org/projects
[76] List of photovoltaics companies / Wikipedia / en.wikipedia.org/wiki/List_of_photovoltaics_companies
[77] U.S. imports of solar photovoltaic modules mainly come from Asia / U.S. Energy Information Administration (Feb, 2018) / www.eia.gov/todayinenergy/detail.php
[78] Top 10 module suppliers in 2017/ www.pv-tech.org/editors-blog/top-10-module-suppliers-in-2017
[79] The world’s biggest solar photovoltaic cell manufacturers / www.power-technology.com/features/featurethe-worlds-biggest-solar-photovoltaic-cell-manufacturers-4863800/
[80] Korean Utility Kepco Buys 30MW Alamosa CPV Plant for $34M / www.greentechmedia.com/articles/read/Korean-Utility-KEPCO-Buys-30MW-Alamosa-CPV-Plant-From-Cogentrix-For-34M
[81] Abengoa U.S. unit wins court blessing to exit bankruptcy / www.reuters.com/article/us-abengoa-restructuring-usa-idUSKBN1432PQ
[82] Spanish energy giant Abengoa's collapse predicted by 17-year-old / www.theguardian.com/business/2015/dec/14/spain-energy-giant-abengoa-collapse-predicted-by-17-year-old
[83] Abengoa Said to Plan Shrinking by 30% to Avoid Insolvency / www.bloomberg.com/news/articles/2016-01-14/abengoa-said-to-plan-shrinking-itself-by-30-to-avoid-insolvency
[84] ENF Solar – Solar Companies and Products / www.enfsolar.com
[85] CSPWorld / CSP Guide / cspworld.org/guide
[86] SolarServer / Global Solar Industry Website / EEM Energy & Environment Media GmbH / www.solarserver.com/yellow-pages/companies.html
[87] Technology Roadmap Solar Photovoltaic Energy 2014 (PDF) / © OECD / IEA 2020, IEA Publishing, Licence: www.iea.org/t&c / International Energy Agency / www.iea.org/publications/freepublications/publication/TechnologyRoadmapSolarPhotovoltaicEnergy_2014edition.pdf
[88] Annual Energy Outlook 2017 with projections to 2050 / U.S. Energy Information Administration (Feb, 2018) / www.eia.gov/outlooks/aeo/pdf/0383(2017).pdf
[89] Technology Roadmap Solar Thermal Electricity 2014 (PDF) / © OECD / IEA 2020, IEA Publishing, Licence: www.iea.org/t&c / International Energy Agency / www.iea.org/publications/freepublications/publication/TechnologyRoadmapSolarThermalElectricity_2014edition.pdf
[90] ACWA Power awarded 700MW CSP project / www.esi-africa.com/acwa-power-awarded-700mw-csp-project/
[91] Positive changes taking place in China solar CSP industry / www.cspfocus.cn/en/market/detail_538.htm
[92] The World Bank CSP MENA Initiative / www.nurenergie.com/uploads/TuNur_Event_Worldbank_Jan26.pdf
[93] MENA Solar Market Outlook for 2017 / www.apricum-group.com/wp-content/uploads/2016/12/MENA-Solar-Outlook-2017.pdf
[94] Concentrating Solar Power for the Mediterranean Region / www.dlr.de/tt/Portaldata/41/Resources/dokumente/institut/system/publications/MED-CSP_complete_study-small.pdf
[95] Trackers spread globally as designs improve / 16iwyl195vvfgoqu3136p2ly-wpengine.netdna-ssl.com/wp-content/uploads/2017/05/Trackers-pvi_07_2016.pdf
[96] Concentrating solar power: Turkey approves expansion of hybrid GE CSP/natural gas/ wind plant / www.solarserver.com/solar-magazine/solar-news/archive-2011/kw47/concentrating-solar-power-turkey-approves-expansion-of-hybrid-ge-cspnatural-gaswind-plant.html
[97] Neuer Solarreceiver am Solarturm Jülich Schleudergang bei 1000 Grad Celsius / www.dlr.de/dlr/desktopdefault.aspx/tabid-10202/334_read-22527/
[98] Testbetrieb des neuen Wärmeempfängers CentRec® im Solarturm Jülich erfolgreich gestartet / www.dlr.de/sf/desktopdefault.aspx/tabid-10436/20662_read-50197
Photo gallery

Solar Power Plant, Monte Di Castro, 84 MW, (A)


")
")


")
")
")
")
")
")
")
")


 panels have not yet received large-scale development. South Africa")
 are more common. Solnova Solar Power Station, Spain")
")
")
")
")
")
")
")
")
")
")
")


")
")
")
")
")
")


")
")