
Contents
General State of the Economy
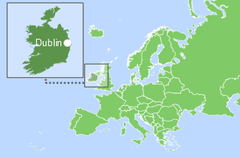
Ireland, officially the Republic of Ireland, is a European country located on the island of Ireland in north-western Europe consisting of 26 counties with its capital in Dublin. The country borders with Northern Ireland as a part of the United Kingdom in the north, with the Atlantic Ocean in the west, the Irish Sea in the east, the St. George Canal in the southeast, and the Celtic Sea in the south. The total length of the country's coastline is 1,448 km [3].
| Republic of Ireland | ||
|---|---|---|
| Capital: Dublin | Density: 71.3/km2 | Currency: Euro (EUR) |
| Official languages: Irish, English | Life expectancy at birth: 81.66 years | GDP (PPP): $722.929 billion (2023 est.) |
| National Day: 21 January | Area (land): 70,123 km2 | GDP - per capita (PPP): $137,638 (2023 est.) |
| Population: 5,123,526 (2022 est.) | Coastline: 1,448 km | Internet country code: .ie |
Source: [1,2,3,4,5]
According to 2023 statistics, Ireland, which ranks 120th in the world in terms of the size of its territory, is home to around 5,3 million people. In terms of population density, the country occupies the 147th place in the world. Ireland is a unitary parliamentary republic [1,2,3].
Ireland’s ranking positions relative to other countries have been determined for an extensive list of economic, energy, innovative and educational indices, as well as for metrics reflecting the state of the environment. The economic indices include, for example, GDP per capita, annual average GDP growth, high-technology exports, and others. The list of energy indices includes proven reserves of oil, gas and coal, production-consumption ratio combined, and energy use, etc. Each of the indices has a ranked list of included member countries. Since the number of countries in each rating is different for each index, the positioning of the country of interest is displayed on a special chart, where the vertical axis is a uniform relative scale from 0 to 1, whereas the horizontal axis denominates the various indices and respective numbers relating to the descriptions given underneath.
Thus, in such a relative “0-1” diagram, the country’s position is marked with a dot in proportion to its location in the original rating list. If the country is among the leaders regarding the selected indicator, it will be marked close to 1 in the upper green zone on the relevant chart “0-1”, if the country is an outsider in the rating list, then it will be marked in the lower red zone of the chart “0-1”, etc.
Ranking position of Ireland for list of economic indices:
| Sources: 1. GDP (purchasing power parity), 2020 est. / The World Factbook/Library/Central Intelligence Agency *228 2. GDP - per capita (PPP), 2020 / The World Factbook/Library/Central Intelligence Agency *229 3. Inflation rate (consumer prices), 2019 est. / The World Factbook/Library/Central Intelligence Agency *228 4. Charges for the use of intellectual property, receipts (BoP, current US$), 2020 / International Monetary Fund, Balance of Payments Statistics Yearbook, and data files. / License: CC BY-4.0 *88 5. The Global Competitiveness Index 2019 / Rankings / Reports / World Economic Forum *141 6. High-technology exports (current US$) 2019-2020 / United Nations, Comtrade database through the WITS platform / License: CCBY-4.0 / Data *134 7. 2021 Index of Economic Freedom / International Economies / The Heritage Foundation *178 8. Reserves of foreign exchange and gold, 2017 est. / The World Factbook / Library / Central Intelligence Agency *195 9. Annual average GDP growth in %, for the last 10 years (2011-2020) / World Bank national accounts data, and OECD National Accounts data files / License: CC BY-4.0 *206 10. Public debt (% of GDP), 2017 est. / The World Factbook / Library / Central Intelligence Agency *210 * Total number of countries participating in ranking Figure 1. Economic Indices of Ireland |
For most of the indices shown in the chart, Ireland is above the middle of the rankings. Of the indices presented, the country has the highest values for GDP per capita and annual average GDP growth in % (0.97-0.98). Ireland demonstrates high rates in the Index of Economic Freedom and for high-technology exports. The weakest parts of Ireland’s economic indicators are Public debt (0.25) and Reserves of foreign exchange and gold (0.49). In addition, data on the use of intellectual property is not available.
Energy Resources
Ireland has no significant fossil fuel reserves. The share of gas reserves is 0.005% of the world’s total, the share of coal is even less – 0.001%. In terms of tons of oil equivalent, according to 2024 data, conventional proved reserves by fuel type were: 52.3% – coal, 47.7% – natural gas (Fig.5).
Table 1. Fossil energy resources of Ireland
| Resource / Explanations | Crude oil | Natural gas | Coal | Shale Gas | Tight Oil | Coal mine methane |
|---|---|---|---|---|---|---|
| Value | no data | 0.35 | 15.43 | no data | no data | no data |
| Unit | - | Tcf | million short tonnes | - | - | - |
| Year | - | 2020 | 2021 | - | - | - |
| Source | [-] | [6] | [6] | [-] | [-] | [-] |
The potential for solar resources in Ireland is relatively small. In most of the country, GHI is 2.6-2.9 kWh/m2/day, which means that the efficiency of solar power generation is not overwhelming. Nevertheless, the Irish authorities envisage a massive and rapid increase in renewable generation capacity from solar energy. The situation with wind resources looks much better. Strong winds along the coast of Ireland, particularly from the Atlantic side, reach over 9.0 m/s at 50 m. The country has huge potential for the development of offshore wind energy.
Table 2. Renewable energy resources of Ireland
| Resource/ Explanations | Solar Potential (GHI)* | Wind Potential (50 м)* | Bio Potential (agricultural area) | Bio Potential (forest area) | Municipal Solid Waste |
|---|---|---|---|---|---|
| Value | < 2.6 | 6.5-8.0 | 65.5 | 11.4 | 644 |
| Unit | kWh/m2/day | m/s | % of land area | % of land area | kg per capita |
| Year | 2020 | 2020 | 2020 | 2020 | 2021 |
| Source | [7] | [8] | [9] | [10] | [11] |
*for most of the territory of the country
Almost 80% of the country's territory is covered by agricultural and forest areas. Industrial waste from these areas can provide a sufficient resource base for the development of various bioenergy technologies, in particular the production of biogas, bioethanol or biodiesel.
Energy Balance
According to [6], in 2022 in Ireland the total production of primary energy was 0.11 quadrillion Btu, while consumption was at the level of 0.605 quadrillion Btu. The share of domestic production in primary energy consumption was 18.2%. Thus, Ireland is a country heavily dependent on energy imports.
According to the Statistical Review of World Energy 2022, primary energy consumption in Ireland in 2021 amounted to 0.63 Exajoules [7], and was dominated by oil – 45.9 % , followed by gas – 31.6%, renewables – 11.9%, renewables – 6.25%, and coal – 6.6% [12].
Over the last ten years, the consumption of coal in Ireland has decreased significantly, but grew in 2021 due to its increased use in electricity generation [14]. Ireland has no domestic production of coal and oil and is fully dependent on imports. Consumption of natural gas is many times higher than domestic production, which has also demonstrated a downward trend since 2017.
Source: U.S. Energy Information Administration (Mar 2024) / www.eia.gov
Figure 2. The production and consumption of fossil fuels in Ireland (coal – left, gas – in the center, oil – right)
Ireland has been generating 27 to 34 TWh of electricity over the past 10 years, of which about 58% is provided by fossil fuels. The share of electricity from renewable sources, excluding hydropower, has been growing and accounts for approximately 40%. At the same time, this segment is dominated by energy generation from wind, which accounts for 84% of renewable electricity in 2021 [13,14].
Sources: U.S. Energy Information Administration (Mar 2024) / www.eia.gov | ||
| Figure 3. Electricity production in Ireland |
As can be seen from Figure 3, Ireland is completely self-sufficient regarding its electricity production. Total energy inputs to electricity generation account for approximately one third of Ireland's total primary energy supply. Over the last ten years the electricity generation increased by about 25%.
Graph of the energy indices of Ireland is presented in the figure below:
| Sources: 1. Crude oil proved reserves, 2021 / International Energy Statistic/Geography / U.S. Energy Information Administration (Nov 2021)*98 2. Natural gas proved reserves 2021 / International Energy Statistic / Geography / U.S. Energy Information Administration (Nov 2021) *99 3. Total recoverable coal reserves 2019 / International Energy Statistic / Geography / U.S. Energy Information Administration (Nov 2021) *81 4. Combination production-consumption for Crude oil 2018 / International Energy Statistic / Geography / U.S. Energy Information Administration (Nov 2021) *219 5. Combination production-consumption for Natural gas 2019 / International Energy Statistic / Geography / U.S. Energy Information Administration (Nov 2021) *123 6. Combination production-consumption for Coal 2019 / International Energy Statistic / Geography / U.S. Energy Information Administration (Nov 2021) *128 7. Electricity – from other renewable sources (% of total installed capacity), 2017 est. / The World Factbook / Library / Central Intelligence Agency *170 8. GDP per unit of energy use (PPP per unit of oil equivalent), 2020 *66 Primary energy consumption - BP Statistical Review of World Energy 2021/BP;GDP (purchasing power parity) - The World Factbook/Library/Central Intelligence Agency 9. Energy use (primary energy use of oil equivalent per capita) 2020 *127 Primary energy consumption – BP Statistical Review of World Energy 2021; Population - United Nations, Department of Economic and Social Affairs, Population Division (2019). World Population Prospects 2019, custom data acquired via website. Retrieved 15 November 2021*66 10. The Global Energy Architecture Performance Index Report (EAPI) 2017 / Rankings / Reports / World Economic Forum 11. Electric power consumption (kWh per capita), 2016 *217 Electricity Consumption - The World Factbook / Library / Central Intelligence Agency; Population - United Nations, Department of Economic and Social Affairs, Population Division (2019). World Population Prospects 2019, custom data acquired via website. Retrieved 15 November 2021 12. Combination of electricity production-consumption (kWh)/The World Factbook/Library/Central Intelligence Agency *216 * Total number of countries participating in ranking Figure 4. Energy indices of Ireland |
Ireland’s limited fossil resources are definitely reflected in the energy index chart, where the country is positioned at the bottom or below the middle of the chart for fossil fuel-related indexes. In terms of such indices as The Global Energy Architecture Performance Index, Energy use (0.96), and Electricity – from other renewable sources (0.94) Ireland is among the leaders. The country is relatively well-positioned in the combination of electricity production-consumption index.
Energy Infrastructure

As mentioned above, electricity generation in Ireland is to about 58% provided by fossil fuel-fired power stations, of which the majority runs on natural gas. However, Ireland’s largest electricity generation plant, Moneypoint located in Clare, is coal-fired. It should be noted that the national government plans to phase out the use of coal and peat in power generation.
Hydropower does not play a significant role, accounting for about 4.6% of Ireland's generation capacity with Shannon power plant located near Ardnacrusha as a biggest hydroelectric station. As of 2017, Ireland registered some small-scale hydropower plants up to 10 MW with a total installed capacity of 41.0 MW, generating roughly 121.0 GWh per year.

The share of electricity from renewable sources is growing rapidly, reaching about 40%. At the same time, this segment is dominated by energy generation from wind, which accounts for 84% of renewable electricity, followed by bioenergy and hydropower.
Ireland has a small but growing solar PV share. Many different solar projects, like the 250 MV Orit trust Solar Farm or the 95 MW Garballagh Lower Solar Farm, are already underway throughout Ireland, and more are expected in the near future [14].

Ireland has many active onshore wind farms located throughout the country. This includes Ireland's largest wind farm, the 174 MW Galway Wind Park in Connemara, County Galway.
Under the Climate Action Plan 2023, the Irish government has set an ambitious goal of ensuring that 80% of electricity comes from renewable sources by 2030. This is to be achieved through the onshore wind industry, doubling its capacity to 9 GW and the development of up to 8 GW of solar energy [15].
In addition, due to its location, Ireland has enormous potential for offshore wind energy infrastructure projects. To support Ireland's 2030 goals, the government has allocated additional resources to accelerate the development of offshore wind generation. The Irish offshore wind industry is estimated to be capable of providing at least 5 GW of electricity by 2030 as well as an additional 2 GW offshore wind for green hydrogen production [15].
One of the ambitious offshore wind projects is the Arklow Bank Wind Park Phase 2, which will be located off the coast of Arklow, where the Phase 1 wind farm, consisting of seven 25.2 MW wind turbines, was already built in 2004. The new project could make a significant contribution to Ireland's climate protection goals by generating up to 800 MW of electricity at the site [16]. Furthermore, the Shannon estuary on Ireland's west coast holds great promise for offshore renewable energy development. According to the government report [17], the estuary will become a leading location for Atlantic offshore wind, providing 2 GW by 2030 and 30 GW by 2050.
Education and Innovation
The following chart shows the position of Ireland in terms of education and innovation:
Sources: 1. The Global Innovation Index 2021, Rankings / Knowledge / World Intellectual Property Organization / Cornell University, INSEAD, and WIPO (2021): Energizing the World with Innovation. Ithaca, Fontainebleau, and Geneva *132 2. Patent Grants 2011-2020, resident & abroad / Statistical country profiles / World Intellectual Property Organization *185 3.Patents in Force 2020 / Statistical country profiles / World Intellectual Property Organization *109 4. QS World University Rankings 2022 *97 5. SCImago Country Rankings (1996-2020) / Country rankings / SCImago, (n.d.). SIR-SCImago Journal & Country Rank [Portal]. Retrieved 17 Nov 2021 *240 6. Internet users in 2018 / The World Factbook / Central Intelligence Agency *229 7. Internet users in 2018 (% Population) / The World Factbook / Central Intelligence Agency *229 8. Government expenditure on education, total (% of GDP), 2019 / United Nations Educational, Scientific, and Cultural Organization (UNESCO) Institute for Statistics. License: CCBY-4.0 / Data as of September 2021*177 9. Research and development expenditure (% of GDP), 2018 / UNESCO Institute for Statistics. License: CCBY-4.0 / Data *119 10. Scientific and technical journal articles, 2018 / National Science Foundation, Science and Engineering Indicators. License: CCBY-4.0 / Data *197 * Total number of countries participating in ranking | ||
| Figure 8. The indices of education and innovation in Ireland |
Ireland shows no extremes in the education and innovation sector – all indices are located in the middle or in the upper part of the chart. Among them, Ireland's best indicators relate to the number of patents granted and those in force, which surely also contribute to the country's high score in the Global Innovation Index 2021. QS World University Rankings, Internet users and government expenditure on education, total (% of GDP) are the lowest in Ireland, although they are above average relative to other countries.
Ecology and Environment Protection
Indicators related to environmental issues are presented in the following diagram:
| Sources: 1. CO2 total emission by countries 2020 / European Commission / Joint Research Centre (JRC) / Emission Database for Global Atmospheric Research (EDGAR)*208 2. CO2 per capita emission 2020/European Commission/Joint Research Centre (JRC) / Emission Database for Global Atmospheric Research (EDGAR) *208 3. Forest area 2020 (% of land area) / The Global Forest Resources Assessment 2020 / Food and Agriculture Organization of the United Nations *234 4. Forest area change 2010-2020 (1000 ha/year) / The Global Forest Resources Assessment 2020 / Food and Agriculture Organization of the United Nations *234 5. The Environmental Performance Index (EPI) 2020 / Rankings / Yale Center for Environmental Law & Policy / Yale University *180 6. Annual freshwater withdrawals (m3 per capita), 2017 *179 Annual freshwater withdrawals, total (billion m3), 2017 – Food and Agriculture Organization, AQUASTAT data. /License: CC BY-4.0; Population – United Nations, Department of Economic and Social Affairs, Population Division (2019). World Population Prospects 2019, custom data acquired via website. Retrieved 15 November 2021 7. The National Footprint Accounts 2017 (Biocapacity Credit / Deficit) / Global Footprint Network *188 8. Methane emissions (kt of CO2 equivalent), 2018 / Data for up to 1990 are sourced from Carbon Dioxide Information Analysis Center, Environmental Sciences Division, Oak Ridge National Laboratory, Tennessee, United States. Data from 1990 are CAIT data: Climate Watch. 2020. GHG Emissions. Washington, DC: World Resources Institute. Available at: License : Attribution-NonCommercial 4.0 International (CC BY-NC 4.0) *191 9. The Climate Change Performance Index (CCPI) 2022 / Overall Results / Jan Burck, Thea Uhlich, Christoph Bals, Niklas Höhne, Leonardo Nascimento / Germanwatch, NewClimate Institute & Climate Action Network *60 * Total number of countries participating in ranking | ||
| Figure 9. Environmental Indices of Ireland |
According to the chart above, even though most environmental indices are below the global average, the overall state of the environment in Ireland is not critical. In particular, the country has rather high positions in the rankings related to forest area change and The Environmental Performance Index (EPI) 2020. On the other hand, for indicators such as CO2 per capita emission, Annual freshwater withdrawals, The National Footprint Accounts and the Climate Change Performance Index 2022 Ireland’s position in the rankings is significantly below average.
References
[1] List of sovereign states and dependencies by area / Wikipedia / en.wikipedia.org/wiki/List_of_sovereign_states_and_dependencies_by_area
[2] List of countries and dependencies by population density / Wikipedia / en.wikipedia.org/wiki/List_of_countries_and_dependencies_by_population_density
[3] Ireland / The world factbook / Library / Central Intelligence Agency / www.cia.gov
[4] GDP, PPP (constant 2011 international $) / World Bank, International Comparison Program database. License: CC BY-4.0 / Data / The World Bank / www.worldbank.org
[5] GDP per capita, PPP (current international $) / World Bank, International Comparison Program database. License: CC BY-4.0 / Data / The World Bank / www.worldbank.org
[6] International Energy Statistic / Geography / U.S. Energy Information Administration (Dec 2022) / www.eia.gov/beta/international/
[7] Solar resource data obtained from the Global Solar Atlas, owned by the World Bank Group and provided by Solargis / Global Solar Atlas / globalsolaratlas.info
[8] Ireland Wind Map / Global Wind Atlas 2.0, a free, web-based application developed, owned and operated by the Technical University of Denmark (DTU) in partnership with the World Bank Group, utilizing data provided by Vortex, with funding provided by the Energy Sector Management Assistance Program (ESMAP). For additional information: globalwindatlas.info
[9] Agricultural land (% of land area) /Food and Agriculture Organization, electronic files and web site. License: CC BY-4.0 / Data / The World Bank / www.worldbank.org
[10] Forest area (% of land area) /Food and Agriculture Organization, electronic files and web site. License: CC BY-4.0 / Data / The World Bank / www.worldbank.org
[11] Municipal waste statistics Updated / 19 July 2018 / Full list / Statistics Explained / Eurostat / ec.europa.eu
[12] BP Statistical Review of World Energy 2020-2022 (PDF) / BP / www.bp.com
[13] Renewable Energy Statistics 2022 © IRENA
[14] Energy in Ireland. SEAI 2022 Report / www.seai.ie
[15] Climate Action Plan 2023 / Government of Ireland / assets.gov.ie/243585/9942d689-2490-4ccf-9dc8-f50166bab0e7.pdf
[16] Arklow Bank Wind Park Phase 2 / SSE Renewables / www.sserenewables.com
[17] Shannon Estuary Economic Taskforce. Interim Report / November 2022 / Department of Enterprise, Trade and Employment / enterprise.gov.ie/en/
The sources of charts and curves are specified under the images.
For more information about the energy industry in Ireland see here