
Contents
General State of the Economy
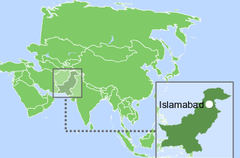
Pakistan, officially the Islamic Republic of Pakistan, is a country located in South Asia at the junction of Central Asia and the Middle East. Pakistan borders Afghanistan and Iran in the west, India in the east, and China in the northeast. The coastline of the Arabian Sea forms its southern border. The total length of the country's coastline is 1,046 km [1,2,3].
| Pakistan/Islamic Republic of Pakistan | ||
|---|---|---|
| Capital: Islamabad | Density: 244.4/km2 | Currency: Pakistani rupee (RS) (PKR) |
| Official languages: Urdu, English | Life expectancy at birth: 70.14 years | GDP (PPP): $1.512 trillion (2022 est.) |
| National Day: 14 August | Area (land): 770,875 km2 | GDP - per capita (PPP): $6,662 (2022 est.) |
| Population: 242,923,845 (2022 est.) | Coastline: 1,046 km | Internet country code: pkپاکستان. |
Source: [1,2,3,4,5]
According to 2022 statistics, Pakistan, which in terms of the size of its territory is 37th in the world, is home to around 243 million people. In terms of population density, the country is 56th in the world. Pakistan is a federal parliamentary republic with its capital in Islamabad [1,2,3].
The ranking positions of Pakistan relative to other countries have been determined for an extensive list of economic, energy, innovative and educational indices, as well as for metrics reflecting the state of the environment. The economic indices include, for example, GDP per capita, annual average GDP growth, high-technology exports, and others. The list of energy indices includes proven reserves of oil, gas and coal, production-consumption ratio combined, and energy use, etc. Each of the indices has a ranked list of included member countries. Since the number of countries in each rating is different for each index, the positioning of the country of interest is displayed on a special chart, where the vertical axis is a uniform relative scale from 0 to 1, whereas the horizontal axis denominates the various indices and respective numbers relating to the descriptions given underneath.
Thus, in such a relative “0-1” diagram, the country’s position is marked with a dot in proportion to its location in the original rating list. If the country is among the leaders regarding the selected indicator, it will be marked close to 1 in the upper green zone on the relevant chart “0-1”, if the country is an outsider in the rating list, then it will be marked in the lower red zone of the chart “0-1”, etc.
Ranking position of Pakistan for list of economic indices:
| Sources: 1. GDP (purchasing power parity), 2020 est. / The World Factbook/Library/Central Intelligence Agency *228 2. GDP - per capita (PPP), 2020 / The World Factbook/Library/Central Intelligence Agency *229 3. Inflation rate (consumer prices), 2019 est. / The World Factbook/Library/Central Intelligence Agency *228 4. Charges for the use of intellectual property, receipts (BoP, current US$), 2020 / International Monetary Fund, Balance of Payments Statistics Yearbook, and data files. / License: CC BY-4.0 *88 5. The Global Competitiveness Index 2019 / Rankings / Reports / World Economic Forum *141 6. High-technology exports (current US$) 2019-2020 / United Nations, Comtrade database through the WITS platform / License: CCBY-4.0 / Data *134 7. 2021 Index of Economic Freedom / International Economies / The Heritage Foundation *178 8. Reserves of foreign exchange and gold, 2017 est. / The World Factbook / Library / Central Intelligence Agency *195 9. Annual average GDP growth in %, for the last 10 years (2011-2020) / World Bank national accounts data, and OECD National Accounts data files / License: CC BY-4.0 *206 10. Public debt (% of GDP), 2017 est. / The World Factbook / Library / Central Intelligence Agency (from smallest to largest) *210 * Total number of countries participating in ranking Figure 1. Economic Indices of Pakistan |
For most of the indices shown in the chart, Pakistan is below the middle of the rankings. The weakest parts of Pakistani economic indicators are inflation rate and GDP per capita, where the country is represented at the bottom of the rankings. In addition, Pakistan performs very poorly both on the Global Competitiveness Index and the Index of Economic Freedom.
In terms of GDP, gold and foreign currency reserves, and GDP growth dynamics, Pakistan demonstrates quite high rates compared to other countries of the world.
Energy Resources
Pakistan has distinct proven reserves of fossil fuels in the form of natural gas and coal. The share of natural gas is 0.30% of the world’s total, the share of coal is 0.29%. However, the country's oil reserves are only 0.03% of the world total [6]. The share of Pakistan's population makes up almost 3% of the world's population. However, at the same time, gas and coal reserves in Pakistan are significantly lower than those of the world leaders. For instance, gas reserves are about 37 times less than in Qatar, while coal reserves are more than 45 times less than in Australia [6]. In addition to conventional gas resources, Pakistan has significant reserves of Tight Oil и Shale Gas [9].
In terms of tons of oil equivalent, according to 2024 data, conventional proved reserves by fuel type were: 77.9% – coal, 19.4% – gas, and 2.7% – oil (Fig.5).
The matrix of unconventional fossil resources looks somewhat different: shale gas accounted for 68.9%, shale oil (tight light) – for 30.8%, and coal mine methane utilization potential – for 0.2% (Fig.5).
Table 1. Fossil energy resources of Pakistan
| Resource /Explanations | Crude oil* | Natural gas* | Coal* | Tight Oil** | Shale Gas** | Coal mine methane |
|---|---|---|---|---|---|---|
| Value | 0.54 (0.03%) | 21.5 (0.30%) | 3 377 (0.29%) | 105.2 | 9.1 | 2.9 - 10.9 |
| Unit | billion barrels | Tcf | million short tons | billion barrels | Tcf | bcm |
| Year | 2021 | 2020 | 2021 | 2015 | 2015 | 2017 |
| Source | [6] | [6] | [6] | [7] | [7] | [8] |
*share of the country’s reserves in world total is provided in brackets
**unproved technically recoverable
Hydropower prevails in terms of installed renewable energy capacities (more than 77%), followed by wind energy (10.3%), and solar photovoltaics (more than 8.9%). Moreover, hydropower plays a significant role in Pakistan’s power generation, contributing 26% to all electricity produced in 2021. However, the country does not completely use its very high overall hydropower potential. This also applies to wind and solar power generation, which could also be much higher due to the favourable climate conditions. The country’s average solar activity is 5.5-5.7 kWh/m2 per day, and the most common wind speed is 4.0-5.5 m/s. Balochistan province, located in the southwestern part of the country near the border with Iran, has the greatest potential for renewable energy development in the country, since the intensity of solar GHI can reach 6.2-6.3 kWh/m2 per day, and wind speed exceeds 7.5 m/s at a height of 50 m.
Table 2. Renewable energy resources of Pakistan
| Resource/ Explanations | Solar Potential (GHI)* | Wind Potential (50 м)* | Bio Potential (agricultural area) | Bio Potential (forest area) | Municipal Solid Waste |
|---|---|---|---|---|---|
| Value | 5.5-5.7 | 4.0-5.5 | 47.6 | 4.8 | 0.43 |
| Unit | kWh/m2/day | m/s | % of land area | % of land area | kg/per capita/day |
| Year | 2018 | 2018 | 2020 | 2020 | 2018 |
| Source | [10] | [11] | [12] | [13] | [14] |
*for the majority of the territory of the country
Energy Balance
According to [6], in 2022 in Pakistan, the total production of primary energy was 1.978 quadrillion Btu, while consumption was at the level of 3.514 quadrillion Btu. Thus, the share of domestic production in primary energy consumption was 56.3%. This makes Pakistan a country largely dependent on energy imports. According to the Statistical Review of World Energy 2022, primary energy consumption in Pakistan in 2021 amounted to 3.86 exajoules and was dominated by gas – 41.7 %, followed by oil – 26.4%, coal – 17.4%, hydroelectricity – 9.35%, nuclear – 3.6%, and other renewables – 1.3% [9].
Fossil fuel production in Pakistan lags far behind the demand: in 2021, coal consumption was more than 2.5 times higher than production and oil consumption almost five times higher.
Source: U.S. Energy Information Administration (Mar 2024) / www.eia.gov
Figure 2. The Production and Consumption of fossil fuels in Pakistan (left — coal, in the center — gas, right — oil)
Total electricity generation in Pakistan has grown by about 60% over the past ten years. In 2022, approximately 63% of electricity was produced by thermal power plants, 21% – by hydroelectric power plants, and 13% by nuclear power. Renewables also contribute to the overall balance of electricity generation, reaching a share of almost 4% in 2022. By comparison, in 2010 the amount of electricity generated from renewables was about 6 times less.
Sources: U.S. Energy Information Administration (Mar 2024) / www.eia.gov | ||
| Figure 3. Electricity Generation in Pakistan |
The volume of electricity generation in Pakistan exceeds the volume of consumption. However, it should be taken into account that only 79% of the population has access to electricity [3]. In addition, due to the bad state of electric grids and other problems, there are large distribution losses, exceeding 17 billion kWh per year [3]. This predetermines the need for substantial reconstruction and additional equipment of power generating and distribution capacities.
The chart of Pakistan's energy indices is presented in the figure below.
| Sources: 1. Crude oil proved reserves, 2021 / International Energy Statistic/Geography / U.S. Energy Information Administration (Nov 2021)*98 2. Natural gas proved reserves 2021 / International Energy Statistic / Geography / U.S. Energy Information Administration (Nov 2021) *99 3. Total recoverable coal reserves 2019 / International Energy Statistic / Geography / U.S. Energy Information Administration (Nov 2021) *81 4. Combination production-consumption for Crude oil 2018 / International Energy Statistic / Geography / U.S. Energy Information Administration (Nov 2021) *219 5. Combination production-consumption for Natural gas 2019 / International Energy Statistic / Geography / U.S. Energy Information Administration (Nov 2021) *123 6. Combination production-consumption for Coal 2019 / International Energy Statistic / Geography / U.S. Energy Information Administration (Nov 2021) *128 7. Electricity – from other renewable sources (% of total installed capacity), 2017 est. / The World Factbook / Library / Central Intelligence Agency *170 8. GDP per unit of energy use (PPP per unit of oil equivalent), 2020 *66 Primary energy consumption - BP Statistical Review of World Energy 2021/BP;GDP (purchasing power parity) - The World Factbook/Library/Central Intelligence Agency 9. Energy use (primary energy use of oil equivalent per capita) 2020 *127 Primary energy consumption – BP Statistical Review of World Energy 2021; Population - United Nations, Department of Economic and Social Affairs, Population Division (2019). World Population Prospects 2019, custom data acquired via website. Retrieved 15 November 2021*66 10. The Global Energy Architecture Performance Index Report (EAPI) 2017 / Rankings / Reports / World Economic Forum 11. Electric power consumption (kWh per capita), 2016 *217 Electricity Consumption - The World Factbook / Library / Central Intelligence Agency; Population - United Nations, Department of Economic and Social Affairs, Population Division (2019). World Population Prospects 2019, custom data acquired via website. Retrieved 15 November 2021 12. Combination of electricity production-consumption (kWh)/The World Factbook/Library/Central Intelligence Agency *216 * Total number of countries participating in ranking Figure 4. Energy indices of Pakistan |
Pakistan has relatively good indicators for fossil fuel reserves, but domestic oil and coal production lags far behind consumption, thus forming a natural gap between supply and demand. According to the primary statistics, Pakistan has a good electricity generation to consumption ratio. However, as mentioned above, without taking into account the large losses in the distribution of electricity and the limited access of the population to electricity, these data do not reflect the real picture of energy supply.
In terms of energy use per capita and electric power consumption per capita, the country ranks well below average. In terms of such indicators as GDP per unit of energy use, Pakistan's rating positions are substantially lower than the world average.
Energy Infrastructure
The main gas fields under development are located in the southeast of the country in the provinces of Balochistan and Sindh, while the key oil fields are concentrated closer to the north of the country. Pakistan’s conventional oil infrastructure includes several medium-sized refineries in operation as well as several relatively large refineries and some under construction. In particular, the map below illustrates six operating refineries with a total crude oil processing capacity of 425,400 bpd and four refineries under construction with a planned capacity of 483,000 bpd. Two large oil terminals and two LNG import terminals (PGPC Port Qasim and Engro Elengy) are based in the south of the country, in the area near Karachi. Coal mining is carried out mainly in the in Sindh Province and the Balochistan Province.

Figure 5. Basic infrastructural facilities of the fossil fuel sector in Pakistan (click on the map to view a PDF version)
The Pakistani government and commercial organizations show considerable interest in the building of the Turkmenistan-Afghanistan-Pakistan-India (TAPI) gas pipeline, as well as the gas pipeline from Iran. The latter was supposed to be built back in 2014, but according to the latest data, Pakistan plans to complete it in 2024. The construction of TAPI is fraught with great risks, primarily due to the situation in Afghanistan.
Pakistan has an extensive network of hydroelectric power plants, which are mainly concentrated in the north of the country. They produce more than 20% of the country's electricity. Fossil-fuel plants are located mostly in the eastern part of the country. In the south, the Karachi area, there are two of the three nuclear power plants. The third and largest nuclear power plant in Pakistan, with a capacity of about 1,300 MW, is located in the northwest, in the province Punjab.

Hydropower prevails in terms of installed renewable energy capacities (about 78%), followed by wind energy (about 10%). The share of solar photovoltaics in 2022 was less than 9% and bioenergy accounted for about 3,1%. At the same time, the volume of electric power generation by hydroelectric power plants in 2021 was about 83% of the total of all renewable sources. The majority of wind power plants are concentrated in the southern part of the country. Some of them have a capacity of more than 100 MW.

Figure 7. Renewable energy in Pakistan (click on the map to view a PDF version)
As already mentioned, Pakistan has tremendous potential for renewable energy production, and in recent years several policies have been adopted to realize this potential. Thus, according to the government's Alternative and Renewable Energy Policy 2019, the country's goal is to increase solar and wind power to 30% of Pakistan's total electric capacity by 2030 [15]. In addition, the Indicative Generation Capacity Expansion Plan 2021-2030, aimed at large-scale hydropower development, calls for increasing hydropower capacity to 14,353 MW by 2025, and to 23,035 MW by 2030, which would account for 45% of total electricity generation capacity from all resources [16].
Education and Innovation
The following chart shows Pakistan's positions in terms of education and innovation:
Sources: 1. The Global Innovation Index 2021, Rankings / Knowledge / World Intellectual Property Organization / Cornell University, INSEAD, and WIPO (2021): Energizing the World with Innovation. Ithaca, Fontainebleau, and Geneva *132 2. Patent Grants 2011-2020, resident & abroad / Statistical country profiles / World Intellectual Property Organization *185 3.Patents in Force 2020 / Statistical country profiles / World Intellectual Property Organization *109 4. QS World University Rankings 2022 *97 5. SCImago Country Rankings (1996-2020) / Country rankings / SCImago, (n.d.). SIR-SCImago Journal & Country Rank [Portal]. Retrieved 17 Nov 2021 *240 6. Internet users in 2018 / The World Factbook / Central Intelligence Agency *229 7. Internet users in 2018 (% Population) / The World Factbook / Central Intelligence Agency *229 8. Government expenditure on education, total (% of GDP), 2019 / United Nations Educational, Scientific, and Cultural Organization (UNESCO) Institute for Statistics. License: CCBY-4.0 / Data as of September 2021*177 9. Research and development expenditure (% of GDP), 2018 / UNESCO Institute for Statistics. License: CCBY-4.0 / Data *119 10. Scientific and technical journal articles, 2018 / National Science Foundation, Science and Engineering Indicators. License: CCBY-4.0 / Data *197 * Total number of countries participating in ranking | ||
| Figure 8. The indices of education and innovation in Pakistan |
Six out of ten indexes describing Pakistan’s positioning in various international ranking lists related to education and innovation are below the world average. Because of its large population, Pakistan is one of the world leaders in the absolute number of Internet users, but if you look at the number of users in proportion to the entire population of the country, Pakistan is among the outsiders in this regard. Pakistan has the highest rankings in SCImago Country Rankings and Scientific and Technical Journal articles.
Ecology and Environment Protection
Indicators related to environmental issues are presented in the following diagram:
| Sources: 1. CO2 total emission by countries 2020 / European Commission / Joint Research Centre (JRC) / Emission Database for Global Atmospheric Research (EDGAR)*208 2. CO2 per capita emission 2020/European Commission/Joint Research Centre (JRC) / Emission Database for Global Atmospheric Research (EDGAR) *208 3. Forest area 2020 (% of land area) / The Global Forest Resources Assessment 2020 / Food and Agriculture Organization of the United Nations *234 4. Forest area change 2010-2020 (1000 ha/year) / The Global Forest Resources Assessment 2020 / Food and Agriculture Organization of the United Nations *234 5. The Environmental Performance Index (EPI) 2020 / Rankings / Yale Center for Environmental Law & Policy / Yale University *180 6. Annual freshwater withdrawals (m3 per capita), 2017 *179 Annual freshwater withdrawals, total (billion m3), 2017 – Food and Agriculture Organization, AQUASTAT data. /License: CC BY-4.0; Population – United Nations, Department of Economic and Social Affairs, Population Division (2019). World Population Prospects 2019, custom data acquired via website. Retrieved 15 November 2021 7. The National Footprint Accounts 2017 (Biocapacity Credit / Deficit) / Global Footprint Network *188 8. Methane emissions (kt of CO2 equivalent), 2018 / Data for up to 1990 are sourced from Carbon Dioxide Information Analysis Center, Environmental Sciences Division, Oak Ridge National Laboratory, Tennessee, United States. Data from 1990 are CAIT data: Climate Watch. 2020. GHG Emissions. Washington, DC: World Resources Institute. Available at: License : Attribution-NonCommercial 4.0 International (CC BY-NC 4.0) *191 9. The Climate Change Performance Index (CCPI) 2022 / Overall Results / Jan Burck, Thea Uhlich, Christoph Bals, Niklas Höhne, Leonardo Nascimento / Germanwatch, NewClimate Institute & Climate Action Network *60 * Total number of countries participating in ranking | ||
| Figure 9. Environmental Indices of Pakistan |
Pakistan belongs to the group of countries with the largest amount of carbon dioxide and methane emissions. These facts, as well as the country's small forest area, are responsible for its low ranking in the Environmental Performance Index (EPI). Pakistan is not included in the Climate Change Performance Index 2022. Compared to other countries, annual freshwater withdrawals in Pakistan are quite high. In general, the environmental situation in the country requires significant improvement.
References
[1] List of sovereign states and dependencies by area / Wikipedia / https://en.wikipedia.org/wiki/List_of_sovereign_states_and_dependencies_by_area
[2] List of countries and dependencies by population density / Wikipedia / https://en.wikipedia.org/wiki/List_of_countries_and_dependencies_by_population_density
[3] Pakistan / The-world-factbook / Library / Central Intelligence Agency / https://www.cia.gov/
[4] GDP, PPP (constant 2011 international $) / World Bank, International Comparison Program database. License: CC BY-4.0 / Data / The World Bank / http://www.worldbank.org/
[5] GDP per capita, PPP (current international $)/ World Bank, International Comparison Program database. License: CC BY-4.0 / Data / The World Bank / http://www.worldbank.org/
[6] International Energy Statistic / Geography / Pakistan / U.S. Energy Information Administration (February, 2023) / http://www.eia.gov/
[7] World Shale Resource Assessments / U.S. Energy Information Administration (September 24, 2015) / https://www.eia.gov/
[8] Potential for the utilization of coal methane / aenert.com/technologies/fossil-fuel/unconventional-gas/coal-seam-methane/
[9] BP Statistical Review of World Energy 2021 - 2022 (PDF) / BP / https://www.bp.com/
[10] Solar resource data obtained from the Global Solar Atlas, owned by the World Bank Group and provided by Solargis / Global Solar Atlas / http://globalsolaratlas.info/
[11] Wind Map / Global Wind Atlas 2.0, a free, web-based application developed, owned and operated by the Technical University of Denmark (DTU) in partnership with the World Bank Group, utilizing data provided by Vortex, with funding provided by the Energy Sector Management Assistance Program (ESMAP). For additional information: https://globalwindatlas.info
[12] Agricultural land (% of land area) / Food and Agriculture Organization, electronic files and web site. License: CC BY-4.0 / Data / The World Bank / http://www.worldbank.org
[13] Forest area (% of land area) /Food and Agriculture Organization, electronic files and web site. License: CC BY-4.0 / Data / The World Bank / http://www.worldbank.org
[14] World Bank What a Waste / Data / The World Bank / http://www.worldbank.org
[15] Alternative and Renewable Energy Policy 2019 / Alternative Energy Development Board / www.aedb.org/images/Draft_ARE_Policy_2019_-_Version_2_July_21_2019.pdf
[16] Indicative Generation Capacity Expansion Plan / National Electric Power Regulatory Authority / nepra.org.pk/Admission%20Notices/2021/06%20June/IGCEP%202021.pdf
The sources of charts and curves are specified under the images.
For more information about the energy industry in Pakistan see here