
Contents
General State of the Economy
Austria, officially the Austrian Republic, is located in Central Europe. Its capital city is Vienna. The country is bordered by the Czech Republic (to the north), Slovakia (to the north-east), Germany (to the northwest), Hungary (to the east), Liechtenstein and Switzerland (to the west), and Slovenia and Italy (to the south). As of 2022, the country is home to around 8,9 million people. It is 114th in the world in terms of land area, ranking 106th in the world in population density out of the 247 countries surveyed [1,2,3].
| Sources: 1. GDP (purchasing power parity), 2020 est. / The World Factbook/Library/Central Intelligence Agency *228 2. GDP - per capita (PPP), 2020 / The World Factbook/Library/Central Intelligence Agency *229 3. Inflation rate (consumer prices), 2019 est. / The World Factbook/Library/Central Intelligence Agency *228 4. Charges for the use of intellectual property, receipts (BoP, current US$), 2020 / International Monetary Fund, Balance of Payments Statistics Yearbook, and data files. / License: CC BY-4.0 *88 5. The Global Competitiveness Index 2019 / Rankings / Reports / World Economic Forum *141 6. High-technology exports (current US$) 2019-2020 / United Nations, Comtrade database through the WITS platform / License: CCBY-4.0 / Data *134 7. 2021 Index of Economic Freedom / International Economies / The Heritage Foundation *178 8. Reserves of foreign exchange and gold, 2017 est. / The World Factbook / Library / Central Intelligence Agency *195 9. Annual average GDP growth in %, for the last 10 years (2011-2020) / World Bank national accounts data, and OECD National Accounts data files / License: CC BY-4.0 *206 10. Public debt (% of GDP), 2017 est. / The World Factbook / Library / Central Intelligence Agency (from smallest to largest) *210 * Total number of countries participating in ranking Figure 1. Economic Indices of Austria |
Austria is a federal parliamentary republic with its administrative map divided into 9 states. The official language is German [3]. Austria can be categorized as a developed country, placing above many others in terms of key indicators and this is reflected in the comparative diagram of various economic indices – Figure 1. The service sector, the industrial sector, and the agricultural sector form the base of the economy [3]. By almost every indicator in the presented diagram, Austria places in the top 25% of the leading countries in the world included in the rating. Due to a developed market economy, a high level of education in the population, and a stable financial system, indicators such as the level of GDP, and the level of economic freedom, the current sovereign rating of Standard & Poor's are much higher than the global average. From the early 1990s to 2008 the country experienced sustained GDP growth at purchasing power parity, both in general and per capita [4,5]. In 2008 it fell slightly, but then growth resumed. GDP at purchasing power parity increased from $441 billion (45th in the world) in 2017 to $463 in 2020 (43rd in the world) [3]. GDP at purchasing power parity per capita is somewhat higher (31st in 2016). The dynamics of this indicator is also positive: from $ 50,000 in 2017 to 51,900 in 2020 [3]. The inflation rate fell from 2.2% in 2017 to 1.5% in 2019. According to this indicator the country is 111th in the world [3]. In terms of the market value of publicly traded shares in 2016, the country was 40th in the world. According to The Global Competitiveness Report 2019, presented by the World Economic Forum, Austria is 21st out of a total of 141 countries. This rating reflects the effectiveness of the use of the country’s own resources for sustainable development. In addition to a number of economic indicators this index also takes into account such variables as education, health, level of innovation, etc. In terms of high-technology exports in the year 2019-2020 (from an estimated total of 134 countries), Austria was 20th. According to the Index of Economic Freedom 2021, which takes into account business freedom, freedom from government intervention, protection of property, and freedom from corruption, Austria was 25th out of 178 countries. In terms of reserves of foreign exchange and gold, Austria was 57th in 2017. According to the indicator for the average GDP growth in percentage over the last 10 years, in 2020 the country was 161st out of 206 countries. In terms of public debt, calculated as a percentage of the country's GDP, Austria was ranked 37th out of 210 countries considered in 2017.
Energy Resources
Austria does not have significant reserves of fossil resources (Table 1). According to [3] in terms of oil and gas reserves the country places low on the global comparative list (78th and 84th, respectively). According to 2021 data, in terms of tons of oil equivalent, proven natural gas reserves amounted to 48.8%, with oil at 51.4% (Fig. 5). Austria has small proven oil reserves, which were estimated at 35.2 million barrels at the beginning of 2021 [3].
Table 1. Fossil energy resources of Austria
| Resource /Explanations | Crude oil | Natural gas | Coal | Shale Gas | Tight Oil | Oil Shale |
|---|---|---|---|---|---|---|
| Value | 35.2 | 5.04 | - | - | - | 8 |
| Unit | billion bbl | billion cubic meter | - | - | - | million bbl |
| Year | 2021 | 2021 | - | - | - | 2008 |
| Source | [3] | [3] | - | - | - | [7] |
According to Das Bundesministerium für Wissenschaft, Forschung und Wirtschaft (The Federal Ministry for Science, Research and Business) as of December 2014, proven oil reserves, including Liquefied petroleum gas (LPG) were 7.3 million tons [6]. The country also has small reserves of kerogen oil, which at the end of 2008 were estimated at 8 million barrels [7]. Proved natural gas reserves, according to [3], were estimated at 5.04 billion m3 at the beginning of 2021.
According to The Geological Research Centre (die Geologische Bundesanstalt), the proven reserves of natural gas at the end of 2014 were 11.1 billion m3, which is 0.7 billion m3 less than the 2013 figure, and at current production levels they can last for 9 years [6].
Austria does not have a significant potential for the development of wind and solar energy. A selection of basic indicators of this type of resource is presented in Table 2.
The main and most valuable resource of renewable energy in Austria is hydro resources. At the end of 2020, there were 3,068 hydropower plants in operation with a total installed capacity of about 14.6 GW [16]. The gross theoretical hydropotential of the country is 150 000 GWh/year; technically exploitable capability - 75 000 GWh/year; economically exploitable capability – 56 100 GWh/year [8]. The latter figure is one of the highest in Europe, and comparable to that of Nepal (140 160 GWh/year) [8].
The level of global horizontal irradiation for the majority of the country is low – <3.5 kWh/m2/day [9]. The maximum level of solar radiation is found in the south-western part of the country in the regions of Carinthia and Tyrol – over 3.5 kWh/m2/day. The distribution of wind resources is as follows: for the majority of the country the wind speed is between 4.0-6.0 m/s; the maximum speed of over 7.0 m/s can be registered in the Alps areas[10].
Table 2. Renewable energy resources of Austria
| Resource/ Explanations | Solar Potential (GHI)* | Wind Potential (50 м)* | Hydro energy Potential** | Bio Potential (agricultural area) | Bio Potential (forest area) | Geothermal Potenial | Municipal Solid Waste |
|---|---|---|---|---|---|---|---|
| Value | <3.5 | 4.0-6.0 | 56 100 | 38.4 | 47.2 | 41 | 834 |
| Unit | kWh/m2/day | m/s | GWh/year | % of land area | % of land area | MW | kg per capita |
| Year | 2018 | 2018 | 2015 | 2018 | 2018 | 2008 | 2020 |
| Source | [9] | [10] | [8] | [11] | [12] | [13] | [14] |
*for most of the territory of the country
**economically exploitable potential
In 2016, 38.4% of Austria was covered by agricultural land, and 47.2% was forested [11,12]. This is a significant bio resource that could play an important role in the production of various types of energy. Austria also has a small potential for geothermal energy, estimated by Enex and Gezsir Green Energy in 2008 at 41 MW [13]. The level of generation of municipal waste in Austria (834 kg per person) is lower than in other highly developed European countries (Germany – 628, Switzerland – 706 kg per person) [14]. Municipal waste is a valuable raw material for recycling or energy production, which is actively used in Austria, however long-term decomposing substances can significantly pollute the environment.
Energy Balance
According to ВР-2022, primary energy consumption in Austria in 2021 amounted to 1,48 exajoules and was dominated by oil – 33.1%, followed by hydropower – 27%, gas – 21.6%, coal – 7.4%, and other renewable resources – 10.1% [15]. According to the Report of Bundesministerium für Klimaschutz, Umwelt, Energie, Mobilität, Innovation und Technologie, the share of oil and oil products in the gross domestic energy consumption in 2020 was 34.1%, for gas – 22.7%, coal – 7.6%, and for renewable energy sources, including hydropower and imports – 35.6% [16]. The volume of coal consumption in Austria fell by about 40% between 2005 and 2020, and in 2020 it did not exceed the level of 102 PJ [16]. The import of coal in 2020 was 98,8 PJ [16].
Source: U.S. Energy Information Administration (Dec 2021) / www.eia.gov
Figure 2. The Production and consumption of fossil fuels in Austria (coal – left, gas – in the center, oil – right)
The production of oil in Austria remained basically unchanged from 2001 to 2020 (Fig.2.) In 2020, this figure was 23,9 PJ [16]. Source [17] presents the following figures – 25 thousand barrels/day in 2021. In 2021 oil production was at the level of 20.1 thousand barrels/day [3]. Oil consumption has gradually decreased and by 2020 the gross domestic consumption of oil and oil products was 460 PJ [16]. According to the BP Statistical Review of World Energy, oil consumption in 2021 was 236 thousand barrels/day [15]. Crude oil imports to Austria in 2020 amounted to around 566 Pj [16]. According to [3] in 2018, Austria imported about 168.3 thousand barrels. Production of natural gas has decreased since 2010 (Fig. 2), and in 2020 amounted to 26,4 Pj [16]. In 2019, according to [3], gas production was 0.924 Bcm.
Source: U.S. Energy Information Administration (Dec 2021) / www.eia.gov
Figure 3. Electricity production in Austria
Gas consumption in 2020 was 194 PJ [16]. According to other sources, in 2021 gas consumption was at the level of 9 Bcm [15]. The Central Intelligence Agency estimated the import of natural gas in 2019 to be at 14.11 Bcm [3]. Historically, Austria has had a high share of hydro resources in electricity production (Fig. 3). Electricity production in Austria in 2020 was 70.9 TWh, dominated by hydropower - 63.9%; the share of fossil resources was 17.7%, while renewable energy sources accounted for 18.4% (Fig. 6).
As previously mentioned, Austria does not have significant reserves of fossil resources, and consequently the first six indexes are extremely low. The scarcity of fossil resources in Austria is critical and the required amount of electrical power cannot be produced from them, therefore Austria is a major importer of fossil fuels. Austria’s position in the comparative diagram of energy index is shown in Figure 4.
| Sources: 1. Crude oil proved reserves, 2021 / International Energy Statistic/Geography / U.S. Energy Information Administration (Nov 2021)*98 2. Natural gas proved reserves 2021 / International Energy Statistic / Geography / U.S. Energy Information Administration (Nov 2021) *99 3. Total recoverable coal reserves 2019 / International Energy Statistic / Geography / U.S. Energy Information Administration (Nov 2021) *81 4. Combination production-consumption for Crude oil 2018 / International Energy Statistic / Geography / U.S. Energy Information Administration (Nov 2021) *219 5. Combination production-consumption for Natural gas 2019 / International Energy Statistic / Geography / U.S. Energy Information Administration (Nov 2021) *123 6. Combination production-consumption for Coal 2019 / International Energy Statistic / Geography / U.S. Energy Information Administration (Nov 2021) *128 7. Electricity – from other renewable sources (% of total installed capacity), 2017 est. / The World Factbook / Library / Central Intelligence Agency *170 8. GDP per unit of energy use (PPP per unit of oil equivalent), 2020 *66 Primary energy consumption - BP Statistical Review of World Energy 2021/BP;GDP (purchasing power parity) - The World Factbook/Library/Central Intelligence Agency 9. Energy use (primary energy use of oil equivalent per capita) 2020 *127 Primary energy consumption – BP Statistical Review of World Energy 2021; Population - United Nations, Department of Economic and Social Affairs, Population Division (2019). World Population Prospects 2019, custom data acquired via website. Retrieved 15 November 2021*66 10. The Global Energy Architecture Performance Index Report (EAPI) 2017 / Rankings / Reports / World Economic Forum 11. Electric power consumption (kWh per capita), 2016 *217 Electricity Consumption - The World Factbook / Library / Central Intelligence Agency; Population - United Nations, Department of Economic and Social Affairs, Population Division (2019). World Population Prospects 2019, custom data acquired via website. Retrieved 15 November 2021 12. Combination of electricity production-consumption (kWh)/The World Factbook/Library/Central Intelligence Agency *216 * Total number of countries participating in ranking Figure 4. Energy indices of Austria |
However, other indices look more positive. In terms of the share of electricity production from renewable energy sources (excluding hydropower), Austria ranks 16th out of 170 countries selected for consideration. Austria is ranked 6th in the EAPI of 2017 (Energy Architecture Performance Index), which is based principally on the level of economic growth, environmental safety, and energy independence of the country, including access to energy. Over the last 8 years the country has gained 2 positions in the rating.
In 2020 Austria was 18th out of 66 countries ranked by the ratio of GDP per unit of energy use, while in terms of energy consumption per capita the country is 22nd in the world, ahead of Germany and France. In terms of electricity consumption per capita, the country is 29th in the world, however, for the indicator of combination of electricity production-consumption, Austria is 205th in the ranked list of 216 countries.
Energy Infrastructure
A territorial map showing the distribution of the largest infrastructure projects of the fossil fuel sector in Austria is shown in Figure 5. As mentioned above, the proven reserves of natural gas account for 48.6% of the total energy potential of the country's mineral resources, with crude oil reserves accounting for 51.4%. The main oil and gas fields are located near the capital and in the Linz region, in the north-west of the country (Fig. 5). There is one oil refinery in Austria, managed by OMV, located in Schwechat, near Vienna. It has an installed capacity of 192,000 barrels/day. Nearby there is the main oil storage facility – Lobau, with a capacity of 1 600 000 m3 [18].
In Austria, there are two types of oil pipelines with a total length of 663 km, providing oil supplies to the refinery in Schwechat: local pipelines from local deposits; and the international “Transalpine Pipeline” that originates in Trieste, Italy. In the past, attempts were made to build a pipeline from Bratislava to Schwechat to ensure direct supplies of oil from Russia. However, the project has so far remained on paper. There is also an oil pipeline with a length of 157 km for the transportation of petroleum products (Fig. 5).
Figure 5. Basic infrastructural facilities of the fossil fuel sector in Austria
The largest gas fields are situated in the basins of Vienna and Molasse [18]. The main gas storage facility is Schonkirchen/Reyersdorf, with a capacity of 1 589 million m3 [18].
Gas is transported through pipelines with a total length of 4 736 km. (Fig. 5). Austria has a large number of gas storage facilities that provide Austria and other European countries with natural gas coming from Russia through Slovakia. The potential of the Vienna Basin-Mikulov shale gas field was estimated at 240 Tcf in 2010 [19]. However, the extraction of shale gas in the country is prohibited.
Electricity production in Austria in 2020 was 70.9 TWh, dominated by hydropower - 63.9%, the share of fossil resources was 17.7%, while renewable energy sources accounted for 18.4% (Fig. 6).
Fossil fuel power plants provide less than 20% of the total electricity production, these plants include two coal-fired power plants with a capacity of more than 100 MW, several gas-fired power plants, of which 6 have a capacity of more than 100 MW, and 4 combined cycle stations over 100 MW (Fig.6).
The largest coal-fired plant is Dürnrohr Coal-fired Power Plant, with an installed capacity estimated at 757 MW [20]. The country's largest gas station is Mellach Natural Gas-fired Power Plant with an installed capacity of 832 MW, and the largest combined cycle power plant is the Simmering Combined Power Plant, with an installed capacity of more than 1,245 MW [21,22]. In 2020, hydropower generated around 45.34 TWh (Fig. 6). The country's largest hydroelectric power station is Altenwörth, with an installed capacity of 328 MW [23], and the installed capacity of Malta Hauptstufe Hydro Pumped Storage Station is 730 MW [24]. Following a national referendum, there are no nuclear power plants in the country. Moreover, Austria actively opposes the existence of nuclear programs in other EU countries.
Figure 6. Electricity production in Austria
In Figure 7, you can see the main facilities of the Austrian infrastructure for the production of energy from renewable sources. As noted above, excluding hydropower, renewable energy in Austria does not play a major role in electricity generation, but nevertheless has a significant presence in the market. The total production of electricity from renewable sources in 2020, excluding hydropower, was 13.03 TWh (Fig. 7). 12 large wind farms with a capacity of more than 45 MW each are located in the north-east of the country, around the capital, where there are areas of high wind activity. According to the Austrian Wind Energy Association, Austria has 1 307 wind farms with a total capacity of 3,300 megawatts as of 2022. The wind turbines installed in Austria in 2021 can generate 8.5 billion kWh of electricity annually that is the electricity consumption of around 2.5 million households [25]. The largest wind park is in Andau, with an installed capacity of 237 MW [26].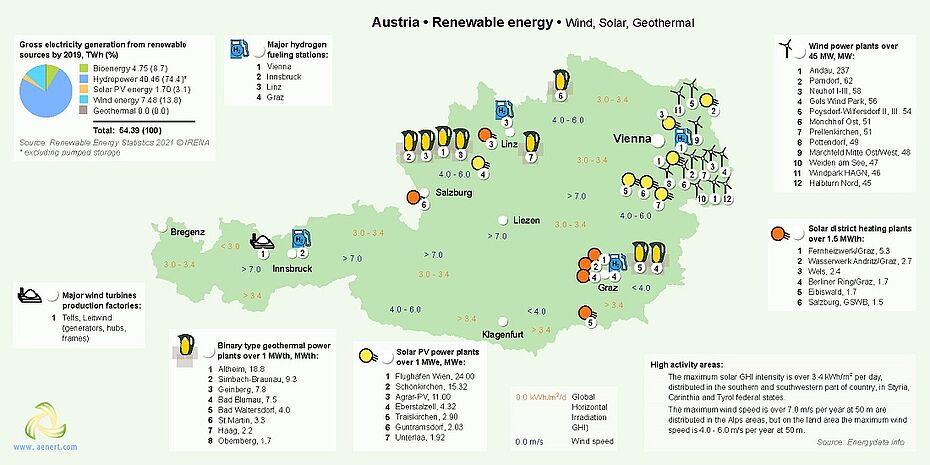
Figure 7. Renewable energy in Austria: wind, solar and geothermal
As mentioned previously, the level of direct horizontal solar irradiation in some regions of the country can reach 3.4 kWh/m2, which is a low but sufficient resource for the production of energy through photovoltaics [9]. Austria's largest photovoltaic plant is located at Vienna-Schwechat Airport, where 55,000 solar panels on 24 hectares provide an electricity output of 24 megawatts peak. However, the main photovoltaic capacities are still located in private households.
The geothermal energy potential in Austria can reach 41 MW [13], which is actively used by small geothermal power plants, the largest of which is the Altheim Geothermal Power Plant, with a capacity of 18.8 MWh [28].
Figure 8 shows the main bio-energy facilities in Austria for energy production.
Figure 8. Renewable energy in Austria: Bio resources
Bioenergy has also been developing quite quickly in Austria, and in 2019 biomass generated around 4.75 TWh (Fig. 7). Nationwide, there are enterprises for processing biomass and municipal waste, producing biogas, biodiesel, bioethanol, pellets and landfill gas. Wien Energie manages the largest biomass processing plant – Simmering Biomass Plant, with an installed capacity of more than 35 MW [29]. Rautenweg landfill-gas-to-energy Plant generates about 7 MW of electricity [30]. Agrana produces about 240 000 m3 of bioethanol annually at the country's largest enterprise – Pischelsdorf [31]. The main Austrian companies in the field of energy are: for Biodiesel – Vienna, BDI BioDiesel Plant, which produces approximately 140,000 tons annually [32]; for biogas – Lower Austria with an installed capacity of 644 GW/h [33]; biomass gasification – Oberwart Biomass Gasification Plant with a capacity of 9 MWth [34]; pellet production – Kundl, Pfeifer Wood Pellet Plant, which produces 150,000 tons annually [35]. The leader in the generation of electricity from municipal waste is Dürnrohr (Zwentendorf), with an installed capacity of 81 tons per hour [36]. The model for the development of regional energy from renewable sources is the small town of Güssing in the east of Austria, which is now world famous. Before becoming the centre for the production of "green" excess energy, Güssing was one of the most disadvantaged regions in Austria. It has now attracted many foreign energy-consuming enterprises to the region and created new jobs. Several innovative technologies have been developed in Güssing utilising local raw materials, including the production of alternative fuels, biogas, electricity, and efficient energy consumption. In Güssing a well-known technology for synthetic gas production through biomass gasification and the Fischer-Tropsch method are used. Energy development in Austria has several main directions: the construction of gas pipelines, constructions of new power lines, gas compressor stations, in conjunction with increasing the capacity of renewable energy (Fig. 9). For example, in the past few years, the Austrian energy company OMV has negotiated several projects for the construction of gas pipelines across the country, but none of them, according to 2021 data, received actual implementation. The 290 km long Tauern Gas Pipeline was intended to pass through the territory of Austria, providing gas supplies from Italy to Germany [37]. In April 2010, OMV also signed the Framework Agreement for Cooperation with the Russian company Gazprom on the construction of the South Stream gas pipeline, but the project has remained undeveloped [38]. A similar situation occurred around the construction of the Nabucco Gas Pipeline, which was supposed to diversify imports of gas, and reduce energy dependency on Russia. The pipeline was to originate in Erzurum, Turkey and end in Baumgarten an der March, Austria [39]. The implementation of the Nord Stream project has also been halted.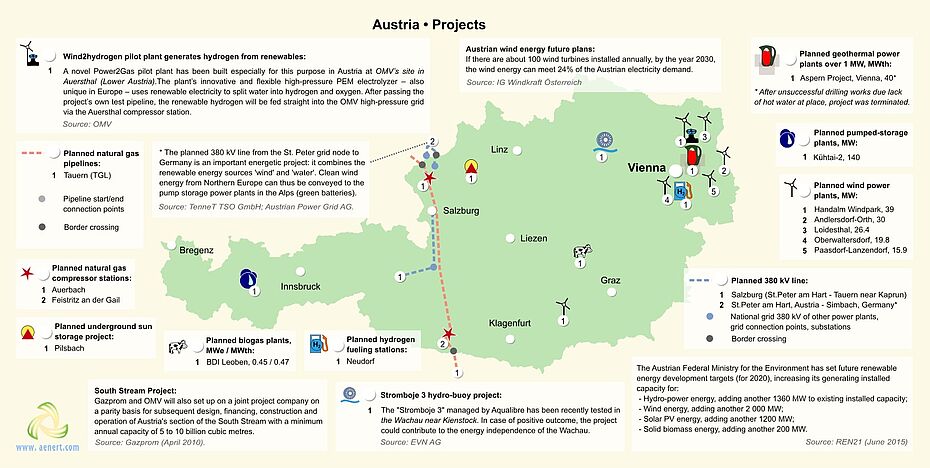
Figure 9. Energy development in Austria: projects
The construction of the 380-kV-Salzburg-line project, which closes the gap in the ring in the west of Austria, is one the most important stages of the large 380 kV transmission ring project, linking the main industrial and densely populated areas of Austria. Another important infrastructure project is the construction of a new “380 kV line St. Peter – Staatsgrenze/federal border (Simbach)”. The aim of this project is to integrate various sources of renewable energy, particularly with intermittent work cycle (wind power) and continuous (hydropower), into a single international network [40]. Austria also plans to build new gas compressor stations – Auerbach Natural Gas Compressor Station and Feistritz an der Gail Natural Gas Compressor Station [41]. In the field of renewable energy development, according to Renewable Energy Projects in Austria [42], there are about 60 projects, including the construction of five large wind farms with a capacity of more than 15 MW [43] and the construction of a pumped hydroelectric storage with a capacity of 140 MW [44]. If the country were to install around 100 wind turbines annually, by 2030 the share of wind power in the production of electricity could reach 24% [45].
The federal government's goal is to achieve Austria's climate neutrality by 2040. To fulfill this goal, the share of renewable energy is to increase to almost 100 percent by 2040 [16]. Thus, Austria is building a new pumped hydroelectric storage plant – Kühtai 2 Hydro Pumped Storage Station, which will have a capacity of 140 MW in Tyrol, and its commercial operation is scheduled to begin by the end of 2026 [47]; a biogas power plant BDiLeoben, with a capacity of 0.47 MWh in Styria [48]; and an underground storage facility for natural gas production, based on the local innovative technology of energy conversion from renewable sources in combination with microbiological processes in Pilsbach by RAG [49].
It is also worth noting the construction of hydrogen fuelling stations in Austria – there are five functioning stations in Vienna, Innsbruck, Linz, Graz, and in Wiener Neudorf [50].
The Austrian energy company OMV is making efforts to develop modern "wind to hydrogen" technologies based on the Power2Gas pilot plant in Auersthal (Lower Austria). It is understood that after a series of tests, hydrogen obtained from electricity from renewable sources will be fed into the OMV high-pressure gas pipeline through the Auersthal compressor station. It is planned to only use renewable energy sources to produce such hydrogen, primarily from wind farms. As such, CO2 and other harmful pollutants will not be produced during the production process and usage [51].
Education and Innovation
The set of indices reflecting the position of Austria relative to other countries in the field of education and innovation can be seen in Figure 10. Despite the indirect relation to energy, these indices are reflective of the future of its development, which is impossible without innovative technologies and scientific research. According to the diagram presented, Austria is one of the world's leading countries by these indicators.
| Sources: 1. The Global Innovation Index 2021, Rankings / Knowledge / World Intellectual Property Organization / Cornell University, INSEAD, and WIPO (2021): Energizing the World with Innovation. Ithaca, Fontainebleau, and Geneva *132 2. Patent Grants 2011-2020, resident & abroad / Statistical country profiles / World Intellectual Property Organization *185 3.Patents in Force 2020 / Statistical country profiles / World Intellectual Property Organization *109 4. QS World University Rankings 2022 *97 5. SCImago Country Rankings (1996-2020) / Country rankings / SCImago, (n.d.). SIR-SCImago Journal & Country Rank [Portal]. Retrieved 17 Nov 2021 *240 6. Internet users in 2018 / The World Factbook / Central Intelligence Agency *229 7. Internet users in 2018 (% Population) / The World Factbook / Central Intelligence Agency *229 8. Government expenditure on education, total (% of GDP), 2019 / United Nations Educational, Scientific, and Cultural Organization (UNESCO) Institute for Statistics. License: CCBY-4.0 / Data as of September 2021*177 9. Research and development expenditure (% of GDP), 2018 / UNESCO Institute for Statistics. License: CCBY-4.0 / Data *119 10. Scientific and technical journal articles, 2018 / National Science Foundation, Science and Engineering Indicators. License: CCBY-4.0 / Data *197 * Total number of countries participating in ranking Figure 10. The indices of education and innovation in Austria |
According to the Global Innovation Index 2021, Austria is ranked 18th out of 132 countries (see diagram for links). According to the number of patents granted to Austrian residents, both inside the country and abroad, the country ranks 14th in the world, behind a number of European countries, but nevertheless higher than the world average. Similarly, by the number of patents in force, the country ranks highly – 17th place, indicating the country's favourable conditions for innovation.
The country is also among the leaders in terms of its number of Internet users. A significant level of government expenditure on education (as a percentage of the country's GDP), allowed 8 Austrian universities to enter the QS University Rating. Austria is well positioned when considering the number of publications of specialists in scientific and technological journals and patent activities. Austria is 24th out of 240 participating countries in the Scimago ranking, and in Scientific and Journal Activities it is ranked 32nd out of 197 countries. About 13 educational universities in Austria, including Vienna University of Technology, Graz University of Technology, and the University of Leoben train specialists in various fields of energy, including Chemical Engineering, Environmmental Engineering, Mining Engineering, Environmental Engineering, etc. In the field of synthetic fuel production, extraction and processing of unconventional oil, the leading Austrian patent holders are Siemens VAI Metals Technologies GmbH, SynCraft Engineering GmbH, Rotec Engineering GmbH & CO KG. Research and development in this field is carried out by Vienna University of Technology and Bioenergy 2020+ GmbH.
The leading patent holders in the field of bioenergy are Andritz Technology and Asset Management GmbH, Vienna University of Technology, ENBASYS GMBH, Evonik Fibres GmbH, and Rep Renewables Energy Products GmbH. Graz University of Technology and Vienna University of Technology are conducting research in this field. Another area where Austrian companies actively patent their technology is in the production of hydrocarbons from low permeability reservoirs. The Centre for Abrasives and Refractories Research & Development C.A.R.R.D. GmbH, Imerys Services S.A.S have the highest number of patents in the field, and Montan Universität Leoben conducts research in this area.
A large number of Austrian companies patent technical solutions in the field of energy production from renewable sources. In the field of solar energy Isovolta AG, Heliovis AG, Isovoltaic AG, Sun Master Engergiesysteme GmbH should be mentioned. Leading research organizations in this field are the International Institute for Applied Systems Analysis and S.O.L.I.D. International GMbH.
Miba Gleitlager Gmbh, AMSC Windtec Gmbh, AMSC Austria Gmbh, Set Sustainable Energy Technologies are prominent in the number of patents in the field of wind power.
Ecology and Environment Protection
A diagram of environmental indices is shown in Figure 11.
Figure 11 shows the indices that have an indirect effect on the energy sector, but which in many respects predetermine its future.
| Sources: 1. CO2 total emission by countries 2020 / European Commission / Joint Research Centre (JRC) / Emission Database for Global Atmospheric Research (EDGAR)*208 2. CO2 per capita emission 2020/European Commission/Joint Research Centre (JRC) / Emission Database for Global Atmospheric Research (EDGAR) *208 3. Forest area 2020 (% of land area) / The Global Forest Resources Assessment 2020 / Food and Agriculture Organization of the United Nations *234 4. Forest area change 2010-2020 (1000 ha/year) / The Global Forest Resources Assessment 2020 / Food and Agriculture Organization of the United Nations *234 5. The Environmental Performance Index (EPI) 2020 / Rankings / Yale Center for Environmental Law & Policy / Yale University *180 6. Annual freshwater withdrawals (m3 per capita), 2017 *179 Annual freshwater withdrawals, total (billion m3), 2017 – Food and Agriculture Organization, AQUASTAT data. /License: CC BY-4.0; Population – United Nations, Department of Economic and Social Affairs, Population Division (2019). World Population Prospects 2019, custom data acquired via website. Retrieved 15 November 2021 7. The National Footprint Accounts 2017 (Biocapacity Credit / Deficit) / Global Footprint Network *188 8. Methane emissions (kt of CO2 equivalent), 2018 / Data for up to 1990 are sourced from Carbon Dioxide Information Analysis Center, Environmental Sciences Division, Oak Ridge National Laboratory, Tennessee, United States. Data from 1990 are CAIT data: Climate Watch. 2020. GHG Emissions. Washington, DC: World Resources Institute. Available at: License : Attribution-NonCommercial 4.0 International (CC BY-NC 4.0) *191 9. The Climate Change Performance Index (CCPI) 2022 / Overall Results / Jan Burck, Thea Uhlich, Christoph Bals, Niklas Höhne, Leonardo Nascimento / Germanwatch, NewClimate Institute & Climate Action Network *60 * Total number of countries participating in ranking Figure 11. Environmental Indices of Austria |
Austria demonstrates relatively high levels of CO2 emissions both in general and per capita. The situation is aggravated by the fact that Austria is regarded as one of the 60 countries responsible for more than 90% of global CO2 emissions related to energy in the Climate Change Performance Index 2022 (CCPI). In terms of forest area as a percentage of the country, Austria is 63rd in the world, and demonstrates a positive trend (43rd in the world). The preservation of this bio resource is important to the Austrian government. The situation is brightened by a relatively high valuation of Austria in the Environmental Performance Index rankings (EPI) 2020, which focuses primarily on assessing the environmental performance of national governments. Here, the country is 6th, and shows a positive trend.
Austria also belongs to a group of countries with very high levels of methane emissions. Finally, according to the Ecological Footprint Atlas rating, Austria is among the number of ecological debtors.
References
[1] List of sovereign states and dependencies by area / Wikipedia / en.wikipedia.org/wiki/List_of_sovereign_states_and_dependencies_by_area
[2] List of countries and dependencies by population density / Wikipedia / en.wikipedia.org/wiki/List_of_countries_and_dependencies_by_population_density
[3] Austria/ The world factbook / Library / Central Intelligence Agency / www.cia.gov
[4] GDP, PPP (constant 2011 international $) / World Bank, International Comparison Program database. License: CC BY-4.0 / Data / The World Bank / http://www.worldbank.org/
[5] GDP per capita, PPP (current international $)/ World Bank, International Comparison Program database. License: CC BY-4.0 / Data / The World Bank / http://www.worldbank.org/
[6] Energiestatus 2016 (PDF) / Das Bundesministerium für Wissenschaft, Forschung und Wirtschaft / www.bmwfw.gv.at
[7] 2010 Survey of Energy Resources / 2012 / Publications / World Energy Council / www.worldenergy.org
[8] World Energy Resources: Hydro World Energy Council / 2013 / Publications / World Energy Council / www.worldenergy.org
[9] Solar resource data obtained from the Global Solar Atlas, owned by the World Bank Group and provided by Solargis / Global Solar Athlas / globalsolaratlas.info
[10] Wind Map / Global Wind Atlas 2.0, a free, web-based application developed, owned and operated by the Technical University of Denmark (DTU) in partnership with the World Bank Group, utilizing data provided by Vortex, with funding provided by the Energy Sector Management Assistance Program (ESMAP). For additional information: globalwindatlas.info
[11] Agricultural land (% of land area) /Food and Agriculture Organization, electronic files and web site. License: CC BY-4.0 / Data / The World Bank / www.worldbank.org
[12] Forest area (% of land area) /Food and Agriculture Organization, electronic files and web site. License: CC BY-4.0 / Data / The World Bank / www.worldbank.org
[13] 2016 Annual U.S. & Global Geothermal Power Production Report (PDF) / Geothermal Energy Association / geo-energy.org
[14] Municipal waste statistics Updated / 19 July 2018 / Full list / Statistics Explained / Eurostat / ec.europa.eu
[15] BP Statistical Review of World Energy 2022 (PDF) / BP / www.bp.com
[16] Energie in Österreich 2021 (PDF) / Das Bundesministerium für Klimaschutz, Umwelt, Energie, Mobilität, Innovation und Technologie / www.bmk.gv.at
[17] International Energy Statistic / Geography /U.S. Energy Information Administration (Dec 2021) / www.eia.gov/beta/international/
[18] Downstream / OMV Group / www.omv.com
[19] Global Gas Shale and Unconventional Gas: Unlocking Your Potential (PDF)/ Gas Technology Institute / February 2010 / SlideShare / www.slideshare.net
[20] Kraftwerk Dürnrohr / Wikipedia / de.wikipedia.org/wiki/Kraftwerk_D%C3%BCrnrohr
[21] Mellach CCGT Power Plant Austria / Global Energy Observatory / www.globalenergyobservatory.org
[22] Austria Simmering Combined Power Plant / Industry About / www.industryabout.com
[23] Our Power Plants (Unsere Kraftwerke) / VerbundAG / www.verbund.com
[24] Malta Main Stage Pumped Storage Power Plant / DOE Global Energy Storage Database / www.energystorageexchange.org
[25] IG Windkraft / www.igwindkraft.at
[26] Standorte / Energie Burgenland / www.energieburgenland.at
[27] Sankt Veit an der Glan, Carinthia, Austria (PDF) / Fronius International GmbH / www.fronius.com
[28] Status und aktuelle Entwicklungen der Geothermie in Österreich, 2012 (PDF)/ Oberösterreichisches Landesmuseum / www.landesmuseum.at
[29] Biomassekraftwerk in Wien Simmering / Energie Leben / www.energieleben.at
[30] Deponiegasverstromung / Steiner-Bau GesmbH / www.steinerbau.at
[31] Agrana Bioethanol Refuelling the Environment (PDF)/ Producing Bioethanol / Agrana Group / www.agrana.com
[32] Vienna is Europe’s Capital City of BioDiesel / BDI – BioEnergy International AG / www.bdi-bioenergy.com
[33] Gas ist erneuerbar / Initiative Gas / initiative-gas.at
[34] Biomasserkraftwerk Oberwart / Gasification & Syngas Technologies Council / www.gasification.org
[35] Large Industrial Users of Energy Biomass, September 2013 (PDF) / IEA Bioenergy Task 40 / bioenergytrade.org
[36] ISWA WtE State of the Art Report / CEWEP (Confederation of European Waste-to-Energy Plants) / www.cewep.eu
[37] The Italy-Germany Gas Pipeline, The Search for stakeholders is due to start / Snam / www.snam.it
[38] Gazprom and OMV signed a Framework Agreement of Cooperation under the South Stream project / April 24, 2010 / Gazprom / www.gazprom.com
[39] European Union’s Nabucco pipeline project aborted / World Socialist Web Site / www.wsws.org
[40] 380 kV line St. Peter - Federal border / Austrian Power Grid (APG) / www.apg.at
[41] The Italy-Germany Gas Pipeline, The Search for stakeholders is due to start / Snam / www.snam.it
[42] Renewable Energy Projects in Austria / www.energyprojects.at
[43] Starke Zahlen der Windkraft in Niederösterreich Ende 2016 (PDF) / Interessengemeinschaft Windkraft Österreich / www.igwindkraft.at
[44] Kuhtaistorage power stationscheme / Tiroler Wasser Kraft / www.tiwag.at
[45] Windenergie in Österreich /IG Windkraft Österreich / www.igwindkraft.at
[46] Country Profile: Austria / Renewables Interactive Map / www.map.ren21.net
[47] Kuhtaistorage power stationscheme / Tiroler Wasser Kraft / www.tiwag.at
[48] BDI Bioenergy / www.bdi-bioenergy.com
[49] Geological history in fast motion: renewable natural gas produced from solar power and water, 1,000 metres underground / Underground Sun Conversion / www.underground-sun-conversion.at
[50] International Hydrogen Fueling Stations / Hydrogen Production / Hyarc / Hydrogen Tools / h2tools.org
[51] Innovative pilot plant generates hydrogen from renewables / OMV / www.omv.com
The sources of charts and curves are specified under the images.
For more information about the energy industry in Austria see here