
Contents
General State of the Economy
Hungary is located in Central Europe. The country has land borders with Slovenia and Austria in the west, Slovakia in the north, Ukraine and Romania in the east, and Serbia and Croatia in the south. Hungary has the longest borders with Slovakia, Romania and Croatia. The population of Hungary is about 10 million people. Hungary is a unitary parliamentary republic with Budapest as its capital and a population of 1.7 million.
| Hungary | ||
|---|---|---|
| Capital: Budapest | Density: 105/km2 | Currency: Forint (HUF) |
| Official languages: Hungarian | Life expectancy at birth: 77.2 years | GDP (PPP): $421.683 billion (2023 est.) |
| National Day: 23 October | Area (land): 89,608 km2 | GDP - per capita (PPP): $43,601 (2023 est.) |
| Population: 9,597,085 (2023 est.) | Coastline: 0 km | Internet country code: .hu |
Source: [1,2,3,4,5]
The rating positions of Hungary relative to other countries have been determined for an extensive list of economic, energy, innovative and educational indices, as well as for metrics reflecting the state of the environment. The economic indices include, for example, GDP per capita, annual average GDP growth, high-technology exports, and others. The list of energy indices includes proven reserves of oil, gas and coal, production-consumption ratio combined, and energy use, etc. Each of the indices has a ranked list of included member countries. Since the number of countries in each rating is different for each index, the positioning of the country of interest is displayed on a special chart, where the vertical axis is a uniform relative scale from 0 to 1, whereas the horizontal axis denominates the various indices and respective numbers relating to the descriptions given underneath.
Thus, in such a relative “0-1” diagram, the country’s position is marked with a dot in proportion to its location in the original rating list. If the country is among the leaders regarding the selected indicator, it will be marked close to 1 in the upper green zone on the relevant chart “0-1”, if the country is an outsider in the rating list, then it will be marked in the lower red zone of the chart “0-1”, etc.
Ranking position of Hungary for list of economic indices:
| Sources: 1. GDP (purchasing power parity), 2020 est. / The World Factbook/Library/Central Intelligence Agency *228 2. GDP - per capita (PPP), 2020 / The World Factbook/Library/Central Intelligence Agency *229 3. Inflation rate (consumer prices), 2019 est. / The World Factbook/Library/Central Intelligence Agency *228 4. Charges for the use of intellectual property, receipts (BoP, current US$), 2020 / International Monetary Fund, Balance of Payments Statistics Yearbook, and data files. / License: CC BY-4.0 *88 5. The Global Competitiveness Index 2019 / Rankings / Reports / World Economic Forum *141 6. High-technology exports (current US$) 2019-2020 / United Nations, Comtrade database through the WITS platform / License: CCBY-4.0 / Data *134 7. 2021 Index of Economic Freedom / International Economies / The Heritage Foundation *178 8. Reserves of foreign exchange and gold, 2017 est. / The World Factbook / Library / Central Intelligence Agency *195 9. Annual average GDP growth in %, for the last 10 years (2011-2020) / World Bank national accounts data, and OECD National Accounts data files / License: CC BY-4.0 *206 10. Public debt (% of GDP), 2017 est. / The World Factbook / Library / Central Intelligence Agency (from smallest to largest) *210 * Total number of countries participating in ranking Figure 1. Economic Indices of Hungary |
For most of the economic indicators shown in the chart, Hungary is noticeably above the middle of the ranking lists. The weakest spots in Hungary's economic indicators are Public debt as well as Inflation rate and Annual average GDP growth. Hungary has the best indices among those presented for High-technology exports (0.82) and Charges for the use of intellectual property (0.77).
Energy Resources
Hungary has no significant reserves of fossil fuels. For example, the share of oil reserves in Hungary relative to the world's reserves is 0.001%, the share of natural gas is 0.002%. The share of coal is higher – 0.28%. In terms of tons of oil equivalent, according to 2024 data, conventional proved reserves by fuel type were: 0.1% – oil, 0.1% – gas, and 99.8% – coal (Fig.5).
Table 1. Fossil energy resources of Hungary
| Resource/ Explanations | Crude oil | Natural gas | Coal | Shale Gas | Tight Oil | Coalmine methane |
|---|---|---|---|---|---|---|
| Value | 12.1 | 3.738 | 3 207 | - | - | 3.5 - 12.1 |
| Unit | million barrels | Bcf | million short tons | - | - | Bcm |
| Year | 2020 | 2020 | 2021 | - | - | 2020 |
| Source | [3] | [3] | [6] | - | - | [7] |
The indices of renewable resources in Hungary show relatively low values. The solar potential (GHI) is predominantly in the range 3.3-3.5 kWh/m2/day, which allows the development of solar power at a lower or medium efficiency level. An example of sky cover in the area of Miskolc in north-east Hungary, around which several solar plants are concentrated, is shown in the diagram below. The situation is similar for wind resources. For the installation of wind farms the area in the north-west of Hungary is used, where the average wind speed reaches 6 m/s at a height of 50 m. There are many fairly water-rich rivers in Hungary, the largest of which are the Danube and Tisza. However, hydropower in Hungary has not been seriously developed. A rather extensive agricultural area forms a decent resource base for the development of a number of bioenergy technologies, in particular, the production of biogas, bioethanol or biodiesel.
Table 2.Renewable energy resources of Hungary
| Resource/ Explanations | Solar Potential (GHI)* | Wind Potential (50 м)* | Bio Potential (agricultural area) | Bio Potential (forest area) | Geothermal Potenial | Municipal Solid Waste |
|---|---|---|---|---|---|---|
| Value | 3.3-3.5 | 4.0-5.0 | 53.7 | 22.5 | 90-100 | 416 |
| Unit | kWh/m2/day | m/s | % of land area | % of land area | mW/m2 | kg per capita |
| Year | 2020 | 2020 | 2020 | 2020 | 2022 | 2021 |
| Source | [8] | [9] | [10] | [11] | [12] | [13] |
*for most of the territory of the country
MISKOLC, HUNGARY, Sky cover, %
Latitiude: 48.08 Longitude: 20.77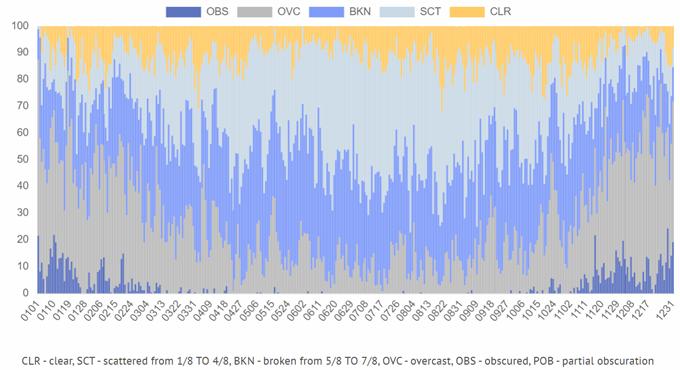
Energy Balance
According to [6], the total primary energy production in Hungary in 2022 was 0.339 quadrillion Btu and consumption was at 0.996 quadrillion Btu. A simple calculation shows that the share of domestic production in primary energy consumption was 34%. Thus, Hungary is an extremely energy import dependent country. Primary energy consumption is dominated by natural gas – 36.6%, followed by oil – 34.3%, renewables and nuclear – 22.5%, and coal – 6.5% [6].
Source: U.S. Energy Information Administration (Mar 2024) / www.eia.gov
Figure 2. The production and consumption of fossil fuels in Hungary (coal – left, gas – in the center, oil – right)
For the past twenty years, Hungary's marginal oil production has been maintained at a constant level. Natural gas is characterised by a marked decline in production. Coal production has fallen by almost a factor of three over the last two decades, with coal consumption significantly exceeds production.
Sources: U.S. Energy Information Administration (Mar 2024) / www.eia.gov | ||
| Figure 3. Electricity production in Hungary |
As Figure 3 shows, local electricity generation in Hungary lags far behind consumption. During the last decade, electricity consumption in the country has varied between 36 and 43 GWh, and electricity production between approximately 28 and 35 GWh [6, 14]. In the last four years, there has been an annual increase in electricity generation, mainly from renewable sources.
The chart of Hungary's energy indices is presented in the figure below.
| Sources: 1. Crude oil proved reserves, 2021 / International Energy Statistic/Geography / U.S. Energy Information Administration (Nov 2021)*98 2. Natural gas proved reserves 2021 / International Energy Statistic / Geography / U.S. Energy Information Administration (Nov 2021) *99 3. Total recoverable coal reserves 2019 / International Energy Statistic / Geography / U.S. Energy Information Administration (Nov 2021) *81 4. Combination production-consumption for Crude oil 2018 / International Energy Statistic / Geography / U.S. Energy Information Administration (Nov 2021) *219 5. Combination production-consumption for Natural gas 2019 / International Energy Statistic / Geography / U.S. Energy Information Administration (Nov 2021) *123 6. Combination production-consumption for Coal 2019 / International Energy Statistic / Geography / U.S. Energy Information Administration (Nov 2021) *128 7. Electricity – from other renewable sources (% of total installed capacity), 2017 est. / The World Factbook / Library / Central Intelligence Agency *170 8. GDP per unit of energy use (PPP per unit of oil equivalent), 2020 *66 Primary energy consumption - BP Statistical Review of World Energy 2021/BP;GDP (purchasing power parity) - The World Factbook/Library/Central Intelligence Agency 9. Energy use (primary energy use of oil equivalent per capita) 2020 *127 Primary energy consumption – BP Statistical Review of World Energy 2021; Population - United Nations, Department of Economic and Social Affairs, Population Division (2019). World Population Prospects 2019, custom data acquired via website. Retrieved 15 November 2021*66 10. The Global Energy Architecture Performance Index Report (EAPI) 2017 / Rankings / Reports / World Economic Forum 11. Electric power consumption (kWh per capita), 2016 *217 Electricity Consumption - The World Factbook / Library / Central Intelligence Agency; Population - United Nations, Department of Economic and Social Affairs, Population Division (2019). World Population Prospects 2019, custom data acquired via website. Retrieved 15 November 2021 12. Combination of electricity production-consumption (kWh)/The World Factbook/Library/Central Intelligence Agency *216 * Total number of countries participating in ranking Figure 4. Energy indices of Hungary |
Due to limited fossil resources in the form of oil and gas, Hungary's positioning for the respective indices is at the bottom of the chart. The indices for coal look significantly better, especially with regard to proven reserves. Hungary has the highest scores in this chart for The Global Energy Architecture Performance Index, Electric power consumption per capita, GDP per unit of energy use, and the worst for Combination of electricity production-consumption.
Energy Infrastructure

Natural gas production in Hungary takes place mainly in the south of the country. The main gas storage facilities are also located there. Gas reserves in the fields are small: For example the Makó gas field has recoverable natural gas reserves of 1.55 bcm [15]. The total length of gas pipelines is about 6000 km for the high-pressure gas transmission pipelines.
The country's oil industry is represented by several small fields with total reserves of 12.1 million bbl, a network of oil reservoirs, the Danube Duna Refinery at Szazhalombatta, near Budapest, and two major pipelines. The first is the Druzhba pipeline, whose Hungarian section runs from Szazhalombatta to the Fényeslitke receiving point on the Ukrainian border. The second pipeline originates in Omisalj, Croatia and continues to Danube Duna Refinery, owned by one of Hungary's largest companies, MOL.
Hungary had 10.9 GW of electricity generating capacity installed, generating 33.8 TWh of electricity in 2022 [6]. Of these, nuclear power made the largest contribution to generation – almost 44%. The share of renewable energy was about 22%.

The largest generating plants in Hungary are the nuclear power plant Paks (nameplate capacity 2000 MW) and the Mátra coal power plant (950 MW) [16,17]. The National electricity grid Hungary interconnects all regions of the country and is mainly designed for 400 KV lines, although a 750 KV line is also available.
Renewable energy in Hungary is quite diverse and is mainly represented by bioenergy and solar energy. Geothermal and hydropower are represented to a much lesser extent. The share of wind power is also relatively small.

Hungary has a large number of small plants producing biogas, bioethanol, biodiesel and pellets, as well as several biomass power plants.
During 2019-2021, several new solar plants were commissioned in Hungary, including Kaba Solar Park (43 MW), Kapuvár Solar Park (25 MW), and Paks Solar Park (20.6 MW) [18]. This made solar energy the absolute leader among other renewable energy sources in terms of electricity generation.
Wind energy is much more modestly represented in Hungary. Only a few wind farms have a capacity of more than 20 MW. The largest of them, Ács Wind Farm, has a capacity of 74 MW [19].
The Hungarian energy outlook until 2030 is defined in the National Energy and Climate Plan and National Energy Strategy [20,21]. In [22], the main findings of these documents are summarised:
- reduce emissions by 40% in 2030 compared to 1990 levels;
- cap total final consumption at 785 PJ (2005 levels) by 2030;
- produce 90% of domestic electricity from carbon-neutral sources, phasing out coal;
- install 6.5 GW of solar PV capacity by 2030 and 12 GW by 2040;
- install at least 200 000 household roof-top solar panels (average output of 4 kW);
- renewables to account for at least 21% of gross final energy consumption;
- source final energy consumption above 2005 levels from carbon-neutral sources in 2030.
A number of specific technological measures are foreseen to achieve these objectives, including improving energy efficiency in all consumption sectors, developing the production of second-generation biofuels, accelerating the deployment of energy storage systems, expanding waste treatment, ensuring the creation of a hydrogen economy, increasing funding for research, development and innovation, re-qualifying and training personnel.
Education and Innovation
The following chart shows Croatia's positions in terms of education and innovation:
Sources: 1. The Global Innovation Index 2021, Rankings / Knowledge / World Intellectual Property Organization / Cornell University, INSEAD, and WIPO (2021): Energizing the World with Innovation. Ithaca, Fontainebleau, and Geneva *132 2. Patent Grants 2011-2020, resident & abroad / Statistical country profiles / World Intellectual Property Organization *185 3.Patents in Force 2020 / Statistical country profiles / World Intellectual Property Organization *109 4. QS World University Rankings 2022 *97 5. SCImago Country Rankings (1996-2020) / Country rankings / SCImago, (n.d.). SIR-SCImago Journal & Country Rank [Portal]. Retrieved 17 Nov 2021 *240 6. Internet users in 2018 / The World Factbook / Central Intelligence Agency *229 7. Internet users in 2018 (% Population) / The World Factbook / Central Intelligence Agency *229 8. Government expenditure on education, total (% of GDP), 2019 / United Nations Educational, Scientific, and Cultural Organization (UNESCO) Institute for Statistics. License: CCBY-4.0 / Data as of September 2021*177 9. Research and development expenditure (% of GDP), 2018 / UNESCO Institute for Statistics. License: CCBY-4.0 / Data *119 10. Scientific and technical journal articles, 2018 / National Science Foundation, Science and Engineering Indicators. License: CCBY-4.0 / Data *197 * Total number of countries participating in ranking | ||
| Figure 8. The indices of education and innovation in Hungary |
All Hungarian indices describing the country's positioning in the various international rankings related to education and innovation are above average. Hungary has the highest rankings in SCImago Country Rankings, Patent Grants 2011-2020, Research and development expenditure (% of GDP). Hungary scores slightly lower in Internet users in 2018 (% population) and QS World University Rankings 2022. Overall, Hungary's indexes in the education and innovation sector look quite convincing.
Ecology and Environment Protection
Indicators related to environmental issues are presented in the following diagram:
| Sources: 1. CO2 total emission by countries 2020 / European Commission / Joint Research Centre (JRC) / Emission Database for Global Atmospheric Research (EDGAR)*208 2. CO2 per capita emission 2020/European Commission/Joint Research Centre (JRC) / Emission Database for Global Atmospheric Research (EDGAR) *208 3. Forest area 2020 (% of land area) / The Global Forest Resources Assessment 2020 / Food and Agriculture Organization of the United Nations *234 4. Forest area change 2010-2020 (1000 ha/year) / The Global Forest Resources Assessment 2020 / Food and Agriculture Organization of the United Nations *234 5. The Environmental Performance Index (EPI) 2020 / Rankings / Yale Center for Environmental Law & Policy / Yale University *180 6. Annual freshwater withdrawals (m3 per capita), 2017 *179 Annual freshwater withdrawals, total (billion m3), 2017 – Food and Agriculture Organization, AQUASTAT data. /License: CC BY-4.0; Population – United Nations, Department of Economic and Social Affairs, Population Division (2019). World Population Prospects 2019, custom data acquired via website. Retrieved 15 November 2021 7. The National Footprint Accounts 2017 (Biocapacity Credit / Deficit) / Global Footprint Network *188 8. Methane emissions (kt of CO2 equivalent), 2018 / Data for up to 1990 are sourced from Carbon Dioxide Information Analysis Center, Environmental Sciences Division, Oak Ridge National Laboratory, Tennessee, United States. Data from 1990 are CAIT data: Climate Watch. 2020. GHG Emissions. Washington, DC: World Resources Institute. Available at: License : Attribution-NonCommercial 4.0 International (CC BY-NC 4.0) *191 9. The Climate Change Performance Index (CCPI) 2022 / Overall Results / Jan Burck, Thea Uhlich, Christoph Bals, Niklas Höhne, Leonardo Nascimento / Germanwatch, NewClimate Institute & Climate Action Network *60 * Total number of countries participating in ranking | ||
| Figure 9. Environmental Indices of Hungary |
Hungary's low levels of fossil fuel extraction, as well as the significant amount of electricity generation through nuclear power and renewable energy, are reflected positively in the Environmental Indices chart. For example, Hungary's methane emissions are above average, The Environmental Performance Index (EPI) 2020, Forest area change, Annual freshwater withdrawals are between 0.66-0.82 with a maximum value of 1. However, the CO2 emission figures are 0.27-0.28 and The Climate Change Performance Index (CCPI) 2022 is even lower. Thus, according to Figure 9, the environmental situation in Hungary is generally not a cause for concern, but individual indicators need to be improved.
References
[1] List of sovereign states and dependencies by area / Wikipedia / en.wikipedia.org/wiki/List_of_sovereign_states_and_dependencies_by_area
[2] List of countries and dependencies by population density / Wikipedia / en.wikipedia.org/wiki/List_of_countries_and_dependencies_by_population_density
[3] Hungary / The world factbook / Library / Central Intelligence Agency / www.cia.gov
[4] GDP, PPP (constant 2011 international $) / World Bank, International Comparison Program database. License: CC BY-4.0 / Data / The World Bank / www.worldbank.org
[5] GDP per capita, PPP (current international $) / World Bank, International Comparison Program database. License: CC BY-4.0 / Data / The World Bank / www.worldbank.org
[6] International Energy Statistic / Geography / Hungary / U.S. Energy Information Administration (Dec 2022) / www.eia.gov/beta/international/
[7] Potential for the utilization of coal methane/ aenert.com/technologies/fossil-fuel/unconventional-gas/coal-seam-methane/
[8] Solar resource data obtained from the Global Solar Atlas, owned by the World Bank Group and provided by Solargis / Global Solar Atlas / globalsolaratlas.info
[9] Hungary Wind Map / Global Wind Atlas 2.0, a free, web-based application developed, owned and operated by the Technical University of Denmark (DTU) in partnership with the World Bank Group, utilizing data provided by Vortex, with funding provided by the Energy Sector Management Assistance Program (ESMAP). For additional information: globalwindatlas.info
[10] Agricultural land (% of land area) /Food and Agriculture Organization, electronic files and web site. License: CC BY-4.0 / Data / The World Bank / www.worldbank.org
[11] Forest area (% of land area) /Food and Agriculture Organization, electronic files and web site. License: CC BY-4.0 / Data / The World Bank / www.worldbank.org
[12] www.marketresearch.com/Mordor-Intelligence-LLP-v4018/Hungary-Geothermal-Energy-Growth-Trends-30678543/
[13] Municipal waste statistics Updated / 19 July 2018 / Full list / Statistics Explained / Eurostat / ec.europa.eu/ ec.europa.eu/eurostat/statistics-explained/index.php
[14] BP Statistical Review of World Energy 2020-2022 (PDF) / BP / www.bp.com
[15] en.wikipedia.org/wiki/Mak%C3%B3_gas_field
[16] en.wikipedia.org/wiki/Paks_Nuclear_Power_Plant
[17] Mátra Power Plant en.wikipedia.org/wiki/M%C3%A1tra_Power_Plant
[18] list.solar/plants/largest-plants/hungary/
[19] en.wikipedia.org/wiki/Wind_power_in_Hungary
[20] NATIONAL ENERGY STRATEGY 2030/ 2010-2014.kormany.hu/download/7/d7/70000/Hungarian%20Energy%20Strategy%202030.pdf
[21] Climate Plan and National Energy Strategy/ energy.ec.europa.eu/system/files/2022-08/hu_final_necp_main_en.pdf
[22] Hungary 2022.Energy Policy Review. International Energy Agency/
iea.blob.core.windows.net/assets/9f137e48-13e4-4aab-b13a-dcc90adf7e38/Hungary2022.pdf
The sources of charts and curves are specified under the images.
For more information about the energy industry in Hungary see here