
Contents
General State of the Economy
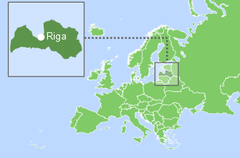
Latvia, officially the Republic of Latvia, is a Baltic state and located in Eastern Europe. Its capital city is Riga. Neighbouring countries are Estonia (to the north), Russia (to the east), Belarus (to the south-east), and Lithuania (to the south). The country has access to the Baltic Sea and the length of the coastline is 498 km [3].
According to 2022 statistics, the country, which is 124th in the world in terms of area, is home to around 1.8 million people. In terms of population density the country is 188th in the world [1,2,3]. The administrative map of Latvia is divided into 110 municipalities and 9 cities. The political form of government is parliamentary republic. The official language is Latvian [3].
The basis of the country's economy is its service sector, transit services, timber and wood processing, the agrarian sector, and its food industry [3]. Latvia is a developed transport and trade hub with three large ports in Riga, Ventspils and Liepaja [3].
By almost all indices in the diagram, Latvia is ranked in the top50% among all countries considered.
| Sources: 1. GDP (purchasing power parity), 2020 est. / The World Factbook/Library/Central Intelligence Agency *228 2. GDP - per capita (PPP), 2020 / The World Factbook/Library/Central Intelligence Agency *229 3. Inflation rate (consumer prices), 2019 est. / The World Factbook/Library/Central Intelligence Agency *228 4. Charges for the use of intellectual property, receipts (BoP, current US$), 2020 / International Monetary Fund, Balance of Payments Statistics Yearbook, and data files. / License: CC BY-4.0 *88 5. The Global Competitiveness Index 2019 / Rankings / Reports / World Economic Forum *141 6. High-technology exports (current US$) 2019-2020 / United Nations, Comtrade database through the WITS platform / License: CCBY-4.0 / Data *134 7. 2021 Index of Economic Freedom / International Economies / The Heritage Foundation *178 8. Reserves of foreign exchange and gold, 2017 est. / The World Factbook / Library / Central Intelligence Agency *195 9. Annual average GDP growth in %, for the last 10 years (2011-2020) / World Bank national accounts data, and OECD National Accounts data files / License: CC BY-4.0 *206 10. Public debt (% of GDP), 2017 est. / The World Factbook / Library / Central Intelligence Agency (from smallest to largest) *210 * Total number of countries participating in ranking Figure 1. Economic Indices of Latvia |
After a sharp decrease between 2007 and 2009, since 2010 the country experienced sustained GDP growth at purchasing power parity, both in general and per capita [4,5]. GDP at purchasing power parity increased from $51.67 billion in 2016 to $56.92 billion in 2020 (106th in the world) [3]. GDP at purchasing power parity per capita is somewhat higher (66th in 2020). The dynamics of this indicator is also positive: from 26 200 in 2016, to $29 900 in 2020[3]. The inflation rate rose from 0.1% in 2015 to 2.8% in 2019 (143rd in the world) [3].
According to The Global Competitiveness Report 2019, presented by the World Economic Forum, Latvia is 41st in the world, behind such EU countries as Poland and Slovenia. This rating reflects the effectiveness of the use of the country’s own resources for sustainable development. In addition to a number of economic indicators this index also takes into account such variables as education, health, level of innovation, etc. In terms of high-technology exports, from 2019-2020 Latvia was 47th, from a total of 134 countries, behind Estonia and Lithuania. According to the Index of Economic Freedom 2021, which takes into account business freedom, freedom from government intervention, protection of property, and freedom from corruption, Latvia was 28th out of 180 countries as of 2018. In terms of reserves of foreign exchange and gold, Latvia was 97th in 2017.
According to the indicator for the average GDP growth in percentage over the last 10 years (2011-2020), in 2020 the country was 88th out of 206 countries. In terms of public debt, calculated as a percentage of the country's GDP, Latvia was ranked 147th out of 210 countries considered in 2017.
Energy Resources
Latvia does not have significant reserves of fossil resources (Table 1). Nevertheless, the country has a variety of renewable energy resources, primarily hydro and bio resources. In some areas there are natural opportunities for the development of wind power.
Table 1. Renewable energy resources of Latvia
| Resource/ Explanations | Solar Potential (GHI)* | Wind Potential (50 м)* | Hydro Energy Potential** | Bio Potential (agricultural area) | Bio Potential (forest area) | Municipal Solid Waste |
|---|---|---|---|---|---|---|
| Value | 2.7-2.8 | 5.0-6.5 | 5 | 31.1 | 54.0 | 478 |
| Unit | kWh/m2/day | m/s | TWh/year | % of land area | % of land area | kg per capita |
| Year | 2018 | 2018 | 2002 | 2016 | 2016 | 2018 |
| Source | [6] | [7] | [8] | [11] | [12] | [13] |
*for most of the territory of the country
**economically exploitable capability
The level of global horizontal irradiation for the majority of the country is low – 2.7-2.8 kWh/m2/day, but in the west of the country it can reach up to 3.0 kWh/m2/day [6]. The distribution of wind resources is as follows: for the majority of the country the wind speed is 5.0-6.5 m/s; higher wind speeds can be observed in the west of the country along the coast – 7.0-7.7 m/s (at a height of 50 m) [7].
According to [8] the economically exploitable hydropower capability in Latvia is 5 TWh/yr. However, other sources rate it somewhat lower – 3.9 TWh/yr. The theoretical hydro resources of small and medium-sized rivers in Latvia as of 2016 are 900 GWh [9]. Potential capacity of small hydropower is estimated at more than 75 MW [10]. In 2018, 54.1% of Latvia was forested and 29.2% was covered by agricultural land [11,12]. The potential of these resources is being actively used in the production of energy products from biomass.
According to the level of generation of municipal waste – 478 kg per person, Latvia is ahead of its neighbour Estonia (383 kg per capita) but behind Lithuania (483 kg per capita) [13]. This resource, which is found in many highly developed countries, is being successfully used for energy production or secondary consumption. However, this technology has not yet been actively applied in Latvia.
Energy Balance
The volume of oil consumption in the country has remained fairly stable over the past 15 years, (Fig. 2), and in 2020 amounted to 35.4 thousand barrels/day. The level of oil production remained stable and reached the level of 1.6 thousand barrels/day in 2020 [14]. According to the Central Statistical Bureau of Latvia, the final consumption of oil products in the country in 2019 amounted to 66 609 Tj, while imports amounted to 96 885Tj, and exports were 20 616 Tj [15].
Source: U.S. Energy Information Administration (Dec 2021) / www.eia.gov
Figure 2. The production and consumption of fossil fuels in Latvia (coal – left, gas – in the center, oil – right)
Consumption of natural gas in Latvia has gradually decreased since 2010 (Fig.2) reaching 37.7 Bcf in 2020, as compared to 54 Bcf in 2010 [14]. According to [15], in 2019 total final consumption of natural gas was 13 581 Tj. The import of natural gas was 46 319 Tj in 2019 [15]. The consumption of coal in the country since 2011 has demonstrated a sharp decline and, according to 2017 data, was 72 thousand short tons [14] compared to 190 thousand short tons in 2011. According to the Central Statistical Bureau of Latvia, in 2019 final total coal consumption was 1 497 Tj, with imports of 1 935 Tj [15].
Latvia mainly relies on two principle sources for electricity generation (Fig. 3): imported fossil fuels and hydro resources. It should be noted that in recent years the share of hydropower in the country's energy balance has been decreasing and there is a small increase evident in the share of other renewable energy sources. Electricity production in Latvia in 2020 was 5.46 TWh, dominated by hydropower – 47.4%, followed by fossil fuels – 33.3%, and other renewable sources – 19.2% (Figure.6).
Sources: U.S. Energy Information Administration (Dec 2021) | ||
| Figure 3. Electricity production in Latvia |
Latvia’s position in the comparative diagram of energy index is shown in Figure 4. As previously mentioned, Latvia does not have significant reserves of fossil resources, so the first five indices are extremely low or non-existent.
| Sources: 1. Crude oil proved reserves, 2021 / International Energy Statistic/Geography / U.S. Energy Information Administration (Nov 2021)*98 2. Natural gas proved reserves 2021 / International Energy Statistic / Geography / U.S. Energy Information Administration (Nov 2021) *99 3. Total recoverable coal reserves 2019 / International Energy Statistic / Geography / U.S. Energy Information Administration (Nov 2021) *81 4. Combination production-consumption for Crude oil 2018 / International Energy Statistic / Geography / U.S. Energy Information Administration (Nov 2021) *219 5. Combination production-consumption for Natural gas 2019 / International Energy Statistic / Geography / U.S. Energy Information Administration (Nov 2021) *123 6. Combination production-consumption for Coal 2019 / International Energy Statistic / Geography / U.S. Energy Information Administration (Nov 2021) *128 7. Electricity – from other renewable sources (% of total installed capacity), 2017 est. / The World Factbook / Library / Central Intelligence Agency *170 8. GDP per unit of energy use (PPP per unit of oil equivalent), 2020 *66 Primary energy consumption - BP Statistical Review of World Energy 2021/BP;GDP (purchasing power parity) - The World Factbook/Library/Central Intelligence Agency 9. Energy use (primary energy use of oil equivalent per capita) 2020 *127 Primary energy consumption – BP Statistical Review of World Energy 2021; Population - United Nations, Department of Economic and Social Affairs, Population Division (2019). World Population Prospects 2019, custom data acquired via website. Retrieved 15 November 2021*66 10. The Global Energy Architecture Performance Index Report (EAPI) 2017 / Rankings / Reports / World Economic Forum 11. Electric power consumption (kWh per capita), 2016 *217 Electricity Consumption - The World Factbook / Library / Central Intelligence Agency; Population - United Nations, Department of Economic and Social Affairs, Population Division (2019). World Population Prospects 2019, custom data acquired via website. Retrieved 15 November 2021 12. Combination of electricity production-consumption (kWh)/The World Factbook/Library/Central Intelligence Agency *216 * Total number of countries participating in ranking Figure 4. Energy indices of Latvia |
The scarcity of fossil resources in Latvia is critical and there are not enough of them to produce the required quantity of electricity, therefore Latvia is a major importer of fossil fuels.
However, other indices look more promising. In terms of the share of electricity production from renewable energy sources (excluding hydropower), Latvia is 86th out of 170 countries selected for consideration.
Latvia is ranked 17th, ahead of Germany, Croatia, and Hungary in the EAPI of 2017 (Energy Architecture Performance Index), which is based primarily on the level of economic growth, environmental safety, and energy independence of the country, including access to energy.
In terms of electricity consumption per capita, the country is 80th in the world, however, for the indicator of combination of electricity production-consumption, Latvia is 189th in the ranked list of 216 countries.
Energy Infrastructure
A territorial map showing the distribution of the largest infrastructure projects of the fossil fuel sector in Latvia is shown in Figure 5. According to U.S. Energy Information Administration, primary energy production in Latvia accounts for 19.75% of total energy consumption in 2021 (Fig. 5). The Ventspils Nafta terminal is the leading non-freezing terminal of the free port of Ventspils, connected by a pipeline and a railway to Russia. The total capacity of the terminal for trans-shipment oil products to tankers by rail is 7 million tons per year. The total capacity of the tank farm is 1 195 000 m3, the maximum capacity of the tankers is 100 000 tons. Four tankers can be processed simultaneously [16]. The trans-shipment capacity of fuel oil and diesel of the Ventspils terminal, owned by Ventbunkers, reaches 7 million tons, and the total capacity of the tank farm is 355 m3 [17]. Ventspils also processes a variety of other energy cargo. At the terminal owned by JSC "Baltic Coal Terminal" it is possible to ship up to 6 million tons of coal annually. The company's project provides for the expansion of the terminal to 10.5 million tons per year [18]. Peat, timber and biomass are transported to Ventpils by Ventplac Ltd [19]. Since 2006, Russia has stopped supplying crude oil to Ventspils via the crude oil pipeline, and there is information about the suspension of deliveries via the petroleum products pipeline, which could seriously affect the cargo turnover of the Ventspils port.
Figure 5. Basic infrastructural facilities of the fossil fuel sector in Latvia
The oil terminal in Liepaja processes an average of 26,000 metric tons of cargo per month and has a total capacity of 85,000 m3.
The terminal transports crude oil, petroleum products, biomass and petrochemical products [20]. In 2016 the volume of transshipment of energy cargo in the Freeport of Riga amounted to more than 13 million tons of coal, more than 8 million tons of oil products, 28 000 tons of liquefied gas, and 145 000 tons of peat [21]. The Baltic oil terminal in the port of Riga is capable of handling up to 10 million tons of dark and light oil products per year, for ships with a deadweight of 100 thousand tons [22]. The total length of pipelines for the transportation of oil and oil products is 412 km and 421 km respectively (Fig. 5). As mentioned above, oil has not been transported through the pipeline from Russia since 2006. The Inčukalns natural gas storage facility is the only one of its type in the Baltic countries. It was built in 1968 and has a storage capacity of 4.5 Bcm of natural gas [23].
The gas storage is located at a depth of about 700 meters in an aquifer of loose sandstone under a layer of hard rocks. Gas injection is carried out in summer; gas extraction in winter. Import of gas - mainly from Russia - is carried out through a pipeline with a length of 1 097 km (Fig. 5). Due to the completion of the construction of the liquefied gas terminal in Klaipeda, and in order to maintain efficient operation, it is planned to modernize the gas storage facility. The level of investment required is estimated at EUR 376.5 million [24].
A map of the territorial distribution of Latvia's largest infrastructure facilities for electricity generation is presented in Figure 6.
Figure 6. Electricity production in Latvia
The share of fossil resources in electricity production in Latvia in 2020 was33.4% (Fig.6).
The country has several stations for the production of electricity from hydrocarbon materials, including the Riga CHPP-1 gas power plant with an installed capacity of 144 MW. In 2016 this station produced 613 GWh of electricity and 1110 GWh of thermal energy [25]. In 2005, the station was reconstructed.
The combined-cycle thermal power station in Riga, CHPP-2, has an installed capacity of 881 MW of electricity and 1 124 MW of thermal energy. The largest energy producer in Latvia is Latvenergo, which owns both the previously mentioned stations, with a total installed capacity of 2 564 MW of electricity and 1 842 MW of thermal energy. The company's revenues in 2016 totalled EUR 932 million [25].
Latvia receives a significant share of its electricity from neighbouring countries, whilst also being an exporter. Taking into account seasonal fluctuations, in 2016, net exchange saldo was 61.1 (surplus, December) to 113.7 GWh (deficit, June) [26]. As previously mentioned, hydropower in Latvia accounts for almost 50% of the electricity generated, and according to data for 2017, Latvia has a total installed hydroelectric capacity of 26 GW (Fig. 6). The leading generator is Pļaviņas Hydro Power Plant, built in 1965, with an installed capacity of 908 MW [27]. In addition to Pļaviņas, shown on the map, there are less powerful hydroelectric stations – Riga HPP (402 MW) and Kegums HPP (248 MW). In 2020, the total electricity production by hydroelectric power plants on the River Daugava was 2 528 GWh (39% more than in 2015, due to the increased flow) [25]. It is planned to carry out a large-scale reconstruction of high-voltage networks in Latvia to increase their throughput. One such project involves the reconstruction of the obsolete 330 kV line between Tartu (Estonia) and Valmiera (Latvia). Another project, called the Kurzeme Ring, plans to construct a 330 kV transmission line with a total length of about 330 km and a capacity of 800 MW. This project is part of a larger NordBalt project between Sweden and Lithuania to improve the reliability of electricity supply in the region [28].
Figure 7 shows the main infrastructure of Latvia for the production of renewable energy.
Figure 7. Renewable energy in Latvia
In the areas of high wind activity, there are a number of large wind farms with a capacity of more than 1 MW each. The largest of these is Pope/Targale, with an installed capacity of 27 MW [29]. The total installed capacity of wind power in the country is 68 MW. Because of low solar activity, the use of solar energy in Latvia has not received intensive development. Nevertheless, according to the solar energy association [30] in 2015, the total capacity of solar generators connected to the grid in Latvia was 1.3 MW, including 12 small solar power plants with a total capacity of 385 kW.
The production of various kinds of energy products from biomass is the most dynamically developing in Latvia. According to data for 2019, about 0.93 TWh was generated from biomass (Fig. 7), i.e. more than 6 times that coming from wind energy. The country operates biomass processing, refining, biogas, biodiesel, bioethanol and pellet production. Fortum manages the largest biomass processing plant, the Jelgava Biomass power plant, with an installed capacity of more than 23 MW [31].
Launched in 2010, the Rezekne pellet factory owned by New Fuels RSEZ is capable of producing up to 240 000 tons annually [32]. The enterprise produces and exports wood pellets with a diameter of 6 and 8 mm. More than EUR 40 million has been invested in this facility. Since 2015, the company has received electricity from the biogas cogeneration station, the largest in Latvia, with an electric capacity of 3.1 MW and a thermal power capacity of 10.7 MW [33]. Ventspils Bio-Venta SIA Biodiesel Plant, is capable of producing 100 000 tons of biodiesel annually [34]. The enterprise was launched in 2008 and has been the largest producer of this product in the Baltic States ever since. In 2015, this enterprise produced 61 880 tons of biodiesel. The total investment amounts to EUR 77.72 million. Jaunpagasts Plus annually produces about 7 500 tons of bioethanol at the country's largest enterprise – Iecava [34]. The main Latvian plants in the field of bioenergy are: biogas production – Dobele, Bio Ziedi Biogas plant with an installed capacity of 2.5 MW [35]; and Getlini Landfill gas-to-energy plant with an installed capacity of 6.3 MW [36].
Education and Innovation
The set of indices reflecting the position of Latvia among other countries in the field of education and innovation can be seen in Figure 7. As follows from the presented diagrams, Latvia's indicators for education and innovation are quite contradictory. According to the Global Innovation Index 2021, Latvia is ranked 38th out of 132 countries (see diagram for links).
| Sources: 1. The Global Innovation Index 2021, Rankings / Knowledge / World Intellectual Property Organization / Cornell University, INSEAD, and WIPO (2021): Energizing the World with Innovation. Ithaca, Fontainebleau, and Geneva *132 2. Patent Grants 2011-2020, resident & abroad / Statistical country profiles / World Intellectual Property Organization *185 3.Patents in Force 2020 / Statistical country profiles / World Intellectual Property Organization *109 4. QS World University Rankings 2022 *97 5. SCImago Country Rankings (1996-2020) / Country rankings / SCImago, (n.d.). SIR-SCImago Journal & Country Rank [Portal]. Retrieved 17 Nov 2021 *240 6. Internet users in 2018 / The World Factbook / Central Intelligence Agency *229 7. Internet users in 2018 (% Population) / The World Factbook / Central Intelligence Agency *229 8. Government expenditure on education, total (% of GDP), 2019 / United Nations Educational, Scientific, and Cultural Organization (UNESCO) Institute for Statistics. License: CCBY-4.0 / Data as of September 2021*177 9. Research and development expenditure (% of GDP), 2018 / UNESCO Institute for Statistics. License: CCBY-4.0 / Data *119 10. Scientific and technical journal articles, 2018 / National Science Foundation, Science and Engineering Indicators. License: CCBY-4.0 / Data *197 * Total number of countries participating in ranking Figure 8. The indices of education and innovation in Latvia |
According to the number of patents granted to Latvian nationals, both domestically and abroad, the country ranks 58th in the world. Similarly, by the number of valid patents, the country is 53rd in the world, largely indicating the country's favourable conditions for innovation.
In terms of government expenditure on education as a percentage of the country's GDP, the country also demonstrates a result above the world average – 51st out of 177 countries selected for consideration.
Similarly, in terms of public expenditure on research and development as a percentage of GDP, Latvia is 54th, above the world average. Latvia is well positioned when considering the number of publications of specialists in scientific and technological journal and patent activities. Latvia places 77th out of 240 participating countries in the Scimago ranking, and in Scientific and Journal Activities it is ranked 69th out of 197 countries. The University of Latvia is included in the rating of the world-leading universities, the QS University Rating, and conducts training in various fields of energy, including Geology and Environmental Science. The Technical University of Latvia conducts research in the field of renewable energy.
Ecology and Environment Protection
A diagram of environmental indices is shown in Figure 9. From the diagram it can be seen that the ecological situation in the country looks quite secure. First of all, it should be noted that the level of CO2 emissions in Latvia corresponds to the world average, but per capita it is slightly higher.
At the same time, the situation is aggravated by the fact that Latvia is regarded as one of the 61 countries responsible for more than 90% of global CO2 emissions related to energy in the Climate Change Performance Index (CCPI) 2022.
| Sources: 1. CO2 total emission by countries 2020 / European Commission / Joint Research Centre (JRC) / Emission Database for Global Atmospheric Research (EDGAR)*208 2. CO2 per capita emission 2020/European Commission/Joint Research Centre (JRC) / Emission Database for Global Atmospheric Research (EDGAR) *208 3. Forest area 2020 (% of land area) / The Global Forest Resources Assessment 2020 / Food and Agriculture Organization of the United Nations *234 4. Forest area change 2010-2020 (1000 ha/year) / The Global Forest Resources Assessment 2020 / Food and Agriculture Organization of the United Nations *234 5. The Environmental Performance Index (EPI) 2020 / Rankings / Yale Center for Environmental Law & Policy / Yale University *180 6. Annual freshwater withdrawals (m3 per capita), 2017 *179 Annual freshwater withdrawals, total (billion m3), 2017 – Food and Agriculture Organization, AQUASTAT data. /License: CC BY-4.0; Population – United Nations, Department of Economic and Social Affairs, Population Division (2019). World Population Prospects 2019, custom data acquired via website. Retrieved 15 November 2021 7. The National Footprint Accounts 2017 (Biocapacity Credit / Deficit) / Global Footprint Network *188 8. Methane emissions (kt of CO2 equivalent), 2018 / Data for up to 1990 are sourced from Carbon Dioxide Information Analysis Center, Environmental Sciences Division, Oak Ridge National Laboratory, Tennessee, United States. Data from 1990 are CAIT data: Climate Watch. 2020. GHG Emissions. Washington, DC: World Resources Institute. Available at: License : Attribution-NonCommercial 4.0 International (CC BY-NC 4.0) *191 9. The Climate Change Performance Index (CCPI) 2022 / Overall Results / Jan Burck, Thea Uhlich, Christoph Bals, Niklas Höhne, Leonardo Nascimento / Germanwatch, NewClimate Institute & Climate Action Network *60 * Total number of countries participating in ranking Figure 9. Environmental Indices of Latvia |
In terms of forest area as a percentage of the country, Latvia is 41st in the world, and demonstrates a positive trend. The situation is brightened by a relatively high valuation of Latvia in the Environmental Performance Index rankings (EPI), which focuses primarily on assessing the environmental performance of national governments. Here, the country is 36th, although behind Lithuania and Estonia, but shows a positive trend.
The overall picture is moderated by the Ecological Footprint Atlas rating, according to which Latvia is among the number of ecological creditors.
References
[1] List of sovereign states and dependencies by area / Wikipedia / https://en.wikipedia.org/wiki/List_of_countries_and_dependencies_by_area
[2] List of countries and dependencies by population density / Wikipedia / https://en.wikipedia.org/wiki/List_of_countries_and_dependencies_by_population_density
[3] Latvia / The world factbook / Library / Central Intelligence Agency / https://www.cia.gov/
[4] GDP, PPP (constant 2011 international $) / World Bank, International Comparison Program database. License: CC BY-4.0 / Data / The World Bank / http://www.worldbank.org/
[5] GDP per capita, PPP (current international $)/ World Bank, International Comparison Program database. License: CC BY-4.0 / Data / The World Bank / http://www.worldbank.org/
[6] Solar resource data obtained from the Global Solar Atlas, owned by the World Bank Group and provided by Solargis / Global Solar Athlas / http://globalsolaratlas.info/
[7] Wind Map / Global Wind Atlas 2.0, a free, web-based application developed, owned and operated by the Technical University of Denmark (DTU) in partnership with the World Bank Group, utilizing data provided by Vortex, with funding provided by the Energy Sector Management Assistance Program (ESMAP). For additional information: https://globalwindatlas.info
[8] World Energy Council 2004 Survey of Energy Resources (PDF) / World Energy Council / www.worldenergy.org/
[9] Latvijas Vēstnesis / Par Enerģētikas attīstības pamatnostādnēm 2016.-2020. gadam / https://likumi.lv/
[10] Latvia / Small hydropower World / http://www.smallhydroworld.org/
[11] Agricultural land (% of land area) / Food and Agriculture Organization, electronic files and web site. License: CC BY-4.0 / Data / The World Bank / http://www.worldbank.org
[12] Forest area (% of land area) /Food and Agriculture Organization, electronic files and web site. License: CC BY-4.0 / Data / The World Bank / http://www.worldbank.org/
[13] Municipal waste statistics Updated / Full list / Statistics Explained / Eurostat / https://ec.europa.eu/
[14] International Energy Statistic / Geography / U.S. Energy Information Administration (Dec 2021) /http://www.eia.gov/beta/international/
[15] Statistical Yearbook of Latvia 2020 / Central Statistical Bureau Of Latvia / https://www.csb.gov.lv/
[16] Ventipils Nafta / http://www1.vnt.lv/
[17] Ventbunkers / http://www.ventbunkers.lv/
[18] JSC "BALTIC COAL TERMINAL" / http://www.balticcoal.lv/
[19] Ventplac / http://www.ventplac.lv/
[20] Infrastructure / DG Terminals / http://dgterminals.lv/
[21] Freeport of Riga / http://rop.lv/
[22] Baltic oil Terminal / http://www.balticoilterminal.lv/
[23] Incukalnapazemesgazeskratuve / NeoGeo / http://neogeo.lv/
[24] Delfi / http://www.delfi.lv/
[25] Riga CHPP-1 / Latvenergo / http://www.latvenergo.lv/
[26] Latvian electricity market overview - September 2016 / AST / http://www.ast.lv/
[27] Latvenergo / Daugava hydropower plants / Plavinas HPP’s" / http://www.latvenergo.lv/
[28] Kurzemesloks / Ast Visas Tiesības Aizsargātas / http://www.ast.lv/
[29] Papildinata – Atklaj jaudigako veja parku Latvija; planotas investicijas 200 milj. eiro / Daily Business (Dienas Bizness) / http://vecs.db.lv/
[30] Saules enerģijas potenciāla pārskats ES valstīs / SEA / http://www.saulesbiedriba.lv/
[31] Fortum inaugurates the first large-scale biomass combined heat and power plant in Latvia / Fortum / http://www.fortum.com/
[32] About NewFuels / NewFuels RSEZ / http://www.newfuels.eu/
[33] History / Bio-Venta / http://www.vktranzits.lv/
[34] Kur aiztek mūsu bioetanols?Aisma Orupe (PDF) / JSC Jaunpagasts Plus / http://jpplus.lv/
[35] Dobeles novadā atklās SIA Bio ziedi vērienigo biogāzes ražotni / April 2011/ EU Home (ES Māja) / http://www.esmaja.lv/
[36] Gāzes ieguve un enerģijas ražošana / 23/02/2012 / Eko Getlini / http://source.zl.lv/
The sources of charts and curves are specified under the images.
For more information about the energy industry in Latvia see here