
Contents
General State of the Economy
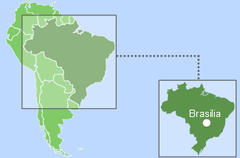
Brazil,officially the Federative Republic of Brazil, borders every South American country, with the exception of Chile and Ecuador. Brazil is the fifth largest country in the world by territory and the most populated country in South America [1,2]. The total length of the country's coastline is 7,491 km [3].
As of 2022, Brazil is home to around 217 million people [3]. The majority of the population is concentrated in the capital region, along the Atlantic coast and in the cities of Rio de Janeiro and San Paolo. Brazil is a parliamentary republic and the administrative map is divided into 26 states. The official language is Portuguese, and the main religion is Catholicism [3].
| Federative Republic of Brazil/ República Federativa do Brasil | ||
|---|---|---|
| Capital: Brasília | Density: 25/km2 | Currency: Real (R$) (BRL) |
| Official languages: Portuguese | Life expectancy at birth: 74.01 years | GDP (PPP): $4.020 trillion (2023 est.) |
| National Day: 07 September | Area: 8,515,767 km2 | GDP - per capita (PPP): $18,686 (2023 est.) |
| Population: 203,062,512 (2023 census) | Coastline: 7,491 km | Internet country code: .br |
Source: [1,2,3,4,5]
Brazil has a fairly diverse economy that varies from region to region. Historically, an important place in the country's economy has been occupied by the agricultural, mining and manufacturing industries, and the service sector. Due to an extensive domestic resource base and developed industrial sector, Brazil demonstrates high indices regarding GDP, the market value of publicly traded shares, high-technology export of goods and gold reserves, but a number of important economic indicators are below the world average (Fig.1).
| Sources: 1. GDP (purchasing power parity), 2020 est. / The World Factbook/Library/Central Intelligence Agency *228 2. GDP - per capita (PPP), 2020 / The World Factbook/Library/Central Intelligence Agency *229 3. Inflation rate (consumer prices), 2019 est. / The World Factbook/Library/Central Intelligence Agency *228 4. Charges for the use of intellectual property, receipts (BoP, current US$), 2020 / International Monetary Fund, Balance of Payments Statistics Yearbook, and data files. / License: CC BY-4.0 *88 5. The Global Competitiveness Index 2019 / Rankings / Reports / World Economic Forum *141 6. High-technology exports (current US$) 2019-2020 / United Nations, Comtrade database through the WITS platform / License: CCBY-4.0 / Data *134 7. 2021 Index of Economic Freedom / International Economies / The Heritage Foundation *178 8. Reserves of foreign exchange and gold, 2017 est. / The World Factbook / Library / Central Intelligence Agency *195 9. Annual average GDP growth in %, for the last 10 years (2011-2020) / World Bank national accounts data, and OECD National Accounts data files / License: CC BY-4.0 *206 10. Public debt (% of GDP), 2017 est. / The World Factbook / Library / Central Intelligence Agency (from smallest to largest) *210 * Total number of countries participating in ranking Figure 1. Economic Indices of Brazil |
Between the early 1990s and 2012, the country experienced a steady growth in GDP at purchasing power parity, including GDP per capita. In 2013 both indicators began to decline, before beginning to recover in 2015 [4,5]. In 2020, GDP at purchasing power parity was at $2.989 trillion (8th place in the world), down from $3.072 billion in 2018 [3]. GDP at purchasing power parity per capita is significantly lower (110th place in 2020), which has also been demonstrating negative dynamics: from $15,500 in 2017 to $14,100 in 2020 [3]. In terms of annual GDP growth, Brazil ranks 168th out of 224 countries considered. Although the level of inflation decreased in 2019 compared to 2016, from 6.3% to 3.7%, it is still high. By this indicator, the country is 157th the world.
According to the Global Competitiveness Report, presented by the World Economic Forum in 2020, Brazil is 71st, out of a total of 141 countries considered, ahead of Guatemala in the region; notably, the country gained nine positions in the rating during last two years. This rating measures the effectiveness of the use of the country’s own resources for sustainable development. In addition to a number of economic indicators this index also takes into account such variables as education, health, level of innovation, etc.
In 2017 Brazil ranked 10th terms of gold reserves and foreign exchange reserves.
In the list of countries that export high-tech products in 2019-2020, the country was 34th out of 134 countries, ahead of most countries in the region. According to the Index of Economic Freedom, which is based on freedom of business, freedom from government action, property protection, and freedom from corruption, Brazil was 143rd in 2021, out of the 178 countries considered. In terms of public debt the country is 32nd out of 210 countries participating in the index.
Brazilian Petrobras is ranked as one of the world’s largest companies in Fortune’s Global 500 for 2022, and is also named as one of the largest energy companies globally in Platts 2021 Top 250 Companies by S & P Global.
Energy Resources
Brazil has significant reserves of fossil resources (Table 1), but the primary resource is oil. Brazilian oil deposits are represented by reserves of traditional oil, as well as shale oil and kerogen oil. The country also has large natural gas reserves, including shale gas and coal deposits.
In terms of tons of oil equivalent, in 2021 proven reserves of conventional hydrocarbons in Brazil were: coal — 69,1%; oil — 26%; and gas — 4.9%(Fig.5). The unconventional natural resource matrix was as follows: kerogen oil —62,7%; shale gas — 32%; tight oil —3,7%; associated petroleum gas — 1,36; and coal mine methane utilization potential — 0,3% (Fig. 5).
Table 1. Fossil energy resources of Brazil
| Resource /Explanations | Crude oil* | Natural gas* | Coal* | Shale Gas** | Tight Oil** | Coal mine methane | Oil Shale |
|---|---|---|---|---|---|---|---|
| Value | 12.7(0.75%) | 13(0.18%) | 7270(0.63%) | 244.9 | 5.3 | 16.9-48.8 | 82 000 |
| Unit | billion barrels | Tcf | million short tons | Tcf | billion barrels | Bcm | million barrels |
| Year | 2021 | 2020 | 2021 | 2015 | 2015 | 2018 | 2008 |
| Source | [6] | [6] | [6] | [9] | [9] | [11,13] | [10] |
*share of the country’s reserves in world total is provided in brackets
**unproved technically recoverable
In terms of oil reserves, Brazil is second to Venezuela in Latin America. According to the information presented in [3,6], in the beginning of 2021 oil reserves totalled 12.71 billion barrels. According to ВР’s statistical report, oil reserves were estimated to be 11.9 billion barrels in 2020 [7]. According to estimates by the Ministerio de Minas e Energia, the proven reserves of traditional oil in Brazil amounted to around 12.84 billion barrels in 2017, an increase of 1.3% on the previous year [8].
Proven reserves of natural gas in 2020 were 12.3 Tcf [6,7] (second in the region), and according to [3] in 2021 they were estimated at 363.9 billion m3.
A report by the Ministerio de Minas e Energia estimated proven natural gas reserves at 370 bcm in 2017[8].
According to [9], unproved technically recoverable shale gas reserves in Brazil are 244.9 Tcf; second in the region, after Argentina. Brazil has small reserves of oil shale (tight) oil - around 5.3 billion barrels in 2013 according to [9]. The country also has the largest reserves of kerogen oil in the region, estimated at 82,000 million barrels at the end of 2008 [10].
Coal reserves are principally concentrated in the country’s southern regions: in Santa Catarina, Rio Grande do Sul, and Parana provinces. According to [11] in 2015, recoverable reserves were estimated at 6 535 million tons, and total resources at 32,269 million tons; [7] put proven reserves at 6 596 million tons as of 2020. According to [12], total resources of coal bed methane in 2014 were estimated at 6 billion m3. According to calculations by Advanced Energy Technologies, the potential for coalmine methane utilization (according to the methodology based on methane emissions from coal mining [13] and its reserves [11]), totalled around 16.9-48.8 bcm. Given its vast territory with diverse climatic zones and natural landscapes, Brazil has significant potential for the development of renewable energy. A selection of basic indicators is presented in Table 2.
The principal and most valuable resource for renewable energy in Brazil is hydro power. The total hydro potential of the country is 136,105 MW; the largest in South America [14]. In the south of the country there is potential for tidal energy, estimated at up to 30 kW/m [15].
Table 2. Renewable energy resources of Brazil
| Resource/ Explanations | Solar Potential (GHI)* | Wind Potential (50 м)* | Hydro energy Potential** | Bio Potential (agricultural area) | Bio Potential (forest area) | Municipal Solid Waste | |
|---|---|---|---|---|---|---|---|
| Value | 4.9 – 5.5 | <6 | 136 105 | 32.9 | 61.9 | 1,03 | |
| Unit | kWh/m2/day | m/s | MW | % of land area | % of land area | kg/per capita/day | |
| Year | 2018 | 2018 | 2015 | 2018 | 2018 | 2012 | |
| Source | [16] | [17] | [14] | [18] | [19] | [20] |
*for most of the territory of the country
**inventoried and estimated
The level of global horizontal solar radiation in the majority of the country is relatively high with a value of between 4.9-5.5 kWh/m2/day [16]. The maximum level of solar radiation can be found in Bahia and in the north-east of the country, where it can reach 6.0-6.3 kWh/m2/day. The distribution of wind resources is as follows: in most of the country the wind speed does not exceed 6 m/sec; in the state of Rio Grande do Sul, Rio de Janeiro and Rio Grande de Norte, and along the South Atlantic coastline it can reach 7.5 m/s at a height of 50 m [17].
About 32.9% of Brazil is forested with around 61.9% covered by agricultural land [18,19]. This resource has the potential to play a significant role in energy production.
The level of municipal waste generation in Brazil was 1.03 kg per capita per day. By 2025, this index is projected to grow to 1.6 kg per capita per day [20]. This resource is a valuable raw material for recycling or energy production; technologies for its utilisation are at the development stage in Brazil.
Energy Balance
According to BP's report, total primary energy consumption in Brazil in 2021 amounted to 293.2 million tons of oil equivalent [7]. In 2017, Balanço Energetico Nacional [21] reported that total primary energy production in Brazil was 301.6 million tons of oil equivalent.
The volume of oil production in Brazil has demonstrated steady growth in the last ten years (Fig. 2). In source [6], production of petroleum and other liquids in Brazil was reported as 3.68 million barrels/day in 2021. According to [7] in 2021 the country produced 2 987 thousand barrels/day, and according to the Ministerio de Minas e Energia — 2.73 million barrels/day, i.е. an increase of 4.6% in comparison with 2017 [9]. In 2016, crude oil production in the country totalled 134 376 ktoe [22].
Consumption reached 2.790 million bbl/day in 2020 [6]. Approximately the same level of consumption, according to [7] was observed in 2021 — 2.252 million barrels/day. In a report by the Ministerio de Minas e Energia for 2015, the figures are significantly lower — 2.41 million barrels/day (crude oil & LNG) [9]. According to the same source, imports of oil and petroleum products amounted to 0.15 million barrels, with exports totalling 1 million barrels per day in 2017.
Source: U.S. Energy Information Administration (Sep 2023) / https://www.eia.gov/
Figure 2. The production and consumption of fossil fuels in Brazil (coal — left, gas — in the center, oil — right)
Production of natural gas showed steady growth between 2002 and 2019 (Fig. 2) and in 2019 reached 846 Bcf [6]. In 2021, according to BP [7] production totalled 24.3 billion m3. .According to the Ministerio de Minas e Energia, in 2017, gas production increased by 5.84% compared to the previous year, reaching 109.86 million m3/day [9]. During the same period, natural gas production in Brazil totalled 20 080 ktoe [22]. In 2016, Brazil extracted 77.9 million m3/day of associated petroleum gas (see the link in Fig. 6), while its reserves in 2015 were estimated at about 350 billion m3.
Gas consumption in 2019 was 1.2 Tcf according to [6]. BP presents a figure of 40.4 billion m3 in 2021 [7]. In a 2017 report by the Ministerio de Minas e Energia [9], gas consumption was estimated at 85.56 million m3/day (including on-site consumption by the producer) which is 6.6% more than in 2016. According to the International Energy Agency, total final natural gas consumption in the country amounted to 12562 ktoe in 2016 [22]. In 2019, the imports of natural gas totalled 9,724,017,000 cubic meters, while 0 cubic meter was exported in 2021 [3]. In 2017, according to the Ministerio de Minas e Energia, the volume of imports was 29,3 million m3/day [9].
Coal production in Brazil has increased over the past 10 years and in 2019 amounted to more than 5.96 million tons. Consumption has also grown steadily and in 2019 totalled more than 28.6 million short tons; 8.805 million short tons of energy grade coal was imported [22].
Historically, Brazil has a high share of hydropower in electricity production (Fig. 3).
In 2020 Brazil produced around 622 TWh of electricity, of which 65.8% was from hydro power, with 11.8% from fossil fuels, 2.3% from nuclear energy, and 20.1% from other renewable sources (Fig 7).
Sources: U.S. Energy Information Administration (Sep 2023) / https://www.eia.gov/ | ||
| Figure 3. Electricity production in Brazil |
Brazil’s position in the comparative diagram of energy index is shown in Figure 4. The indices, which are based on reserves of fossil fuels and export opportunities, show Brazil’s competitive position relative to the global average.
| Sources: 1. Crude oil proved reserves, 2021 / International Energy Statistic/Geography / U.S. Energy Information Administration (Nov 2021)*98 2. Natural gas proved reserves 2021 / International Energy Statistic / Geography / U.S. Energy Information Administration (Nov 2021) *99 3. Total recoverable coal reserves 2019 / International Energy Statistic / Geography / U.S. Energy Information Administration (Nov 2021) *81 4. Combination production-consumption for Crude oil 2018 / International Energy Statistic / Geography / U.S. Energy Information Administration (Nov 2021) *219 5. Combination production-consumption for Natural gas 2019 / International Energy Statistic / Geography / U.S. Energy Information Administration (Nov 2021) *123 6. Combination production-consumption for Coal 2019 / International Energy Statistic / Geography / U.S. Energy Information Administration (Nov 2021) *128 7. Electricity – from other renewable sources (% of total installed capacity), 2017 est. / The World Factbook / Library / Central Intelligence Agency *170 8. GDP per unit of energy use (PPP per unit of oil equivalent), 2020 *66 Primary energy consumption - BP Statistical Review of World Energy 2021/BP;GDP (purchasing power parity) - The World Factbook/Library/Central Intelligence Agency 9. Energy use (primary energy use of oil equivalent per capita) 2020 *127 Primary energy consumption – BP Statistical Review of World Energy 2021; Population - United Nations, Department of Economic and Social Affairs, Population Division (2019). World Population Prospects 2019, custom data acquired via website. Retrieved 15 November 2021*66 10. The Global Energy Architecture Performance Index Report (EAPI) 2017 / Rankings / Reports / World Economic Forum 11. Electric power consumption (kWh per capita), 2016 *217 Electricity Consumption - The World Factbook / Library / Central Intelligence Agency; Population - United Nations, Department of Economic and Social Affairs, Population Division (2019). World Population Prospects 2019, custom data acquired via website. Retrieved 15 November 2021 12. Combination of electricity production-consumption (kWh)/The World Factbook/Library/Central Intelligence Agency *216 * Total number of countries participating in ranking Figure 4. Energy indices of Brazil |
In terms of the production-consumption ratio of gas and coal, however, the country's indices show an imbalance. The shortage of natural gas and coal is particularly palpable in Brazil, with production lagging far behind the level of consumption.
In terms of the share of electricity production from renewable energy sources (excluding hydropower), in 2017 Brazil was 45th out of 170 countries selected for consideration.
In the global Energy Architecture Performance Index 2017, which is based primarily on the level economic growth, environmental safety, and energy independence of the country, including access to energy, Brazil is 30th, ahead of Canada. Brazil was 35th out of 66 countries ranked by the ratio of GDP per unit of energy use in 2020, while energy consumption per capita is much lower – 49th out of 66 countries.
In terms of electric power consumption per capita, the country ranks in the middle of the index, however, in terms of combined electricity production-consumption Brazil is at the top of the rating.
Energy Infrastructure
A territorial map showing the distribution of the largest infrastructure projects of the fossil fuel sector in Brazil is shown in Figure 5. As previously mentioned, coal reserves account for 69.1% of the energy potential of fossil resources. The main coal reserves are concentrated in the south of the country (Fig. 5). The largest coal extraction field in Brazil is Mina do Leão II, in the Rio Grande do Sul area [24]. According to [25], 2.4 million tonnes of coal are extracted from this field annually. At the end of 2012, 15 coal-mining companies were registered in Brazil, extracting around 6 million short tons of coal annually [25].
Around 90% of Brazil's oil fields are situated offshore [5]. The leading oil field is Lula (Tupi), which produced 629,520.24 barrels/day in 2016 [26]. The largest gas field is also offshore - Lula field-with production at 27.46 million m3/ day in 2016 [26]. 
Figure 5. Energy infrastructure in Brazil: conventional fossil fuels
Three types of oil pipelines connect the oil fields with major refineries: pipelines for crude oil with a total length of 4831 km; oil pipelines for the transportation of petroleum products with a length of 4722 km; and oil pipelines for liquefied petroleum gas with a length of 352 km (Fig.5). The majority of the pipelines are spread along the Atlantic coast.
Figure 6. Energy infrastructure in Brazil: unconventional fossil fuels
Refineries in Brazil have a total installed capacity of 630,600 barrels/day [27]. The largest refinery is Paulina, with an installed capacity of 415,000 barrels/day [28].
The key oil terminals and storage tanks are São Sebastião, with a tank size of 9.97 million barrels, and Angra dos Reis, with a 5.32 million barrel reservoir [29]. The main infrastructure facilities for natural gas processing are concentrated along the coast and in the north-east of the country. The largest plant of this type is Caraguatatuba, which has an installed capacity of 18,000,000 m3 [30]. Three LNG import terminals are located along the coast, in the capital area, and near the cities of Fortaleza and Salvador. The largest - Guanabara Bay LNG Import Terminal - has a capacity of 5.1 Bcm [31]. The main exporters of LNG to Brazil are Nigeria, Qatar, Spain, and Trinidad and Tobago [6]. Gas imports from Bolivia, as well as its transportation between LNG receiving terminals, gas processing plants and power plants, are carried out through gas pipelines with a total length of 17 312 km and a gas condensate pipeline 251 km long (Fig. 5). A map of the territorial distribution of the largest infrastructure facilities of the unconventional fossil fuels of Brazil is shown in Figure 6.
The main unconventional fossil resource of Brazil is kerogen oil. The leading kerogen oil extraction field is Sao Mateus do Sul [32]. The largest deposits of extra-heavy oil belong to the state-owned company Petrobras; the largest of these is Fazenda Alegre, with extraction levels in 2013 of 9500 barrels/day [33]. Gas hydrates reserves were found in the north and south of the country. The unconventional fuel processing infrastructure is represented by two plants for the processing of kerogen oil: Sao Mateus do Sul (5880 tons / day) [34], and GTL Aracaju Petrobras (20 barrels/day) [35]. A map showing the territorial distribution of the largest unconventional fossil fuels infrastructure facilities in Brazil is shown in Figure 6.
According to the U.S. Energy Information Administration, total electricity generation in Brazil in 2020 was 622 TWh. Hydropower has the largest share in the production of electricity, accounting for around 65.8% in 2020, with 11.8% coming from fossil resources, 2.5% from nuclear power and around 20.1% from renewable energy sources.
The country's largest hydroelectric power plant - Itaipu - has an installed capacity of 14,000 megawatts [36].
In Brazil there are 6 large combined cycle power plants, each over 150 MW, 8 gas power plants with a capacity of more than 400 MW, 4 large coal power plants with a capacity of more than 150 MW, and 8 oil power plants with more than 150 MW (Fig. 7).
The biggest combined cycle power plant is Santa Cruz, with a capacity of 932 MW, and the largest gas power plant is the Parnaiba Complex with an installed capacity of 1,427 MW. The leading oil power plant - Suape II - has a capacity of 380 MW [37, 38, 39].
The leading coal power plant is Porto de Pacem I with a capacity of 720 MW. The total installed capacity of Brazil’s nuclear power plants - Angra I and Angra II - is 1896 MW [40,41].
In Figure 8, you can see the main Brazilian infrastructure facilities for the production of energy from renewable sources.
Figure 7. Electricity production in Brazil
As noted above, renewable energy in Brazil, excluding hydropower, does not have a significant share in electricity generation; in 2017 total electricity production from renewable sources, excluding hydropower, was 125.15 TWh (Fig. 8) or 20.1%. Bioenergy technology is actively developing in Brazil and, according to 2019 data, electricity generated from biomass amounted to around 54.92 TWh (Fig. 8).
The country has biomass processing plants, biogas production, biodiesel production, first generation and second generation bioethanol production, pellets, and landfill gas production.
Figure 8. Renewable energy in Brazil
The largest biomass processing plant - Puma Unit Ortigueria - has an installed capacity of more than 270 MW and is operated by the Klabin Company [42]. Termoverde Caieiras, a plant for landfill gas production, generates around 26 MWh of electricity, and can provide 300,000 households with electricity [43]. Odebrecht Agroind produces around 430 million tons of bioethanol annually at the largest plant in the country - Vicentinópolis [44]. GranBio's Bioflex company has successfully implemented modern technologies for second-generation bioethanol production at General Lagos, which produces around 83 million litres of bioethanol annually [45]. Veranópolis is the largest biodiesel plant with annual production levels of around 1,050,000 litres [46]. Along the coastline, in zones of high wind activity, there are around 10 wind farms with a capacity of more than 180 MW each. The largest of these is Alto Sertao II with an installed capacity of 386 MW [47]. As previously noted, the level of global horizontal solar radiation in the most densely populated areas of the country can reach 6.3 kWh/m2/day, which is a good resource for the production of energy by means of photovoltaics [17].
As a result, there are several renewable energy facilities in the region, including 10 solar stations with a capacity of more than 50 MW each (Fig.8). The largest solar power plant is Pirapora with an installed capacity more than 400 MW [48]. Since 2012, there has been a significant increase in the installed capacity of renewable energy (excluding hydropower) by 4 times from 12 GW in 2012 to 51 GW in 2021 [49].
Education and Innovation
Indices reflecting the position of Brazil relative to other countries in the field of education and innovation can be seen in Figure below. Figure 9 presents indices that are not directly related to the energy sector, but strongly correlates with technological development in the field of energy, both in Brazil and globally.
Brazil placed 57th out of 132 countries considered in the ranking of countries of the Global Innovation Index 2021 (see diagram).
| Sources: 1. The Global Innovation Index 2021, Rankings / Knowledge / World Intellectual Property Organization / Cornell University, INSEAD, and WIPO (2021): Energizing the World with Innovation. Ithaca, Fontainebleau, and Geneva *132 2. Patent Grants 2011-2020, resident & abroad / Statistical country profiles / World Intellectual Property Organization *185 3.Patents in Force 2020 / Statistical country profiles / World Intellectual Property Organization *109 4. QS World University Rankings 2022 *97 5. SCImago Country Rankings (1996-2020) / Country rankings / SCImago, (n.d.). SIR-SCImago Journal & Country Rank [Portal]. Retrieved 17 Nov 2021 *240 6. Internet users in 2018 / The World Factbook / Central Intelligence Agency *229 7. Internet users in 2018 (% Population) / The World Factbook / Central Intelligence Agency *229 8. Government expenditure on education, total (% of GDP), 2019 / United Nations Educational, Scientific, and Cultural Organization (UNESCO) Institute for Statistics. License: CCBY-4.0 / Data as of September 2021*177 9. Research and development expenditure (% of GDP), 2018 / UNESCO Institute for Statistics. License: CCBY-4.0 / Data *119 10. Scientific and technical journal articles, 2018 / National Science Foundation, Science and Engineering Indicators. License: CCBY-4.0 / Data *197 * Total number of countries participating in ranking Figure 9. The indices of education and innovation in Brazil |
According to the number of patents granted to Brazilian nationals, both domestically and abroad, the country ranks 31st in the world, behind a number of European countries, but nonetheless higher than the world average. Similarly, by the number of patents in force, the country is above the world average – 28th place, indicating the country's favourable conditions for innovation.
27 Brazilian universities are included in the QS University Rating, likely owing to the relatively high level of government expenditure on education, research and development in general. For government expenditure on education Brazil ranks 33rd, and for research and development 31st in the world. Brazilian universities, such as the University of São Paulo, State University of Campinas, Pontifical Catholic University of Rio de Janeiro train specialists in various fields of energy, including Chemical Engineering, Civil Engineering, Environmental Engineering, Materials and Nanotechnology Engineering, and Petrol Engineering etc.
Brazil is well positioned when considering the number of publications of specialists in scientific and technological journals. It is also regarded highly by the Scimago Journal and Country Rank. In the Scimago rating Brazil ranks 14th out of 240 countries, and in the Scientific and Journal Activities - 11th out of 197 countries. Notably, in both cases the country demonstrates the highest result in the region.
Petroleo Brasiliero S.A. – Petrobras is among the leaders in patenting among Brazilian companies in the field of synthetic fuel production, extraction and processing of unconventional oil and associated petroleum gas. Scientific research and development in the same field is carried out by the Universidade Federal do Rio Grande do Norte, the Universidade Federal do Rio de Janeiro, and the Centro de Pesquisas da Petrobras.
Another area where Brazilian and foreign companies actively patent their technology in the Brazilian patent office is in the extraction of hydrocarbons from low-permeability reservoirs. The main patent holder is Mineracao Curimbaba Ltda; Petrobras and AGI Brazil also conduct active research in this area.
A large number of Brazilian companies patent technical solutions in the field of energy production from renewable sources. In the field of bioenergy the following companies should be mentioned - Petroleo Brasiliero S.A. - Petrobras, Centro de Technologia Canaviera, G-Meta Consultoria, Participacoes E Servicos Ltda, Outro Fino Participacoes E Empreendimentos S.A. In the field of wind power – Tecsis Tecnologia E Sistemas Avancados. The University of Campinas, the Universidade de Sao Paolo, and the Universidade Federal do Parana have the highest number of publications in this area.
Studies in the field of concentrated solar energy have been conducted by the Universidade Federal do Rio de Janeiro, the Universidade Federal de Pernambuco, the Centro Universitario UNA, and other organizations.
Ecology and Environment Protection
A diagram of environmental indices is shown in Figure 10. This figure shows indices that have an indirect effect on the energy sector, but can play a vital role in determining its future. The country demonstrates a relatively high level of CO2 emissions in general, however, per capita this level is considerably lower.
Brazil ranks 30th in the Climate Change Performance Index (CCPI) 2022, which includes the 61 countries responsible for more than 90% of the world's energy-related CO2 emissions. According to the report, Brazil shows “promising signals of a reduction in emissions from forestry” and is leading in the group of medium-performing countries.
According to the forest area as a percentage of land area, Brazil is 34th in the world, however, there is a very negative trend in forest area change, and the country ranks last in the world on the list of 234 countries considered.
Brazil does, however, have a relatively high valuation in the Environmental Performance Index rankings (EPI) 2020, which focuses primarily on assessing the environmental performance of national governments. In this rating Brazil placed 55th out of 180 member countries, beginn Mexico and Argentina.
| Sources: 1. CO2 total emission by countries 2020 / European Commission / Joint Research Centre (JRC) / Emission Database for Global Atmospheric Research (EDGAR)*208 2. CO2 per capita emission 2020/European Commission/Joint Research Centre (JRC) / Emission Database for Global Atmospheric Research (EDGAR) *208 3. Forest area 2020 (% of land area) / The Global Forest Resources Assessment 2020 / Food and Agriculture Organization of the United Nations *234 4. Forest area change 2010-2020 (1000 ha/year) / The Global Forest Resources Assessment 2020 / Food and Agriculture Organization of the United Nations *234 5. The Environmental Performance Index (EPI) 2020 / Rankings / Yale Center for Environmental Law & Policy / Yale University *180 6. Annual freshwater withdrawals (m3 per capita), 2017 *179 Annual freshwater withdrawals, total (billion m3), 2017 – Food and Agriculture Organization, AQUASTAT data. /License: CC BY-4.0; Population – United Nations, Department of Economic and Social Affairs, Population Division (2019). World Population Prospects 2019, custom data acquired via website. Retrieved 15 November 2021 7. The National Footprint Accounts 2017 (Biocapacity Credit / Deficit) / Global Footprint Network *188 8. Methane emissions (kt of CO2 equivalent), 2018 / Data for up to 1990 are sourced from Carbon Dioxide Information Analysis Center, Environmental Sciences Division, Oak Ridge National Laboratory, Tennessee, United States. Data from 1990 are CAIT data: Climate Watch. 2020. GHG Emissions. Washington, DC: World Resources Institute. Available at: License : Attribution-NonCommercial 4.0 International (CC BY-NC 4.0) *191 9. The Climate Change Performance Index (CCPI) 2022 / Overall Results / Jan Burck, Thea Uhlich, Christoph Bals, Niklas Höhne, Leonardo Nascimento / Germanwatch, NewClimate Institute & Climate Action Network *60 * Total number of countries participating in ranking Figure 10. Brazil’s Environmental Indices |
According to The Environmental Vulnerability Index, which is based on years of observations and 50 indicators and includes for example, changing climatic characteristics or the quality of water resources, waste volumes, oil spills and other hazardous substances, etc. Brazil is 84th.
Brazil also belongs to a group of countries with very high levels of methane emissions. The overall negative picture is mitigated by the Ecological Footprint Atlas rating, according to which Brazil is among the environmental creditors.
References
[1] List of sovereign states and dependencies by area / Wikipedia / https://en.wikipedia.org/wiki/List_of_sovereign_states_and_dependencies_by_area
[2] List of countries and dependencies by population density / Wikipedia / https://en.wikipedia.org/wiki/List_of_countries_and_dependencies_by_population_density
[3] Brazil / The world factbook / Library / Central Intelligence Agency / https://www.cia.gov/
[4] GDP, PPP (constant 2011 international $) / World Bank, International Comparison Program database. License: CC BY-4.0 / Data / The World Bank / http://www.worldbank.org/
[5] GDP per capita, PPP (current international $) / World Bank, International Comparison Program database. License: CC BY-4.0 / Data / The World Bank / http://www.worldbank.org/
[6] International Energy Statistic / Geography / U.S. Energy Information Administration / www.eia.gov/beta/international/
[7] BP Statistical Review of World Energy 2021 (PDF) / BP / https://www.bp.com/
[8] Bolitim de Exploracao E Producao de Petroleo e Gas Natural 2017 (PDF) / Boletim Anual de Exploração e Produção de Petróleo e Gás Natural / Petróleo, gás natural e biocombustíveis / Ministerio de Minas e Energia / http://www.mme.gov.br/
[9] World Shale Resource Assessments (PDF) / Studies / U.S. Energy Information Admnistration (September 2015) / https://www.eia.gov/
[10] Survey of Energy Resources 2012 / 2012 / Publications / World Energy Council / https://www.worldenergy.org/
[11] Capítulo 6 (Recursos e Reservas Energéticas) 1970-2015 / Downloads / Ministerio de Minas e Energia / https://ben.epe.gov.br/
[12] BGR(2015): Energy Study 2015. Reserves, resources and availability of energy resources (19).—172p., Hannover. / http://www.bgr.bund.de/
[13] 2006 IPCC Guidelines for National Greenhouse Gas Inventories, Volume 2, Energy, Fugitive Emissions (PDF) / The Intergovernmental Panel on Climate Change (IPCC) / www.ipcc-nggip.iges.or.jp
[14] World Energy Resources: 2013 Survey / 2013 / Publications / The World Energy Council / http://www.worldenergy.org/
[15] Wave power / Wikipedia / https://en.wikipedia.org/wiki/Wave_power
[16] Solar resource data obtained from the Global Solar Atlas, owned by the World Bank Group and provided by Solargis / Global Solar Athlas / http://globalsolaratlas.info/
[17] Brazil Wind Map / Global Wind Atlas 2.0, a free, web-based application developed, owned and operated by the Technical University of Denmark (DTU) in partnership with the World Bank Group, utilizing data provided by Vortex, with funding provided by the Energy Sector Management Assistance Program (ESMAP). For additional information: https://globalwindatlas.info
[18] Agricultural land (% of land area) / Food and Agriculture Organization, electronic files and web site. License : CC BY-4.0 / Data / The World Bank / http://www.worldbank.org
[19] Forest area (% of land area) / Food and Agriculture Organization, electronic files and web site. License : CC BY-4.0 / Data / The World Bank / http://www.worldbank.org/
[20] What a Waste 2012 / Resources / World Bank / http://www.worldbank.org/
[21] BALANÇO ENERGÉTICO NACIONAL 2017 RELATÓRIO FINAL / BRAZILIAN ENERGY BALANCE 2017 FINAL REPORT (PDF) / Empresa de Pesquisa Energetica / https://ben.epe.gov.br/
[22] Brazil / Statistics / © OECD / IEA 2018, IEA Publishing, Licence: www.iea.org/t&c / International Energy Agency / https://www.iea.org
[23] Anuário Estatístico de Energia Elétrica 2017 ano base 2016 (PDF) / Empresa de Pesquisa Energetica / http://www.epe.gov.br/
[24] Mina de Candiota / Minas / Companhia Riograndense de Mineraçao (CRM) / http://www.crm.rs.gov.br/
[25] PRODUÇÃO DE CARVÃO / Carbonifera Belluno Ltda. / http://salvaro.cbelluno.com.br/
[26] Summario executivo de petroleo e gas de sao paulo ed novembro 2016 (PDF)/ 2017 / Uploads / Secretaria de Energia e Mineração / http://www.energia.sp.gov.br/
[27] OPEC Annual Statistical Bulletin 2016 (PDF)/ 2016 Organization of the Petroleum Exporting Countries ISSN 0475-0608 / https://www.opec.org/
[28] Paulínia (Replan) / Refineries / Main Operations / Our Activities / Petroleo Brasileiro S.A. (Petrobras) / http://www.petrobras.com.br/pt/
[29] Terminals and Pipelines / Terminals and Oil Pipelines / Transpetro / http://www.transpetro.com.br/pt_br/home.html
[30] Unidade de Processamento de Gas Natural (Existing Gas Processing plant) / Areas de negocios / Transpetro / http://www.transpetro.com.br/pt_br/home.html
[31] Guanabara Bay Regasification Terminal (LNG) / Terminals and Oil Pipelines / Main Operations / Petroleo Brasileiro S.A. (Petrobras) / http://www.petrobras.com.br/pt/
[32] Energy policy of Brazil / Wikipedia / http://en.wikipedia.org/wiki/Energy_policy_of_Brazil#Oil_shale
[33] Relacao de Tipos de Petroleo Nacional in Brasil (20 December 2013) / Portal da Imprensa Nacional / http://pesquisa.in.gov.br/imprensa/core/start.action
[34] Environmental and Operational Aspects of an Oil Shale Industrial Plant in Brazil (PDF)/ Presentations / Documents / Colorado Energy Research Institute / http://www.ceri-mines.org/
[35] CompactGTL small-scale demonstration plant commissioned at Petrobras site / April, 27 2011 / Green Car Congress / http://www.greencarcongress.com/
[36] Hydro Electricity in Brazil / Rebeca Duran / May 13, 2015 / The Brazil Business / http://thebrazilbusiness.com/
[37] Santa Cruz / Furnas / http://www.furnas.com.br/
[38] Parnaiba Complex / Our Business / ENEVA / http://www.eneva.com.br/
[39] Quem Somos / Quem somos / Suape Energia / http://www.suapeenergia.com.br/
[40] Energia Termeletrica. Gas Natural, Biomassa, Carvao, Nuclear. (May 2016) (PDF) / Empresa de Pesquisa Energetica – Minas e Energia do Brasil / http://www.epe.gov.br/pt
[41] Nuclear Power in Brazil (updated Feb 2017) / Countries A-F / Country Profiles / World Nuclear Association / http://www.world-nuclear.org/
[42] Puma Unit / Klabin / https://www.klabin.com.br/
[43] Maior termelétrica com combustível renovável é inaugurada em São Paulo / Economia / September 9, 2016 / Camila Boehm/ Empresa Brasil de Comunicacão S/A / http://agenciabrasil.ebc.com.br/
[44] About Us / Odebrecht Agroindustrial / https://www.atvos.com/
[45] Commercial Cellulosic Ethanol Plants in Brazil / European Biofuels Technology Platform / http://www.odebrechtagroindustrial.com/
[46] Veranópolis / Wikipedia / https://en.wikipedia.org/wiki/Veran%C3%B3polis
[47] Brazil: AES to acquire 386.4 MW Alto Sertao II / Jan 19, 2017 / Wind Power Intelligence / http://www.windpowerintelligence.com/
[48] Pirapora Solar Plant / www.csisolar.com/399-mw-pirapora-solar-plant/
[49] IRENA (2022), Renewable Energy Statistics 2022, International Renewable Energy Agency, Abu Dhabi / www.irena.org
The sources of charts and curves are specified under the images.
For more information about the energy industry in Brazil see here