Contents
General State of the Economy
Canada, one of the world’s most economically developed countries, is located in North America between the Atlantic Ocean (to the east), the Arctic (to the north), the Pacific Ocean (to the west) and the US (to the south). Canada is the second largest country in the world by territory, after Russia, but in terms of population density ranks 234th out of 248 countries [1,2]. The total length of the country's coastline is more than 200 thousand kilometers [3].
| Canada | ||
|---|---|---|
| Capital: Ottawa | Density: 4.2/km2 | Currency: Canadian dollar ($) (CAD) |
| Official languages: English, French | Life expectancy at birth: 81.75 years | GDP (PPP): $2.385 trillion (2023 est.) |
| National Day: 01 July | Area: 9,984,670 km2 | GDP - per capita (PPP): $60,177 (2023 est.) |
| Population: 40,097,761 (2023Q3 est.) | Coastline: 243,042 km | Internet country code: .ca |
Source: [1,2,3,4,5]
The administrative map of Canada is divided into 10 provinces and three territories. Canada is a parliamentary monarchy and its official languages are English and French. The capital of Canada is Ottawa and the largest city is Toronto. The country is home to about 38 million people [3].
| Sources: 1. GDP (purchasing power parity), 2020 est. / The World Factbook/Library/Central Intelligence Agency *228 2. GDP - per capita (PPP), 2020 / The World Factbook/Library/Central Intelligence Agency *229 3. Inflation rate (consumer prices), 2019 est. / The World Factbook/Library/Central Intelligence Agency *228 4. Charges for the use of intellectual property, receipts (BoP, current US$), 2020 / International Monetary Fund, Balance of Payments Statistics Yearbook, and data files. / License: CC BY-4.0 *88 5. The Global Competitiveness Index 2019 / Rankings / Reports / World Economic Forum *141 6. High-technology exports (current US$) 2019-2020 / United Nations, Comtrade database through the WITS platform / License: CCBY-4.0 / Data *134 7. 2021 Index of Economic Freedom / International Economies / The Heritage Foundation *178 8. Reserves of foreign exchange and gold, 2017 est. / The World Factbook / Library / Central Intelligence Agency *195 9. Annual average GDP growth in %, for the last 10 years (2011-2020) / World Bank national accounts data, and OECD National Accounts data files / License: CC BY-4.0 *206 10. Public debt (% of GDP), 2017 est. / The World Factbook / Library / Central Intelligence Agency (from smallest to largest) *210 * Total number of countries participating in ranking Figure 1. Economic Indices of Canada |
The majority of the population is concentrated in the south along the US border. A third consider themselves Canadians (32.2% [3]); others identify as English, French, Scottish, and many others, given the long history of immigration into the country.
Canada has a highly efficient and balanced economy in which all the main sectors, such as raw materials, agriculture, engineering, services, etc., have developed equally. The level of the Canadian economy is reflected in the comparative chart of various economic indices – Figure 1. By almost all indices Canada places in the top quarter of the graph, among the top 25% countries in the world included in the rating. For some indicators (the market value of publicly traded shares, the index of economic freedom), Canada occupies the highest position.
According to [3] Canada's GDP reached $ 1.742 trillion in 2020 (15th in the world), and has demonstrated steady GDP growth over the past few decades [3,4]. GDP per capita is slightly lower (34th in 2020 ), but and has even fallen from $48,800 in 2018 to $ 45,900 in 2020 [3]. Rapid growth by this indicator occurred in the first decade of this century [5]. Inflation in Canada has reached 1.9% as of 2019 – 106th place in the world [3]; given the fact that many countries have negative inflation, Canada’s position for this indicator is somewhat worse than the other values in the comparative chart. It should be noted, however, that the method of calculating this indicator operates solely on statistical data, excluding assessment of the optimal rate of inflation.
According to The Global Competitiveness Report 2019, presented by the World Economic Forum, Canada is 14th out of a total of 141 countries considered, behind the United States, but ahead of New Zealand. This rating measures the effectiveness of the use of the country’s own resources for sustainable development. In addition to a number of economic indicators, this index also takes into account such variables as education, health, level of innovation, etc. In the list of countries that exported high-tech products in 2019-2020, the country was 21st out of 134 countries.
According to the Index of Economic Freedom, which is based on freedom of business, freedom from government intervention, property protection, and freedom from corruption, the country was 9th in 2021, out of 178 countries considered.
In terms of gold reserves and foreign exchange reserves, Canada was 28th, behind the USA .
According to the indicator for the average GDP growth in percentage over the last 10 years (2011-2020), the country was 143rd out of 206 countries. Similarly, in terms of public debt, calculated as a percentage of the country's GDP, Canada was ranked 25th out of 210 countries considered in 2017.
Energy Resources
Canada is one of the richest countries in the world in terms of fossil fuel reserves. There are large deposits of natural gas, including shale gas, coal, and high-grade uranium. The main fossil fuel resource in Canada is oil. According to estimates by the U.S. Central Intelligence Agency, in terms of tonnes of oil equivalent, proven reserves of crude oil in Canada in 2018 accounted for 78.2% of the nation’s fossil fuel reserves, gas for 6.3%, and coal for 15.5% (Figure 5).
There have been various quantitative assessments of oil reserves. According to the Canadian Government’s yearly report, total oil reserves were estimated at 167.7. billion barrels (163.4 billion barrels oil sands) in early 2018; according to the OPEC statistical bulletin 2018 [7], the reserves of conventional oil in Canada were estimated at 3.800 billion barrels in 2017. According to [3,8] the total oil reserves in the country were between 167.8-170,5 billion bbl in 2018.
Table 1. Fossil energy resources of Canada
| Resource / Explanations | Crude oil* | Natural gas* | Coal* | Shale gas** | Tight oil** | Coal mine methane | Extra Heavy Oil & Oil Sands | Oil Shale |
|---|---|---|---|---|---|---|---|---|
| Value | 170.3(10%) | 71.3(0,98%) | 7 255(0,62%) | 572.9 | 8.8 | 44 - 113 | 170.4 | 15 241 |
| Unit | billion barrels | Tcf | million short tons | Tcf | billion barrels | Bcm | billion barrels | million barrels |
| Year | 2021 | 2020 | 2021 | 2013 | 2013 | 2018 | 2010 | 2008 |
| Source | [21] | [21] | [21] | [9] | [9] | [8,10] | [11] | [11] |
*share of the country’s reserves in world total is provided in brackets
**unproved, technically recoverable
The economically competitive production and processing of oil sands compared to conventional varieties is important to the Canadian economy, especially considering the global drop in energy prices in recent years. Canadian engineering and organizational measures have effectively resisted the challenges posed, and the growth of oil sands production in 2014-2015 serves as clear evidence of this [6]. Moreover, Canada has significant reserves of oil shale – about 8.8 billion barrels [9].
Although natural gas and coal reserves in Canada are considerably smaller than its oil reserves, they remain significant. Natural gas reserves are estimated at between 65,4-71 Tcf [6,8] or 2.056 trillion m³ in 2018[3]. In terms of reserves of shale gas, Canada’s reserves are among the top 10 in the world, with a volume of 579.2 Tcf [9].
Total proven coal reserves, according to BP 2021, were estimated at 6 582 million tons in 2020 [8]. According to calculations by Advanced Energy Technologies, the methane utilization potential (according to the methodology based on methane emissions from coal production [10] and its reserves as of 2018 from [8]), was between 44-113 Bcm.
Additionally, Canada has significant reserves and other unconventional fossil resources such as oil shale (kerogen) (Table 1). Several studies have also confirmed the presence of gas hydrates in northern and western Canada [12].
Canada, given its vast territory with diverse climatic zones and natural landscapes, possesses significant potential for the development of various types of renewable energy. A selection of basic indicators of this type of resource is presented in Table 2.
Table 2. Renewable energy resources of Canada
| Resource/ Explanations | Solar Potential (GHI)* | Wind Potential (50 м)* | Hydro energy Potential** | Bio Potential (agricultural area) | Bio Potential (forest area) | Geothermal Potenial | Municipal Solid Waste |
|---|---|---|---|---|---|---|---|
| Value | 3.5-3.8 | 5.0-7.0 | 757 579.6 | 6.8 | 34.1 | 5 000 | 2.33 |
| Unit | kWh/m2/day | m/s | GWh/year | % of land area | % of land area | MWe | per capita/kg/day |
| Year | 2018 | 2018 | 2009 | 2018 | 2018 | 2015 | 2012 |
| Source | [13] | [14] | [15] | [17] | [18] | [18] | [20] |
*for most of the territory of the country
**gross theoretical hydropower potential
The level of solar radiation is low – 3.5-3.8 kWh/m²/day and scattered over most of the country. In the southern region, on the border with the United States, this figure is slightly higher – around 3.8-4.1 kWh/m²/day [13].
The distribution of wind resources is similar: in Canada’s central regions the annual average wind speed is 5.0-7.0 m/sec; a maximum wind speed of more than 8.0 m/sec can be registered on the Canadian Islands and in the North-East of the country [14].
The most valuable resource of renewable energy in Canada is hydropower. The country has a huge hydro potential, second only to China, India, and Brazil [15]. Moreover, in coastal areas, both on the Atlantic and Pacific coasts, there is significant potential for generating energy from ocean waves – 30-60 kW / m per year [16], and tidal energy.
According to data for 2018, 6.8% of the territory of Сanada is occupied by agricultural land, the area of which has been steadily decreasing during the last half-century [17]. There has also been a decrease in forest area to 34.1% of the country's territory in 2018, compared with 38.2% in 2016 [18].
According to [19] Canada has a relatively high potential of geothermal resources, estimated at 5 000 MWe in 2015. This potential is comparable to that of Iceland or New Zealand, known for their effective development of geothermal energy.
This energy review of Canada would not be complete without mentioning municipal waste, which in many countries, particularly in Europe, has become a significant source of energy. Though Canada is not among the leaders in processing municipal solid waste into various kinds of energy, it is, along with the US, the world leader in its generation (2.33 kg/day per person) [20].
Energy Balance
Primary energy consumption in 2020 in Canada was 13.63 Exajoules. This was dominated by oil (31.2%) and natural gas (29.7%), followed by hydroelectric power (25%), nuclear energy (6.4%), coal (3.7%), and renewables (4%) [8].
Canada is one of the world's largest exporters of fossil fuels and their derivatives. Production and exports have risen steadily over the past 15 years (with the exception of coal) (Figure 2). In 2020, according to [21] Canada produced 5 255 thousand barrels of oil per day.
According to the Canadian Energy Fact Book 2021-2022, oil sands production in 2020 was 2.8 MMb/d. Conventional, offshore and tight oil production was 1.6 MMb/d [6].
Source: U.S. Energy Information Administration (Sep 2023) / www.eia.gov
Figure 2. The production and consumption of fossil fuels in Canada (coal —left, gas — in the center, oil — right)
The increase in oil production is driven by oil sands production. Over the last 10 years domestic oil consumption has stabilized and the additional production was exported to the United States. Around 1.8 MMb of crude oil per day is being delivered to Canadian refineries and about 0.8 MMb/d is being exported [6]. The volume of oil consumption in the country has been stable for the last 10 years (Fig.2), reaching 2 192 thousand barrels/day in 2020 (according to [21]) and 2 342 thousand barrels/day in 2020, according to [8].
Unlike oil production, natural gas production decreased significantly over the past 10 years, while consumption grew slightly. According to [21] Canada produced 6 312 billion cubic feet of natural gas in 2019, and 184.7 billion cubic metres in 2018, of which 8.2 Bcf/d was exported to the United States [6,8,5]. Around 42% of Canadian natural gas production is exported. The consumption of natural gas in Canada has shown a steady slight increase over the past twenty years, from 3 121 Bcf in 2001 to 4 397 Bcf in 2019 [21]. According to [8], in 2020 natural gas consumption in the country was 112.6 Bcm.
Coal production in the country has remained practically unchanged since 2001, with slight fluctuations, not exceeding 77.55 million short tons; in 2017 it was 67.64 million short tons. Coal consumption declined during the same period, totalling 40.13 million short tons in 2017 [21].
According to [6], in 2020, coal production totaled 46 Mt, of which 57% was metallurgical coal, and 43% was thermal coal. The main importers of Canadian coal are the countries of South East Asia (Japan, South Korea, and China).
In addition, Canada is one of the world's largest producers and exporters of uranium [6]. The share of uranium in the primary energy production was 16% in 2019 [6].
Electricity production of Canada is dominated by hydro power (Figure 3.). According to the Canadian statistical agency, in 2020 total electricity production was 630 TWh, where hydropower accounted for 60.8%, fossil fuels for 16.5%, nuclear energy for 14.7%, and renewable sources for 8% (Figure 8).
Sources: U.S. Energy Information Administration (Sep 2023) / www.eia.gov | ||
| Figure 3. Electricity production in Canada |
Over the past 15 years the share of fossil fuels has decreased slightly, mainly due to an increase in the share of hydro and renewable power as well as nuclear power. In terms of electricity production from renewable sources, after hydro power, wind energy has the largest share— 32.6 TWh or 7.6% in 2019 [22]. Canada’s position in the comparative diagram of energy index is shown in Figure 4.
| Sources: 1. Crude oil proved reserves, 2021 / International Energy Statistic/Geography / U.S. Energy Information Administration (Nov 2021)*98 2. Natural gas proved reserves 2021 / International Energy Statistic / Geography / U.S. Energy Information Administration (Nov 2021) *99 3. Total recoverable coal reserves 2019 / International Energy Statistic / Geography / U.S. Energy Information Administration (Nov 2021) *81 4. Combination production-consumption for Crude oil 2018 / International Energy Statistic / Geography / U.S. Energy Information Administration (Nov 2021) *219 5. Combination production-consumption for Natural gas 2019 / International Energy Statistic / Geography / U.S. Energy Information Administration (Nov 2021) *123 6. Combination production-consumption for Coal 2019 / International Energy Statistic / Geography / U.S. Energy Information Administration (Nov 2021) *128 7. Electricity – from other renewable sources (% of total installed capacity), 2017 est. / The World Factbook / Library / Central Intelligence Agency *170 8. GDP per unit of energy use (PPP per unit of oil equivalent), 2020 *66 Primary energy consumption - BP Statistical Review of World Energy 2021/BP;GDP (purchasing power parity) - The World Factbook/Library/Central Intelligence Agency 9. Energy use (primary energy use of oil equivalent per capita) 2020 *127 Primary energy consumption – BP Statistical Review of World Energy 2021; Population - United Nations, Department of Economic and Social Affairs, Population Division (2019). World Population Prospects 2019, custom data acquired via website. Retrieved 15 November 2021*66 10. The Global Energy Architecture Performance Index Report (EAPI) 2017 / Rankings / Reports / World Economic Forum 11. Electric power consumption (kWh per capita), 2016 *217 Electricity Consumption - The World Factbook / Library / Central Intelligence Agency; Population - United Nations, Department of Economic and Social Affairs, Population Division (2019). World Population Prospects 2019, custom data acquired via website. Retrieved 15 November 2021 12. Combination of electricity production-consumption (kWh)/The World Factbook/Library/Central Intelligence Agency *216 * Total number of countries participating in ranking Figure 4. Energy indices of Canada |
The first six indices, based on reserves of fossil fuels and export opportunities, show Canada’s significant advantage over most of the world, particularly with regard to oil. In the Energy Architecture Performance Index 2017, which is based primarily on the level of economic growth, environmental safety, and energy independence of the country, including access to energy, Canada placed 32nd: it should be noted that during the last 8 years the country has lost 4 ranking positions.
In a rating from 2017 listing countries by their level of production of electricity from renewable sources (excluding hydropower), Canada was 72nd, out of 170 countries selected for consideration.
Canada ranked 62nd out of 66 countries selected in terms of GDP per unit of energy expended in 2017; however, in terms of energy use per capita the country is 5th in the world and 1st in the region.
In terms of electricity consumption per capita, the country is 6th in the world. For combined electricity production-consumption, Canada is 4th in the ranked list of 216 countries, second to United States in the region.
Energy Infrastructure
A Map showing the territorial distribution of the largest infrastructure projects of the oil sector in Canada is shown in Figure 5.
As mentioned above, oil is Canada’s main fossil fuel resource; Canada does not have extensive reserves of conventional, but is the absolute world leader in terms of oil reserves from oil sands. 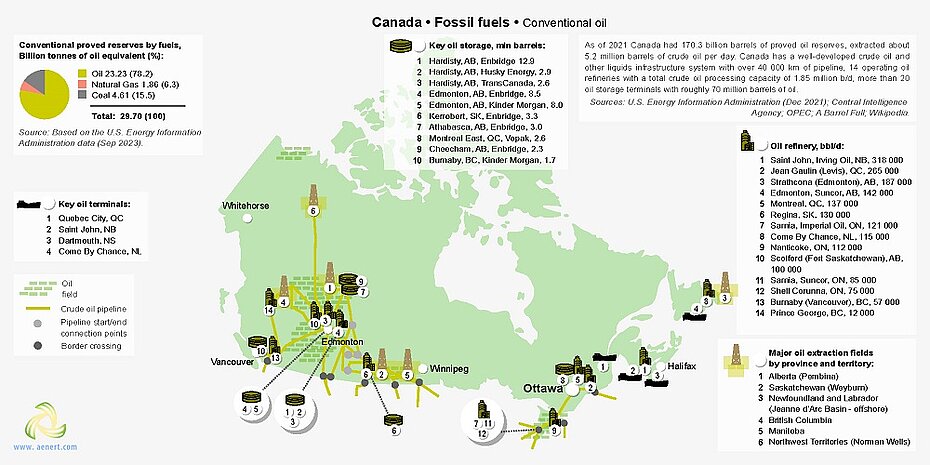
Figure 5. Basic infrastructure facilities of the fossil fuel sector in Canada: conventional oil
It can be difficult to determine the net infrastructure relating solely to oil sands because they are predominately multi-functional. Alberta is the heartland of the oil industry in Canada, and has the largest oil fields. Alberta's share in total oil production in Canada is 80.2% [6].
A highly developed pipeline network delivers oil to the refineries of Canada and the United States. Currently, oil-rich Western Canada is connected by pipelines to the eastern part of the country through the territory of the United States. One of the largest pipelines, the Enbridge Pipeline System, runs from Edmonton to Superior in the US (Edmonton-Regina-Cromer-Superior), and has several lines for pumping various kinds of petroleum liquids (crude conventional oil, synthetic crude oil, condensate, oil products). The total capacity of the pipeline is around 220 000 m³ per day [23]. From Superior, oil is supplied to a network of plants in Sarnia, Ontario. Another major oil pipeline, the Keystone Pipeline System, connects the oil-producing areas of Alberta with a number of facilities in the central areas of the US and Texas. The TransMountain Pipeline connects Edmonton and the West Coast of Canada.
Every day around 1.8 million barrels of oil are processed in Canada [6]. Major refineries are located in the east of the country, as well as in Edmonton. The plant in St. John, managed by Irving Oil, processes around 318,000 barrels of conventional oil per year, and the plant in Quebec, managed by Valero, processes around 265 000 barrels. In addition to Alberta, oil production in eastern Canada has been developing intensively in recent years, particularly in Newfoundland. Some oil is imported from the United States [6].
An overview of the sector of mining and processing of natural gas in Canada is represented below. 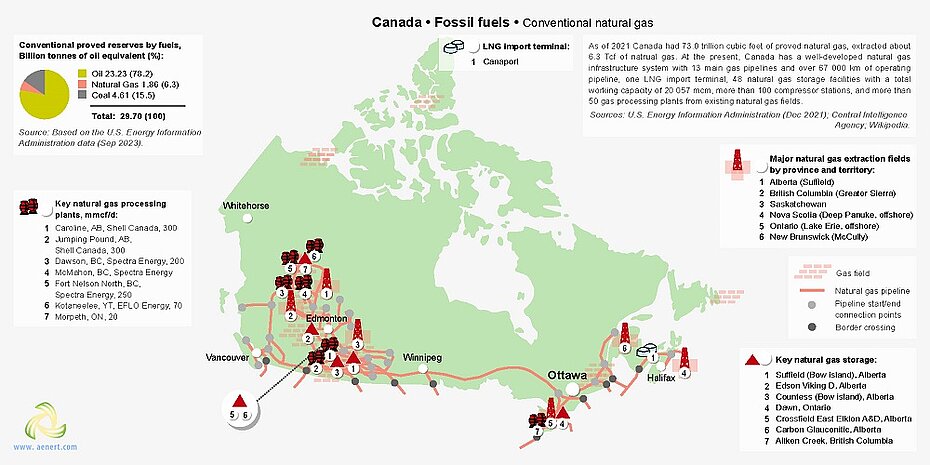
Figure 6. Basic infrastructure facilities of the fossil fuel sector in Canada: conventional natural gas
Similar to the oil industry, the main gas producing region in Canada is Alberta [6], where key gas processing and storage facilities are located. In the total volume of natural gas production, the share of unconventional gas is 84% [6]. From Alberta to the western provinces of Ontario and Quebec, gas is transported via the TransCanada pipeline [24]. The total length of gas pipelines in Canada is more than 67 000 km. In the east of the country there is a single terminal for receiving liquefied natural gas – Canaport.
Figure 7 shows the basic infrastructural elements of Canada's unconventional fossil resources. The pie chart on the map shows the consolidated data on reserves of different types of unconventional fossil fuels in Canada, expressed in tonnes of oil equivalent. Data is collected from various studies found in the attached list of sources. Reserves of coal mine methane (coal bed methane) are calculated through average methane emission volume [10] multiplied by the ratio of the total coal reserves and the volume of its average annual production. According to the diagram, the shale gas reserves are comparable to oil sands reserves. Other fossil fuels are substantially smaller.
Most of the infrastructure is concentrated in Alberta and in the provinces of Saskatchewan and British Columbia. The largest areas of oil sands production are Athabaska, Peace River and Cold Lake. Oil sands and synthetic crude oil production is concentrated in Fort McMurray [25].
Production is carried out via two methods – production (mining), and underground production (in-situ). The most widespread technology for the underground mining of oil sands and heavy oil is SAGD (steam-assisted gravity drainage), which was developed in Canada. The extraction and processing of unconventional oil in Canada is carried out by companies such as Syncrude Canada, Suncor Energy, Canadian Natural Resources, Imperial Oil, Cenovus, Husky Energy, and the Canadian divisions of many international companies. 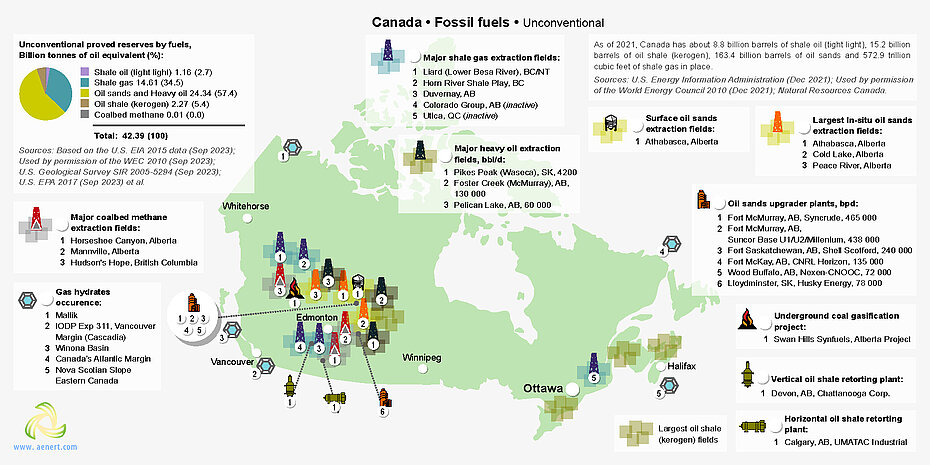
Figure 7. Basic infrastructure facilities of the fossil fuel sector in Canada: unconventional resources
The sharp decline in international oil prices, environmental concerns, and severe fires in Fort McMurray in the spring of 2016, have had a negative effect on the economy. Shale gas and coal mine methane are being mined in the provinces of Alberta and British Columbia. Shale gas production is also carried out in western Canada.
Figures 8 and 9 show the major sites in Canada for producing electrical energy. The share of fossil fuels in the production of electricity in Canada is 16.5%. Around 61% comes from hydro power, and 14.7% from nuclear power (Figure 8). In 2020, 67.2 TWh of electricity was exported, with imports at 9.8 TWh [6]. In provinces with large resource bases of fossil fuels such as Alberta, Saskatchewan, and Nova Scotia, electricity production mainly comes from coal, gas, or oil. In Quebec, Yukon, British Columbia and some other provinces, hydro power is dominant.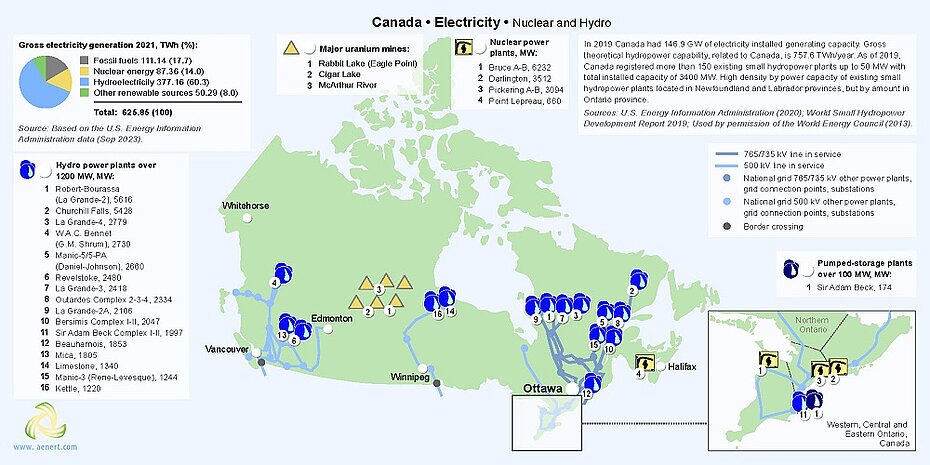
Figure 8. Electricity production of in Canada: hydro power and nuclear energy
Canada has 20 hydro power plants with a capacity of over 1 GW. Two hydroelectric stations – Robert-Bourassa in Quebec City and the Churchill Falls Generating Station in Newfoundland and Labrador - have a capacity of more than 5 GW each. The Bruce Nuclear Generating Station is Canada’s largest nuclear power plant, producing 7.27 GW [26]. Small hydro power (with a total capacity of more than 3.3 GW) is making a significant contribution to electricity generation in Canada.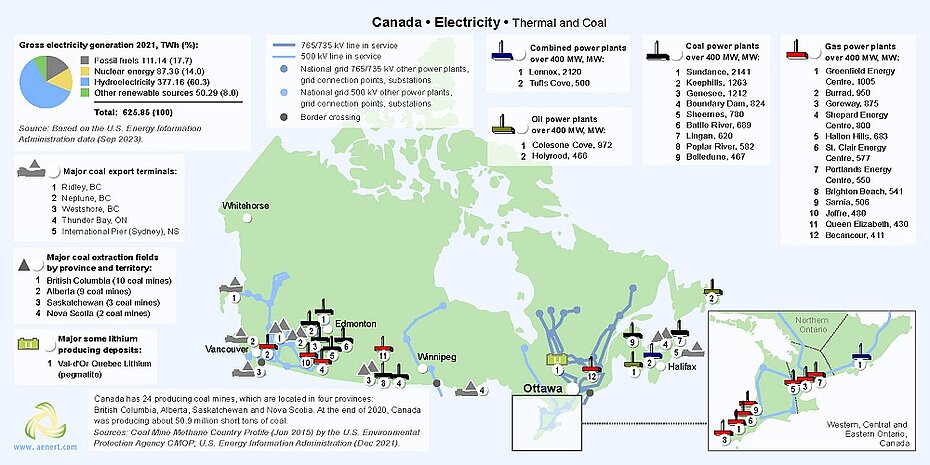
Figure 9. Electricity production in Canada: thermal power plants
The largest thermal power plant is the Sundance Power Station in Alberta, with a capacity of 2.14 GW [26]. There are several high-voltage power lines (765/735 and 500 kW) in operation in Canada. The share of renewable energy in electricity production in Canada, with the exception of hydro power, is relatively low – 8% (Figure 9), however wind and solar photovoltaic (PV) energy are the fastest-growing sources of electricity generation in the country [6].
The largest energy providers in Canada are Ontario Power Generation, Hydro-Québec, and BC Hydro.
Figures 10 and 11 show the main Canadian infrastructure facilities for energy production from renewable sources. As noted above, renewable energy in Canada, excluding hydro power, does not have a significant share in total energy production [27]. This is due to the presence of rich deposits of fossil fuels, and in partly to the diffuse resource allocation of renewable energy across the country. The level of solar radiation in the most densely populated areas of southern Canada is on average 3.5-3.8 kWh / m² per day. There are 138 solar PV farms in Canada with a capacity of at least 1 MW, totaling over 2,000 MW [6]. Areas of high wind activity Canada’s Pacific and Atlantic coasts, as well as in the Gulf of Hudson Bay, are often remote and sparsely populated, hindering the development of wind energy. Technologies that extract energy from tidal and other ocean resources are still at an industrial development stage. However, in Canada there are many medium-power wind farms, solar plants for photovoltaic technology, and even tidal power (Annapolis Tidal Station, 20 MW). In the last decade, there has been a steady increase in new wind and solar energy capacity. Some of these parks are shown in Figure 10.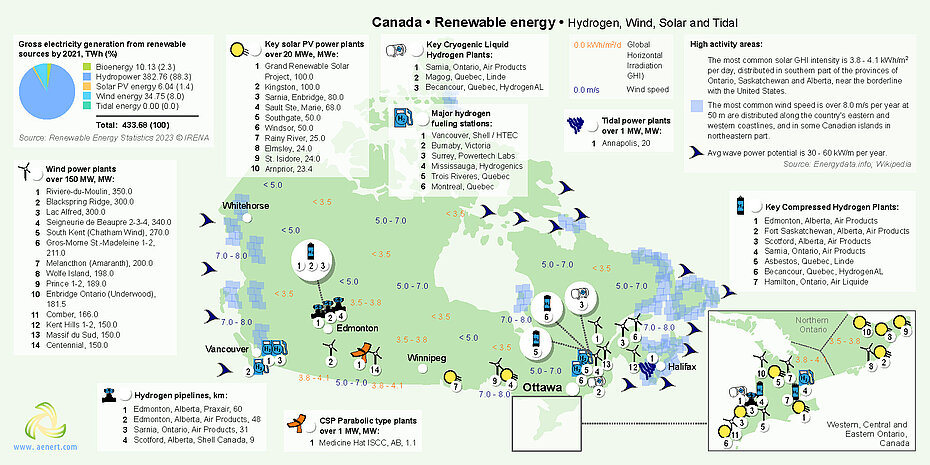
Figure 10. Renewable energy in Canada: wind, solar, and tidal energy.
Bioenergy has also been developing relatively quickly in Canada. Given the country’s significant forest resources, the production of various types of wood-derived raw materials for direct combustion (such as firewood, solid wood waste, and pellets), as well as slow pyrolysis (torrefaction) and fast pyrolysis technologies and biomass gasification are actively developing.
Biodiesel production and ethanol generation is widespread in Canada. There are relatively few large enterprises for biogas production and landfill gas production.
The Enercem company has successfully implemented thermochemical technology for second-generation bioethanol. The company's largest plant, which opened in Edmonton in 2014, is capable of processing municipal waste into methanol or ethanol with a capacity of 38 million litres per year [28].
Canada is among the countries that are actively developing hydrogen production technologies with an estimated 3 Mt of hydrogen produced per year [6]. There are around 10 hydrogen filling stations. One of the world's largest hydrogen pipelines, the Edmonton and Scotford Hydrogen Pipeline, operated by Praxair Air Product, Shell, is in Alberta [29]. In eastern Canada, in areas of high wind activity, companies have implemented several projects to produce hydrogen from electricity generated by wind turbines [30,31]. Canada is among the top 10 manufacturers of fuel cells and hydrogen production by volume [29,32].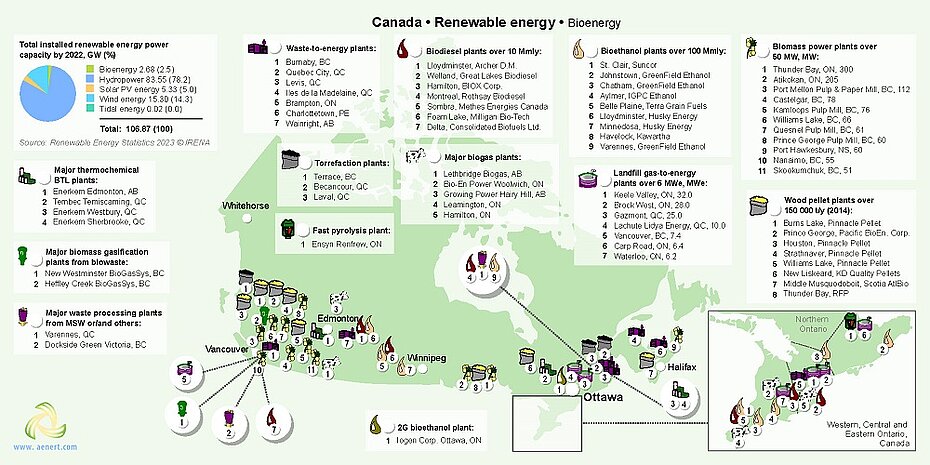
Figure 11. Renewable energy in Canada: bioenergy.
A summary of the development of energy infrastructure in Canada is presented in Figure 12.
This map necessarily shows only a small part of energy development in Canada. However, it is indicative of the main target areas of development. The first thing to note is the development of transport infrastructure for the oil and gas industries. These projects could dramatically improve Canada's export opportunities. Net additional pipelines from Alberta to both oceanic coasts (Enbridge Northern Gateway and Energy East), and the expansion of pipelines to the US (TransCanada Keystone XL) were key to these projects. The main opponents of the construction of these projects were various environmental organizations in both Canada and the United States, and even internationally.
The Enbridge Northern Gateway Project involved the construction of a twin pipeline running 1177 km from Alberta to the Pacific coast. To the west, the deepwater port of Kitimat planned to deliver 525 000 barrels of oil per day. The total project cost was $5.5 billion [33, 34]. In 2016, the government determined that the project could cause significant negative environmental impacts and canceled it.
The Energy East was a proposed pipeline intended to ensure a reliable supply of oil from Alberta to the eastern regions of Canada, including refineries and a new terminal in St. John. The pipeline would have been 4600 km long with a maximum capacity of 1.1 million barrels per day. The project envisaged modernising individual sections of the existing gas pipeline to transport oil. The total cost of the project was estimated at $15.7 billion. TransCanada is ready to begin construction in 2018 and complete the project in 2020, but the project was cancelled in 2018 [35, 36, 37, 38].
The Keystone XL project was under consideration for more than ten years. A 1897 km long pipeline was to connect Hardisty, Alberta, and Steele City, Nebraska USA. On the 6th of November 2015 the project was rejected by US President Barack Obama. TransCanada maintained "commitment to the implementation of the project" for some time, but in June 2021, the Keystone XL pipeline project was terminated [39, 40, 41].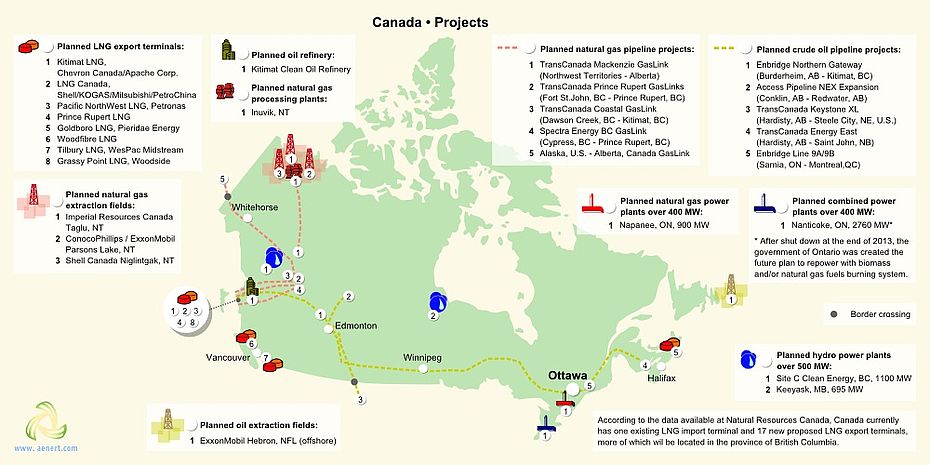
Figure 12. Some of the projects of energy infrastructure development in Canada.
Another important area of energy infrastructure development in Canada is the construction of export terminals of liquefied natural gas. The objectives of this project are similar to those of the oil transport infrastructure – to provide optimal conditions for Canadian gas producers through the expansion of export capacity. In total, there are more than two dozen projects, both on the west coast of British Columbia and in the east. However, only three companies are ready to implement their projects in the port of Kitimat, with a total capacity of more than 40 million tons per year. More projects are announced in Prince Rupert with total planned capacity of more than 90 million tons. A number of projects on the east coast of Canada with a total capacity of 50 million tonnes, are planned [42]. It is likely that the implementation of these large-scale projects will not take place; the trends of future developments are clear.
Several other projects, including projects in the field of oil and gas production, are shown on the map in Figure 12.
Education and Innovation
The set of indices reflecting the position of Canada among other countries in the field of education and innovation can be seen in Figure 13.
As follows from the graphs in Figure 13, Canada is one of the world leaders by this measure In the ranking of countries by the Global Innovation Index 2021 Canada was 16th in the world (see diagram). According to the number of patents granted to Canadian nationals, both domestically and abroad, the country ranks 13th in the world. Similarly, by number of patents in force, the country was 15th in the world, indicating the country's favourable conditions for innovation.
In terms of government expenditure on education as a percentage of the country's GDP, the country demonstrates a result higher than the world average – 65th out of 169 countries selected for consideration. 28 Canadian universities are included in the rating of the world leading universities – “QS University Rating”, it is also worth noting that the country's GDP is high, therefore, in absolute terms the level of government expenditure on education is considerable. In terms of public expenditure on research and development as a percentage of GDP, Canada is 20th, behind a number of European countries. Canada is very well positioned when considering the number of publications of specialists in scientific and technological journal and patent activities. Canada is 9th out of 240 participating countries in the Scimago ranking, and in Scientific and Journal Activities it is ranked 12th out of 197 countries. The country is also among the leaders in the region in terms of the number of Internet users.
In Canada, there are about 60 universities training specialists in the fields of energy. The most notable among these is the University of Toronto, which offers training programs in various engineering specialties including Mineral Engineering, Chemical Engineering, Civil Engineering, etc. British Columbia University, McGill University, and the University of Alberta are also renowned in the international academic arena.
| Sources: 1. The Global Innovation Index 2021, Rankings / Knowledge / World Intellectual Property Organization / Cornell University, INSEAD, and WIPO (2021): Energizing the World with Innovation. Ithaca, Fontainebleau, and Geneva *132 2. Patent Grants 2011-2020, resident & abroad / Statistical country profiles / World Intellectual Property Organization *185 3.Patents in Force 2020 / Statistical country profiles / World Intellectual Property Organization *109 4. QS World University Rankings 2022 *97 5. SCImago Country Rankings (1996-2020) / Country rankings / SCImago, (n.d.). SIR-SCImago Journal & Country Rank [Portal]. Retrieved 17 Nov 2021 *240 6. Internet users in 2018 / The World Factbook / Central Intelligence Agency *229 7. Internet users in 2018 (% Population) / The World Factbook / Central Intelligence Agency *229 8. Government expenditure on education, total (% of GDP), 2019 / United Nations Educational, Scientific, and Cultural Organization (UNESCO) Institute for Statistics. License: CCBY-4.0 / Data as of September 2021*177 9. Research and development expenditure (% of GDP), 2018 / UNESCO Institute for Statistics. License: CCBY-4.0 / Data *119 10. Scientific and technical journal articles, 2018 / National Science Foundation, Science and Engineering Indicators. License: CCBY-4.0 / Data *197 * Total number of countries participating in ranking Figure 13. The indices of education and innovation in Canada |
In the sphere of patents in advanced energy technologies, Canada is often among the top 10 leaders, after the US and China. In the field of synthetic fuel production, leaders in patenting among Canadian companies are Shell Canada Ltd, Expander Energy Inc, Enerkem Inc, Alter NRG Corp. Research and development in this field is carried out by the University of Alberta, the University of Calgary, the University of Saskatchewan. In the field of extraction and processing of unconventional oil, including directional drilling and hydraulic fracturing, patenting leaders among Canadian companies are Schlumberger Canada Limited, Suncor Energy, Imperial Oil Resources Ltd., Shell Canada Energy and Syncrude Canada Limited. Research and development in the same area is carried out most actively at the University of Calgary, the University of Alberta, the University of Waterloo and the University of Regina.
Another area where Canada is among the five world leaders in the number of patents granted in recent years is in the production of coal bed methane. The main patent holders are Schlumberger Canada Limited, Presssol Ltd, as well as ENFRAC Inc. and NCS Oilfield Services Canada Inc. Schlumberger Canada Limited, Ocean Floor Geophysics patent their research in the field of gas hydrates, the Geological Survey of Canada, the University of Victoria, Natural Resources Canada are conducting research in this area. In the field of associated gas Schlumberger Canada Limited and Gasfrac Energy Services Inc should be mentioned. Leading research organizations in this field are the Carleton University, École Polytechnique de Montréal. In the field of hydrocarbon production from reservoirs with low permeability – Schlumberger Canada Limited, Trican Well Service, Packers Plus Energy Services, Inc., Shell Canada Ltd and the following research agencies are actively engaged in research: the University of Calgary, the University of Alberta, Encana Corporation, the University of British Columbia.
Notable enterprises in the field of bioenergy include Greenfield Specialty Alcohols Inc., Enerkem Inc., Anaergia Inc., Greenfield Ethanol Inc., Iogen Corporation. The University of Saskatchewan, the University of British Columbia, and École Polytechnique de Montréal lead in the number of publications in this field.
A large number of Canadian companies patent technical solutions in the field of energy production from renewable sources. In the field of solar energy Morgan Solar, Inc., Magna International, Inc., SHEC Labs – Solar Hydrogen Energy Corporation. Leading research organizations in this field are the University of Ontario, the University of Ottawa, the Carleton University. Marmen Inc., Maxiflow Manufacturing Inc., Magna International, Inc. are all ahead in the number of patents in the field of wind power; research in this field is being conducted by the University of Calgary, the University of Waterloo, and the University of Toronto.
Ecology and Environment Protection
A diagram of environmental indices is shown in Figure 14.
This diagram is dramatically different from the previous graphs as four of the nine selected indices are situated in the red part of the graph. Canada is among the "leaders" in the amount of carbon dioxide emission, methane emission and deforestation. These indicators have intensified the wave of environmental protests against the aforementioned construction of new pipelines, as it may stimulate additional development and production of oil sands and shale oil, which many consider to be sources of negative environmental impacts on Canada.
In terms of methane emissions Canada is among the countries with the worst indicators; this is further complicated by the fact that the other countries with high levels of methane emissions have populations much larger than Canada, for example, Brazil, China, Russia, India, Indonesia, and Iran. Almost all of these countries are both large producers and consumers of fossil fuels. It is necessary to re-state the very low level of GDP per unit of energy use in Canada. High energy costs for the production of GDP largely determine the level of such emissions in Canada, along with energy intensive steam-assisted gravity drainage (SAGD) technology.
| Sources: 1. CO2 total emission by countries 2020 / European Commission / Joint Research Centre (JRC) / Emission Database for Global Atmospheric Research (EDGAR)*208 2. CO2 per capita emission 2020/European Commission/Joint Research Centre (JRC) / Emission Database for Global Atmospheric Research (EDGAR) *208 3. Forest area 2020 (% of land area) / The Global Forest Resources Assessment 2020 / Food and Agriculture Organization of the United Nations *234 4. Forest area change 2010-2020 (1000 ha/year) / The Global Forest Resources Assessment 2020 / Food and Agriculture Organization of the United Nations *234 5. The Environmental Performance Index (EPI) 2020 / Rankings / Yale Center for Environmental Law & Policy / Yale University *180 6. Annual freshwater withdrawals (m3 per capita), 2017 *179 Annual freshwater withdrawals, total (billion m3), 2017 – Food and Agriculture Organization, AQUASTAT data. /License: CC BY-4.0; Population – United Nations, Department of Economic and Social Affairs, Population Division (2019). World Population Prospects 2019, custom data acquired via website. Retrieved 15 November 2021 7. The National Footprint Accounts 2017 (Biocapacity Credit / Deficit) / Global Footprint Network *188 8. Methane emissions (kt of CO2 equivalent), 2018 / Data for up to 1990 are sourced from Carbon Dioxide Information Analysis Center, Environmental Sciences Division, Oak Ridge National Laboratory, Tennessee, United States. Data from 1990 are CAIT data: Climate Watch. 2020. GHG Emissions. Washington, DC: World Resources Institute. Available at: License : Attribution-NonCommercial 4.0 International (CC BY-NC 4.0) *191 9. The Climate Change Performance Index (CCPI) 2022 / Overall Results / Jan Burck, Thea Uhlich, Christoph Bals, Niklas Höhne, Leonardo Nascimento / Germanwatch, NewClimate Institute & Climate Action Network *60 * Total number of countries participating in ranking Figure 14. Environmental Indices of Canada |
Canada ranks 31st of the 60 countries responsible for more than 90% of global CO2 emissions related to energy in the Climate Change Performance Index (CCPI) 2022.
In terms of forest area as a percentage of the country, Canada was 90th in the world in 2020; however, the trend associated with its change from 2010-2020 looks very negative; according to this indicator the country is 201st in the world.
The situation is brightened by Canada’s very high rating in the Environmental Performance Index rankings (EPI) 2020, which focuses primarily on assessing the environmental performance of national governments. Here, the country is 20th out of 180 countries.
The overall negative picture is mitigated by the Ecological Footprint Atlas rating, according to which Canada is among a number of ecological creditors.
References
[1] List of sovereign states and dependencies by area / Wikipedia / en.wikipedia.org/wiki/List_of_sovereign_states_and_dependencies_by_area
[2] List of countries and dependencies by population density / Wikipedia / en.wikipedia.org/wiki/List_of_countries_and_dependencies_by_population_density
[3] Canada / The world factbook / Library / Central Intelligence Agency / www.cia.gov
[4] GDP, PPP (constant 2011 international $) / World Bank, International Comparison Program database. License: CC BY-4.0 / Data / The World Bank / www.worldbank.org
[5] GDP per capita, PPP (current international $)/ World Bank, International Comparison Program database. License: CC BY-4.0 / Data / The World Bank / www.worldbank.org
[6] Energy fact Book 2021-2022 (PDF) / National Resources Canada / www.nrcan.gc.ca
[7] OPEC Annual Statistical Bulletin 2018 (PDF) / OPEC / www.opec.org
[8] BP Statistical Review of World Energy 2021 (PDF) / BP / www.bp.com
[9] World Shale Resource Assessments (PDF)/ U.S. Energy Information Administration (11/28/2018 )/ www.eia.gov
[10] 2006 IPCC Guidelines for National Greenhouse Gas Inventories, Volume 2, Energy, Fugitive Emissions (PDF) / The Intergovernmental Panel on Climate Change (IPCC) / www.ipcc-nggip.iges.or.jp
[11] 2010 Survey of Energy Resources (PDF) / World Energy Council / www.worldenergy.org/
[12] Database of Worldwide Gas Hydrates / woodshole.er.usgs.gov
[13] Solar resource data obtained from the Global Solar Atlas, owned by the World Bank Group and provided by Solargis / Global Solar Athlas / globalsolaratlas.info
[14] Wind Map / Global Wind Atlas 2.0, a free, web-based application developed, owned and operated by the Technical University of Denmark (DTU) in partnership with the World Bank Group, utilizing data provided by Vortex, with funding provided by the Energy Sector Management Assistance Program (ESMAP). For additional information: globalwindatlas.info
[15] 2013 Survey of Energy Resources (PDF) / World Energy Council / www.worldenergy.org
[16] Wave power / Wikipedia / en.wikipedia.org/wiki/Wave_power
[17] Agricultural land (% of land area) / Food and Agriculture Organization, electronic files and web site. License: CC BY-4.0 / Data / The World Bank / www.worldbank.org
[18] Forest area (% of land area) /Food and Agriculture Organization, electronic files and web site. License: CC BY-4.0 / Data / The World Bank / www.worldbank.org
[19] 2016 Annual U.S. & Global Geothermal Power Production Report (PDF) / Geothermal Energy Association / geo-energy.org
[20] What a Waste2012 (PDF) / World Bank / siteresources.worldbank.org
[21] International Energy Statistic / Geography / U.S. Energy Information Administration / www.eia.gov/beta/international/
[22] Renewable Energy Statistics 2021 (PDF) / IRENA / www.irena.org
[23] Enbridge Pipeline System / Wikipedia / en.wikipedia.org/wiki/Enbridge_Pipeline_System
[24] Facts and Figures / TransCanada / www.transcanada.com
[25] Athabasca oil sands / Wikipedia / en.wikipedia.org/wiki/Athabasca_oil_sands
[26] List of generating stations in Canada / Wikipedia / en.wikipedia.org/wiki/List_of_generating_stations_in_Canada
[27] Statistics Canada / www.statcan.gc.ca/fra/commerce/donnee
[28] Enerkem / enerkem.com
[29] The Hydrogen Analysis Resource Center / hydrogen.pnl.gov
[30] Ramea Island / Wind-Hydrogen-Diesel on Ramea Island / Natural Resources Canada / www.nrcan.gc.ca
[31] PEI Wind-Hydrogen Village Project / Prince Edward Island / www.princeedwardisland.ca
[32] The Fuel Cell and Hydrogen Annual Review, 2015 (PDF) / H2FCSUPERGEN / www.h2fcsupergen.com
[33] Northern Gateway announces it will not appeal recent federal Court of Appesl decision that reversed project approval / September 20, 2016 / ENBRIDGE / www.enbridge.com
[34] Enbridge Northern Gateway Pipelines / Wikipedia / en.wikipedia.org/wiki/Enbridge_Northern_Gateway_Pipelines
[35] TransCanada announces major contract for Energy East pipeline / Feb 03, 2016 / CBC News / www.cbc.ca
[36] Energy East pipeline ‘will happen,’ but taking too long: Arthur Irving / OCTOBER 21, 2016 / The Globe and Mail / www.theglobeandmail.com
[37] Energy East Pipeline Project / TransCanada / www.transcanada.com
[38] Energy East pipeline / Wikipedia / en.wikipedia.org/wiki/Energy_East
[39] Keystone XL Pipeline Project / TransCanada / www.transcanada.com
[40] The Keystone XL Pipeline Project / Keystone XL / www.keystone-xl.com
[41] The Keystone Pipeline System / Wikipedia / en.wikipedia.org/wiki/Keystone_Pipeline
[42] Energy fact Book 2016-2017 (PDF) / National Resources Canada / www.nrcan.gc.ca
The sources of charts and curves are specified under the images.
For more information about the energy industry in Canada see here
