
Contents
General State of the Economy
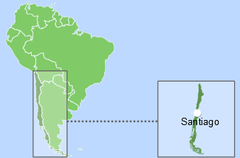
Chile, the official name – the Republic of Chile, is located in the south-western part of South America, and occupies a narrow strip between the ridges of the Andes and the Pacific Ocean. It borders Argentina (in the east), Peru (in the north), and Bolivia (in the north-east). In terms of size, Chile is 37th in the world and 6th in the region [1]. Chile’s population density is less than Brazil and Venezuela, and is 196th in the world, with an average density of 26 people per 1 km2 [2]. The length of the country’s coastline is 6 435 km [3].
| Republic of Chile/ República de Chile | ||
|---|---|---|
| Capital: Santiago | Density: 24/km2 | Currency: Chilean peso (CLP) |
| Official languages: Spanish | Life expectancy at birth: 79.38 years | GDP (PPP): $597.520 billion (2023 est.) |
| National Day: 18 September | Area: 756,096 km2 | GDP - per capita (PPP): $29,934 (2023 est.) |
| Population: 18,549,457 (2023 est.) | Coastline: 6,435 km | Internet country code: .cl |
Source: [1,2,3,4,5]
The administrative map of Chile is divided into 15 regions, the official language is Spanish, and the political form of government is presidential republic [3].
| Sources: 1. GDP (purchasing power parity), 2020 est. / The World Factbook/Library/Central Intelligence Agency *228 2. GDP - per capita (PPP), 2020 / The World Factbook/Library/Central Intelligence Agency *229 3. Inflation rate (consumer prices), 2019 est. / The World Factbook/Library/Central Intelligence Agency *228 4. Charges for the use of intellectual property, receipts (BoP, current US$), 2020 / International Monetary Fund, Balance of Payments Statistics Yearbook, and data files. / License: CC BY-4.0 *88 5. The Global Competitiveness Index 2019 / Rankings / Reports / World Economic Forum *141 6. High-technology exports (current US$) 2019-2020 / United Nations, Comtrade database through the WITS platform / License: CCBY-4.0 / Data *134 7. 2021 Index of Economic Freedom / International Economies / The Heritage Foundation *178 8. Reserves of foreign exchange and gold, 2017 est. / The World Factbook / Library / Central Intelligence Agency *195 9. Annual average GDP growth in %, for the last 10 years (2011-2020) / World Bank national accounts data, and OECD National Accounts data files / License: CC BY-4.0 *206 10. Public debt (% of GDP), 2017 est. / The World Factbook / Library / Central Intelligence Agency(from smallest to largest) *210 * Total number of countries participating in ranking Figure 1. Economic Indices of Chile |
Chile’s economy is one of the fastest growing in Latin America. Export of goods and services makes up one third of the volume of GDP; copper exports alone provide 20% of revenues [3]. Economic indices of Chile are shown on the diagram below, and the majority of indicators are in the upper part of the chart, indicating a high level of economic development of the country.
Between 2009 and 2019 the country experienced a steady growth of GDP at purchasing power parity, both in general and per capita [4,5]. In 2020 GDP at PPP was 445.8 billion dollars (45th in the world) [3]. GDP at purchasing power parity per capita is significantly lower (81st in 2020), demonstrating negative dynamics: from $25,000 in 2018 to $23,300 in 2020 [3]. Inflation in Chile in 2019 was at 2.2%, a slight decrease from 2.7% in 2018 [3].
According to the Global Competitiveness Report 2019, presented by the World Economic Forum, Chile is 33rd, from an estimated total of 141 countries. This rating reflects the effectiveness of the use of the country’s own resources for sustainable development. In addition to numerous economic indicators this index also takes into account such variables as education, health, level of innovation, etc.
In the ranking of countries according to the level of ex-port of high-technology products in 2019-2020, Chile was 56th out of 134 countries. In terms of gold reserves and foreign exchange reserves in 2017 Chile was 44th in the world.
According to the Index of Economic Freedom 2021, which is based on business freedom, freedom from government action, protection of property, and freedom from corruption, Chile was 19th, ahead of Peru. According to the indicator for the average GDP growth in percentage over the last 10 years, in 2020 the country was 111th out of 206 countries. In terms of public debt, calculated as a percentage of the country's GDP, Chile was ranked 182nd out of 210 countries considered in 2017.
Energy Resources
Chile has insignificant reserves of fossil fuels (Table. 1). In terms of tons of oil equivalent, proved reserves of conventional hydrocarbons in Chile are: coal – 88.4%, natural gas – 9.4%, oil – 2.2% (Figure 5).
Proved oil reserves in Chile [6], at the end of 2021 were estimated at 200 million barrels, while proven reserves of natural gas amounted to 3.5 Tcf.
According to [3], in 2021 proven oil reserves, totalled 150 million barrels, and 97.97 Bcm of natural gas.
Table 1. Fossil energy resources of Chile
| Resource / Explanations | Crude oil | Natural gas | Coal | Shale Gas* | Tight Oil* | Coal mine methane | Extra heavy oil |
|---|---|---|---|---|---|---|---|
| Value | 200 | 3.5 | 1 302 | 48.5 | 2.3 | no date | no date |
| Unit | million bbl | Tcf | million short tonnes | trillion cubic feet | billion bbl | - | - |
| Year | 2021 | 2021 | 2021 | 2013 | 2013 | - | - |
| Source | [6] | [6] | [6] | [7] | [7] | - | - |
*unproved technically recoverable
Coal reserves are mainly concentrated in the central and southern part of the country, and according to [6] in 2021 were estimated at 1302 billion short tons.
In addition to the small reserves of conventional hydrocarbon resources, the country has shale gas reserves and tight oil reserves (Table 1). There have been also gas hydrate occurrences discovered in the central part of the country on the Сhilean continental margin (Figure 5).
In Chile, there is a certain potential for the development of some types of renewable energy. A selection of basic indicators of this type of resource is presented in Table 2. The level of direct solar radiation in Chile is relatively high in the northern part of the country. The highest level of solar radiation level can be observed in the north-east of the country on the border with Bolivia and Argentina - over 9.5 kWh/m2/day. In the central part of the country, from Copiapo to Puerto Montt and along the coast, the level of direct solar radiation drops from 6.8 to <5.5 kWh/m2/day. In the south of the country these figures are even lower [8].
The distribution of wind resources is as follows: in the north and in the central part of the country the average annual wind speed is between 4.8-6.4 m/sec [8]. The maximum registered wind speed was in the south-western coastal areas of the country, where it may exceed 8.5 m/sec (at a height of 50 m.) [9]. It should be noted that this is one of the windiest places on the planet.
More than 24.5% of Chile is forested with 21.1% covered by agricultural land [10,11]. This resource has the potential to play a valuable role in energy production.
Table 2. Renewable energy resources of Chile
| Resource/ Explanations | Solar Potential (DNI)* | Wind Potential (50 м)* | Hydro energy Potential** | Bio Potential (agricultural area) | Bio Potential (forest area) | Municipal Solid Waste |
|---|---|---|---|---|---|---|
| Value | 5.5-6.8 | 4.8-6.4 | 162 | 21.1 | 24.5 | 1.15 |
| Unit | kWh/m2/day | m/s | GWh/year | % of land area | % of land area | kg/per capita/day |
| Year | 2018 | 2018 | 2011 | 2020 | 2020 | 2016 |
| Source | [8] | [9] | [13] | [10] | [11] | [15] |
*for most of the territory of the country
**gross theoretical hydropower potential
Most Chilean rivers belong to the basin of the Pacific Ocean. The Huasco, the Limar, and the Rapel are relatively full-flowing and are widely used for irrigation and power generation [12].
Gross theoretical hydropower potential of the country amounts to 162 GWh/year, which in comparison with other countries of Latin America appears small, and for this indicator only Uruguay has a lower figure in the region [13].
In the south of Chile, there is a significant potential for tidal energy, which can reach 60 kW/m [14].This energy review of Chile would not be complete without mentioning municipal waste (1.15 kg per capita per day), which in many countries has become a significant source of energy [15].
Energy Balance
Primary energy consumption in Chile in 2021 was at the level of 1.66 exajoules and was dominated by oil — 44%, renewable energy — 17.5%, coal — 15.7%, natural gas — 13.9%, hydro— 9.6% [16].
Chile is the only Latin American state that is a member of the OSCE. The country is the fifth largest consumer of energy in the region, but due to minor fossil fuel reserves, is heavily dependent on imports [17]. Since 2005, the volume of energy imports increased by more than 44%, and in 2015 amounted to 27.721 thousands net tons [18]. Coal makes up most of the imports of energy resources (over 35%) followed by oil (30%); the main exporters are the United States and Australia, and in the region - Brazil and Ecuador [18].
The volume of oil consumption in Chile from 2001 to 2016 increased by almost 1.5 times [19] (Figure 2). According to [6], refined petroleum products consumption in Chile in 2021 amounted to 367 thousand bbl/day, with domestic production petroleum and other liquids about at around 19 thousand bbl/day. Oil imports in 2018 were 172 700 bbl/day [3] and 146 000 bbl/day in 2020 [6].
Consumption of gas over the past 10 years has gradually decreased, having undergone a serious drop from 2007 to 2009, and in 2021 reached the level of 239 Bcf, while importing 4.602 Bcm in 2021 [3]. Natural gas production in 2021 was 48 Bcf or 1,1 Bcm [3].
In 2015, Chile imported 9873 thousand net tons of coal, which came mainly from the US and Colombia, while exporting 1 143 thousand tons [18]. It is worth noting that consumption grew from 0.63 in 2003 to 3.49 in 2018 million short tons, and again decreased to 0.02 in 2021 [19].
Source: U.S. Energy Information Administration (Sep 2023)/ www.eia.gov
Figure 2. The production and consumption of fossil fuels in Chile (coal – left, gas – in the center, oil – right)
Chile has a relatively high share of conventional resources in the production of electricity (Fig. 3).
According to the U.S. Energy Information Administration (Fig.6) in 2021, the country produced about 84.68 TWh of electricity, of which 52.0% was by thermal power plants, 19.5% by hydroelectric power plants and 28.5% by other renewable energy sources.
Source: U.S. Energy Information Administration (Sep 2023) / https://www.eia.gov/ | ||
| Figure 3. Electricity production in Chile |
Chile’s position in the comparative diagram of energy index is shown in Figure 4. Three indices based on production-consumption indicators of fossil fuels, are located at the bottom of the chart. Also, Chile has a large imbalance between production and consumption of oil and gas.
| Sources: 1. Crude oil proved reserves, 2021 / International Energy Statistic/Geography / U.S. Energy Information Administration (Nov 2021)*98 2. Natural gas proved reserves 2021 / International Energy Statistic / Geography / U.S. Energy Information Administration (Nov 2021) *99 3. Total recoverable coal reserves 2019 / International Energy Statistic / Geography / U.S. Energy Information Administration (Nov 2021) *81 4. Combination production-consumption for Crude oil 2018 / International Energy Statistic / Geography / U.S. Energy Information Administration (Nov 2021) *219 5. Combination production-consumption for Natural gas 2019 / International Energy Statistic / Geography / U.S. Energy Information Administration (Nov 2021) *123 6. Combination production-consumption for Coal 2019 / International Energy Statistic / Geography / U.S. Energy Information Administration (Nov 2021) *128 7. Electricity – from other renewable sources (% of total installed capacity), 2017 est. / The World Factbook / Library / Central Intelligence Agency *170 8. GDP per unit of energy use (PPP per unit of oil equivalent), 2020 *66 Primary energy consumption - BP Statistical Review of World Energy 2021/BP;GDP (purchasing power parity) - The World Factbook/Library/Central Intelligence Agency 9. Energy use (primary energy use of oil equivalent per capita) 2020 *127 Primary energy consumption – BP Statistical Review of World Energy 2021; Population - United Nations, Department of Economic and Social Affairs, Population Division (2019). World Population Prospects 2019, custom data acquired via website. Retrieved 15 November 2021*66 10. The Global Energy Architecture Performance Index Report (EAPI) 2017 / Rankings / Reports / World Economic Forum 11. Electric power consumption (kWh per capita), 2016 *217 Electricity Consumption - The World Factbook / Library / Central Intelligence Agency; Population - United Nations, Department of Economic and Social Affairs, Population Division (2019). World Population Prospects 2019, custom data acquired via website. Retrieved 15 November 2021 12. Combination of electricity production-consumption (kWh)/The World Factbook/Library/Central Intelligence Agency *216 * Total number of countries participating in ranking Figure 4. Energy indices of Chile |
In terms of the share of electricity production from renewable energy sources (excluding hydropower), Chile is 56th among 170 countries selected for consideration. When considering the GDP per unit of energy use, Chile is 30th out of 66 countries surveyed, which is slightly above the world average, while energy consumption per capita is much lower – 41st out of 66 countries. In terms of electricity consumption per capita, the country is 70th in the world, however, for the indicator of combination of electricity production-consumption, Chile is 65th in the ranked list of 216 countries.
In the ranking of Energy Architecture Performance Index 2017, which is based on the level of economic growth, environmental safety and energy independence of the country, including access to energy, Chile is 40th, leaving Mexico and Guatemala behind. And for the last 7 years, Chile has raised 16 ranking positions.
Energy Infrastructure
A territorial map of the distribution of the largest infrastructure projects of the fossil fuel sector in Chile is shown in Figure 5.
As mentioned above, the coal reserves amount to more than 80% of the energy potential of mineral resources. The main coal extraction fields are located in the central part and in the south of the country, in the Biobio region, Los Rios and Magallanes. According to [20,21], the largest coal extraction fields are Catamutun and Mina Invierno.
The oil and gas fields are concentrated in the Magallanes oil basin basin district [22].
Three types of oil pipelines connect the oil fields with the major refineries: pipelines for crude oil with a total length of 985 km, oil pipelines for the transportation of petroleum products with a length of 722 km; and pipelines for gas condensate, 781 km long (Figure 5).
Figure 5. Basic infrastructural facilities of the fossil fuel sector in Chile
Chilean refineries process about 61.9 million barrels of oil annually. The National Petroleum Company (ENAP) manages three refineries, the largest of which is the Bio Bio, with an installed capacity of 116 thousand bbl/day [18].
The key oil terminals are the Bahia San Vicente, which is also part of the Bio Bio refinery, and Quintero Bay (Figure 5).
Major storage facilities are concentrated in the central part and in the south of the country, and have a total capacity of 22 million barrels [23].
Natural gas processing plants are also concentrated in the central part of the country. Pemuco natural gas processing plant has an installed capacity of 600 000 m3/day, which can be doubled depending on the demand [24].
Major LNG import terminals are located in Quintero s Bay (Valparaiso Region) and the Bay of Mejillones (Antofagasta Region). In 2015, Quintero and Mejillones terminals received 40 and 10 LNG vessels, respectively, and together carried out the supply of 3 686 million m3 of LNG [18]. The main LNG exporters to Chile are Trinidad and Tobago, Equatorial Guinea, and New Zealand [18]. Gas transportation between the LNG terminals, gas processing plants and power plants is carried out by pipelines with total length of 3160 km.
Figure 6 shows the most important facilities in Chile producing electrical energy.
There are four electrical grids in Chile, with a total installed capacity of 22 031 MW - SING (22.8%) SIC (76.4%) SEA (0.3%) SEM (0.5%) [18]. The share of fossil fuels in electricity production prevails in Chile and in 2021 was about 52%; approximately 19.5% comes from hydropower and 28.5% from other renewable energy sources (Figure 6). In the first case, the power generation is carried out mainly by coal (40%) and hydrocarbons [17]. The country has a significant generating capacity, including some very large facilities: 6 coal plants with a capacity of more than 300 MW, 6 combined power plants with capacity of more than 200 MW, and six oil power plants over 120 MW (Figure 6).
Figure 6. Electricity production in Chile
The largest coal-fired plant is Ventanas, with a capacity of more than 885 MW. The largest oil power plant is Taltal, with a capacity of 240 MW [25,26]. The leader among combined power plants is Tocopilla, with a capacity of more than 1 GW, and the largest gas power plant is Atacama, with an installed capacity of over 780 MW [27].
In 2017, hydropower generated about 23.2 TWh, where an installed capacity was estimated to be at 6 733 MWe [28]. There are about 114 hydroelectric power plants in Chile, the largest of which is the Ralco, with a capacity of 690 MW [27].
In Figure 7, you can see the main facilities of the Chilean infrastructure for the production of energy from renewable resources.
As noted above, renewable energy in Chile, excluding hydropower, becomes more and more important for the production of the main types of energy. Thus, the total production of electricity in 2020 from renewable sources, with the exception of hydropower, was 18.45 TWh, and was dominated by solar energy, followed by wind energy and bioenergy (Figure 7).
Figure 7. Renewable energy in Chile
Bioenergy has been actively developing in Chile, and as of 2017 its capacity was estimated at 473 MW [28]. Nationwide, there are enterprises for processing biomass, biogas, pellets, and LFG (landfill gas).
BIOENERGIA FORESTAL S.A. manages the largest biomass processing enterprise Sante Fe, with an installed capacity of more than 67.2 MW [27].
Landfill gas enterprise Loma Los Colorados, with an installed capacity of 18.2 MW, managed by KDM ENERGIA S.A., recycles about 60% of the capital's municipal waste and provides electricity for about 75 000 Chilean households [27,29].
The Andes Bio-Pellets company successfully applies modern technologies to produce about 50 million tons of pellets per year at its Santa Barbara technology plant [30].
As mentioned above, the level of solar radiation in the central and northern parts of the country can reach 9.5 kWh/m2 per day, and the wind speed exceeds 8.5 m/s, which is a tangible resource for energy production. As a consequence, there is a large number of renewable energy facilities located in the area. The largest solar station is El Romero with an installed capacity of 246 MW, and largest wind park will be Cabo Leones, with 319.5 MW [31,32]. One of the most promising areas for the development of concentrating solar power technologies is in the north of Chile, and several stations are at the development or construction stage.
Atacama-1 CSP tower type station in the Antofagasta area will have a capacity of 110 MW using thermo solar technology; a second station, CSP Parabolic type Minera el Tesoro, has a capacity of 10 MW [33,34]. Since 2013, there has been a significant increase in solar power installed capacity from 218 MWe in 2014 to 2110 MWe in 2017 [28].
Southern regions with the highest wind speed are less populated, and that fact slows down the development of renewable energy.
The Chilean Government has adopted a National Energy Strategy 2050 (Política energetica de Chile 2050), which is primarily focused on increasing the share of renewable energy in electricity production and the diversification of energy sources. As of December 30th 2016, 54 power plants were under construction, which was equivalent to 2 727 MW (the size of the investment totalled 8.5 billion US dollars); while in March 2014 there were 28 plants under construction, which was equivalent to 1 949 MW (an investment of 5.9 billion US dollars). The aim is to increase hydropower capacity (992 MW) and solar energy capacity (792 MW). In December 2016, 56 new energy projects with a total capacity of 5 078 MW were approved [35].
Education and Innovation
The set of indices reflecting the position of Chile among other countries in the field of education and innovation can be seen in Figure 8.
Figure 8 shows the indices that have an indirect impact on the energy sector, but largely determine its future in Chile. Chile is ranked 53rd out of 132 member countries according to the Global Innovation Index ranking of 2021. In the QS University Rating, Chilean universities are also higher than the average level, despite the relatively low levels of public funding for research, development of science and education in general.
| Sources: 1. The Global Innovation Index 2021, Rankings / Knowledge / World Intellectual Property Organization / Cornell University, INSEAD, and WIPO (2021): Energizing the World with Innovation. Ithaca, Fontainebleau, and Geneva *132 2. Patent Grants 2011-2020, resident & abroad / Statistical country profiles / World Intellectual Property Organization *185 3.Patents in Force 2020 / Statistical country profiles / World Intellectual Property Organization *109 4. QS World University Rankings 2022 *97 5. SCImago Country Rankings (1996-2020) / Country rankings / SCImago, (n.d.). SIR-SCImago Journal & Country Rank [Portal]. Retrieved 17 Nov 2021 *240 6. Internet users in 2018 / The World Factbook / Central Intelligence Agency *229 7. Internet users in 2018 (% Population) / The World Factbook / Central Intelligence Agency *229 8. Government expenditure on education, total (% of GDP), 2019 / United Nations Educational, Scientific, and Cultural Organization (UNESCO) Institute for Statistics. License: CCBY-4.0 / Data as of September 2021*177 9. Research and development expenditure (% of GDP), 2018 / UNESCO Institute for Statistics. License: CCBY-4.0 / Data *119 10. Scientific and technical journal articles, 2018 / National Science Foundation, Science and Engineering Indicators. License: CCBY-4.0 / Data *197 * Total number of countries participating in ranking Figure 8. The indices of education and innovation in Chile |
According to the number of patents granted to residents of Chile, both inside the country and abroad, the country ranks 46th in the world. Similarly, by the number of patents in force, the country is 45th in the world, which largely characterizes the country's patent attractiveness.
It also has relatively high indexes associated with the assessment of the number of publications in scientific and technological journals. As such, in the Scimago ranking, Chile is 47th out of 240 participating countries, and in the ranking of Scientific and Journal Activities it is 45th out of 197 countries.
Universities such as the University of Antofagasta, Universidad Diego Portales, Universidad Adolfo Ibanez, Universidad de La Concepcion, and the Pontificia Universidad Catolica de Valparaiso train specialists in various fields of energy, including Electronic Engineering, Mechanical Engineering, Electrical Engineering, etc.
Pontificia Universidad Catolica de Valparaiso conducts active research and development in the field of shale gas, gas hydrates, coal bed methane, synthetic fuels, concentrated solar power and production of hydrocarbons from low-permeability reservoirs. Centro de Investigacion en Polimeros Avanzados (CIPA) conducts research in the field of biotechnology.
Ecology and Environment Protection
A diagram of environmental indices is shown in Figure 9.
The indices shown in the diagram to a certain extent reflect the environmental situation in the country. First of all Chile demonstrates an extremely high level of CO2 emissions, both in general and per capita. However, the situation brightens by the fact that Chile is 6th in the Climate Change Performance Index (CCPI), which consists of 60 countries responsible for more than 90% of global CO2 emissions related to energy.
| Sources: 1. CO2 total emission by countries 2020 / European Commission / Joint Research Centre (JRC) / Emission Database for Global Atmospheric Research (EDGAR)*208 2. CO2 per capita emission 2020/European Commission/Joint Research Centre (JRC) / Emission Database for Global Atmospheric Research (EDGAR) *208 3. Forest area 2020 (% of land area) / The Global Forest Resources Assessment 2020 / Food and Agriculture Organization of the United Nations *234 4. Forest area change 2010-2020 (1000 ha/year) / The Global Forest Resources Assessment 2020 / Food and Agriculture Organization of the United Nations *234 5. The Environmental Performance Index (EPI) 2020 / Rankings / Yale Center for Environmental Law & Policy / Yale University *180 6. Annual freshwater withdrawals (m3 per capita), 2017 *179 Annual freshwater withdrawals, total (billion m3), 2017 – Food and Agriculture Organization, AQUASTAT data. /License: CC BY-4.0; Population – United Nations, Department of Economic and Social Affairs, Population Division (2019). World Population Prospects 2019, custom data acquired via website. Retrieved 15 November 2021 7. The National Footprint Accounts 2017 (Biocapacity Credit / Deficit) / Global Footprint Network *188 8. Methane emissions (kt of CO2 equivalent), 2018 / Data for up to 1990 are sourced from Carbon Dioxide Information Analysis Center, Environmental Sciences Division, Oak Ridge National Laboratory, Tennessee, United States. Data from 1990 are CAIT data: Climate Watch. 2020. GHG Emissions. Washington, DC: World Resources Institute. Available at: License : Attribution-NonCommercial 4.0 International (CC BY-NC 4.0) *191 9. The Climate Change Performance Index (CCPI) 2022 / Overall Results / Jan Burck, Thea Uhlich, Christoph Bals, Niklas Höhne, Leonardo Nascimento / Germanwatch, NewClimate Institute & Climate Action Network *60 * Total number of countries participating in ranking Figure 9. Environmental Indices of Chile |
According to the forest area as a percentage of land area, Chile is not among the world leaders, but the trend associated with its change looks very positive. In this ranking Chile is third, after China, Australia and India. Chile also has a relatively high valuation in the Environmental Performance Index (EPI) 2020, and is 44th out of 180 participating countries. This index primarily focuses on the environmental performance of national governments aimed at reducing the negative impact of the environment and rational use of natural resources.
According to the Environmental Vulnerability Index, based on years of observations of 50 indicators, including, for example, changing climatic characteristics or the quality of water resources, waste volumes, etc., Chile is 93rd, and is characterized as "vulnerable" along with, for example, Venezuela. Chile also belongs to a group of countries with very high levels of methane emissions. The Ecological Footprint Atlas rating complements the overall negative picture, according to which Chile is among the ecological debtors.
References
[1] List of sovereign states and dependencies by area / Wikipedia / en.wikipedia.org/wiki/List_of_sovereign_states_and_dependencies_by_area
[2] List of countries and dependencies by population density / Wikipedia / en.wikipedia.org/wiki/List_of_countries_and_dependencies_by_population_density
[3] Сhile / The world factbook / Library / Central Intelligence Agency / www.cia.gov
[4] GDP, PPP (constant 2011 international $) / World Bank, International Comparison Program database. License : CC BY-4.0 / Data / The World Bank / www.worldbank.org
[5] GDP per capita, PPP (current international $)/ World Bank, International Comparison Program database .License : CC BY-4.0 / Data / The World Bank / www.worldbank.org
[6] Reserves and Capacity / U.S. Energy Information Administration (Nov 2022) / www.eia.gov/beta/international/
[7] World Shale Resource Assessments / U.S. Energy Information Administration (September 24, 2015) / www.eia.gov
[8] Solar resource data obtained from the Global Solar Atlas, owned by the World Bank Group and provided by Solargis / Global Solar Athlas / globalsolaratlas.info
[9] Wind Map / Global Wind Atlas 2.0, a free, web-based application developed, owned and operated by the Technical University of Denmark (DTU) in partnership with the World Bank Group, utilizing data provided by Vortex, with funding provided by the Energy Sector Management Assistance Program (ESMAP). For additional information: globalwindatlas.info
[10] Agricultural land (% of land area) / Food and Agriculture Organization, electronic files and web site. Li-cense : CC BY-4.0 / Data / The World Bank / www.worldbank.org
[11] Forest area (% of land area) /Food and Agriculture Organization, electronic files and web site.License : CC BY-4.0 / Data / The World Bank / www.worldbank.org
[12] List of rivers of Chile / Wikipedia / en.wikipedia.org/wiki/List_of_rivers_of_Chile
[13] 2013 Survey of Energy Resources (PDF) / World Energy Council / www.worldenergy.org/
[14] Wave power / Wikipedia / en.wikipedia.org/wiki/Wave_power
[15] World Bank What a Waste / Data / The World Bank / www.worldbank.org
[16] BP Statistical Review of World Energy 2019 - 2022 (PDF) / BP / www.bp.com
[17] Chile / Geography / U.S. Energy Information Administration (Dec 2016) / www.eia.gov/beta/international/analysis.php
[18] 2015 Energy Statistical Yearbook Chile (PDF) / Comision Nacional de Energia /
www.cne.cl
[19] International Energy Statistic / Geography / U.S. Energy Information Administration (Dec 2018) /http://www.eia.gov/beta/international/
[20] Catamutun / Wikipedia / en.wikipedia.org/wiki/Catamut%C3%BAn
[21] Mina Invierno / Wikipedia / en.wikipedia.org/wiki/Mina_Invierno
[22] Chile seeks partners for 21 mature fields / Jan 17th, 2000 / Oil & Gas Journal / www.ogj.com
[23] Oil & Gas Security – Chile 2012 Report (PDF) / International Energy Agency / www.iea.org
[24] Chile: ENAP Opens Pemuco LNG Plant / 30 June 2011 / LNG World News / www.lngworldnews.com
[25] Kraftwerk Ventanas / Wikipedia / de.wikipedia.org/wiki/Kraftwerk_Ventanas
[26] Taltal OCGT Power Plant Chile / Global Energy Observatory / globalenergyobservatory.org
[27] Centrales / Estadisticas / Energia Abierta / datos.energiaabierta.cl
[28] Chile / IRENA / resourceirena.irena.org
[29] 8.4 MW Upgrade to Biogas Power Facility at Chile’s Largest Landfill / 30/04/2012 / Waste Management World / www.waste-management-world.com
[30] Nuestra Empresa / Andes Bio-Pellets / www.andesbiopellets.cl
[31] El Romero Solar PV Plant / Acciona Energia / www.acciona-energia.com
[32] Ibereólica finances Chilean wind farm / Guia Chile Energia / www.guiachileenergia.cl
[33] About Atacama-1 / Description /Abengoa Solar / www.abengoa.com
[34] Minera El Tesoro brings South America’s first concentrated solar thermal plant / Helio SCP / helioscsp.com
[35] Proyectos en Construcción e Inversión en sector Energía a diciembre 2016 / Ministerio de Energia / www.energia.gob.cl
The sources of charts and curves are specified under the images.
For more information about the energy industry in Chile see here