
Contents
General State of the Economy
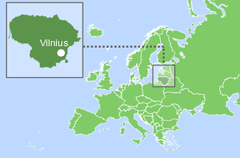
Lithuania, officially the Republic of Lithuania, is a northeastern European country lying on the eastern shore of the Baltic Sea. Lithuania borders Latvia to the north, Belarus to the east and south, Poland and Russian oblast Kaliningrad to the southwest. In the west, the country is washed by the Baltic Sea with maritime border to Sweden. The country's coastline stretches across 90 kilometers, excluding the Curonian Spit.
According to 2023 statistics, Lithuania, which in terms of size is 123rd in the world, is home to around 2,7 million people. In terms of population density the country is 182nd in the world out of 249 countries considered. The administrative map of the country is divided into 60 municipalities with Vilnius as its capital and most-populous city. The political form of government is a semi-presidential republic, and the official language is Lithuanian [1,2,3].
| Lithuania / Republic of Lithuania | ||
|---|---|---|
| Capital: Vilnius | Density: 43/km2 | Currency: Euro (€) (EUR) |
| Official languages: Lithuanian | Life expectancy at birth: 74.93 years | GDP (PPP): $144.261 billion (2024 est.) |
| National Day: 16 February | Area (land): 65,300 km2 | GDP - per capita (PPP): $52,200 (2024 est.) |
| Population: 2,655,755 (2023 est.) | Coastline: 262 km | Internet country code: .lt |
Source: [1,2,3,4,5]

Aerial view of Vilnius old town. Envato. 4LNP5JB28Q
The ranking positions of Lithuania relative to other countries have been determined for an extensive list of economic, energy, innovative and educational indices, as well as for metrics reflecting the state of the environment. The economic indices include, for example, GDP per capita, annual average GDP growth, high-technology exports, and others. The list of energy indices includes proven reserves of oil, gas and coal, production-consumption ratio combined, and energy use, etc. Each of the indices has a ranked list of included member countries. Since the number of countries in each rating is different for each index, the positioning of the country of interest is displayed on a special chart, where the vertical axis is a uniform relative scale from 0 to 1, whereas the horizontal axis denominates the various indices and respective numbers relating to the descriptions given underneath.
Thus, in such a relative “0-1” diagram, the country’s position is marked with a dot in proportion to its location in the original rating list. If the country is among the leaders regarding the selected indicator, it will be marked close to 1 in the upper green zone on the relevant chart “0-1”, if the country is an outsider in the rating list, then it will be marked in the lower red zone of the chart “0-1”, etc. A single list of indices is used for all countries. If a country is not in the ranking list for any index, then the corresponding position on the charts is not displayed.
| Sources: 1. GDP (purchasing power parity), 2020 est. / The World Factbook/Library/Central Intelligence Agency *228 2. GDP - per capita (PPP), 2020 / The World Factbook/Library/Central Intelligence Agency *229 3. Inflation rate (consumer prices), 2019 est. / The World Factbook/Library/Central Intelligence Agency *228 4. Charges for the use of intellectual property, receipts (BoP, current US$), 2020 / International Monetary Fund, Balance of Payments Statistics Yearbook, and data files. / License: CC BY-4.0 *88 5. The Global Competitiveness Index 2019 / Rankings / Reports / World Economic Forum *141 6. High-technology exports (current US$) 2019-2020 / United Nations, Comtrade database through the WITS platform / License: CCBY-4.0 / Data *134 7. 2021 Index of Economic Freedom / International Economies / The Heritage Foundation *178 8. Reserves of foreign exchange and gold, 2017 est. / The World Factbook / Library / Central Intelligence Agency *195 9. Annual average GDP growth in %, for the last 10 years (2011-2020) / World Bank national accounts data, and OECD National Accounts data files / License: CC BY-4.0*206 10. Public debt (% of GDP), 2017 est. / The World Factbook / Library / Central Intelligence Agency(from smallest to largest) *210 * Total number of countries participating in ranking Figure 1. Economic Indices of Lithuania |
For the majority of the economic indicators shown in the chart, Lithuania is above the middle of the ranking lists. The country has the best indices among those presented for the Index of Economic Freedom (0.92) and the GDP per capita (0.78). The weakest spots in the country’s economic indicators are Charges for the use of intellectual property (0.30) and Inflation rate (0.46). Overall, Lithuania is financially stable country with relatively strong economic system.
Energy Resources
There are some deposits of crude oil in Lithuania. The share of oil reserves is just 0.0007% of the world’s total. Since domestic production is insignificant and used only in the petrochemical industry, Lithuania is completely dependent on imports to meet its oil needs. Lithuania has no coal and natural gas resources.
In terms of tons of oil equivalent, according to 2024 data, conventional proved reserves were represented to 100% by crude oil (Fig.5).
Table 1. Fossil energy resources of Lithuania
| Resource /Explanations | Crude oil* | Natural gas | Coal | Shale Gas | Tight Oil | Coalmine methane |
|---|---|---|---|---|---|---|
| Value | 0.012 (0.0007%) | - | - | 2.4** | 1.4** | - |
| Unit | billion barrels | - | - | trillion cubic feet | billion barrels | - |
| Year | 2021 | - | - | - | - | - |
| Source | [6] | [-] | [-] | [22] | [22] | [-] |
* share of the country’s reserves in world total is provided in brackets
** Lithuania/Kaliningrad
Lithuania has reserves of shale gas and tight oil. However, attempts made in the past decade to organize the extraction of these resources were unsuccessful.
Although Lithuania, like most Nordic countries, does not have the highest solar energy potential, the country is rapidly developing renewable energy sources, including solar. The most common solar GHI intensity is 2.7-2.8 kWh/m2 per day, reaching 3.0 kWh/m2 per day in the western part of country, in Klaipeda, Marijampole and Alytus counties.
KLAIPEDA, LITHUANIA
Latitüde: 55.73 Longitude: 21.08
Average speed: 3.74 m/s, Operational share: 66%
Average daily wind speed for 10 years of observations, m/s, 10 m above the ground
Source: based on NOAA U.S. Department of Commerce
Detailed information: Interactive map of wind resources
KLAIPEDA, LITHUANIA
Latitüde: 55.73 Longitude: 21.08
Average daily sky coverage over 10 years of observations, %
CLR - clear, SCT - scattered from 1/8 TO 4/8, BKN - broken from 5/8 TO 7/8, OVC - overcast, OBS - obscured, POB - partial obscuration
Source: based on NOAA U.S. Department of Commerce
Detailed information: Interactive map of solar resources
The potential of wind energy in the Lithuanian energy market is quite high and wind power appears to be a promising solution to reduce dependence on fossil fuels. Due to its favorable geographical position on the eastern coast of the Baltic Sea, the country possesses powerful wind resources that reach over 7.0 m/s at 50 m in the western part of country, along the coastal line with the Baltic Sea. In addition, Lithuania has economically attractive offshore wind power potential in this region.
Table 2.Renewable energy resources of Lithuania
| Resource/ explanations | Solar Potential (GHI)* | Wind Potential (50 м)* | Bio Potential (agricultural area) | Bio Potential (forest area) | Municipal Solid Waste |
|---|---|---|---|---|---|
| Value | 2.7- 2.8 | 5.0-7.0 | 47.0 | 36.1 | 480 |
| Unit | kWh/m2/day | m/s | % of land area | % of land area | kg per capita |
| Year | 2020 | 2020 | 2020 | 2020 | 2021 |
| Source | [7] | [8] | [9] | [10] | [11] |
*for most of the territory of the country
Lithuania is rich in forests and the largest renewable energy potential in Lithuania is demonstrated by wood and agricultural waste. Two types of biofuels are mainly used in the country – biodiesel and bioethanol.
According to the Official Statistics Portal, in 2021, the main share in primary energy production was wood and agricultural waste – 62.3%, followed by hydro energy, wind energy, solar energy, geothermal energy and energy from chemical processes – 17%. It is predicted that the consumption of forest biomass for energy purposes will continue to grow in the Lithuanian energy sector [7].
Energy Balance
According to [6], in 2022 in Lithuania, the total production of primary energy was 0.02 quadrillion Btu, while consumption was at the level of 0.244 quadrillion Btu. Thus, the share of domestic production in primary energy consumption was about 8,2%. This makes Lithuania a highly energy dependent country.
According to the Statistical Review of World Energy 2022, primary energy consumption in Lithuania in 2021 amounted to 0.25 Exajoules [13]. According to the Lithuanian Statistics office [14], the structure of gross inland consumption for 2021 is dominated by crude oil and petroleum products (62.6%), followed by natural gas (15,9%), renewable energy (14.9%).
Source: U.S. Energy Information Administration (Mar 2024) / www.eia.gov
Figure 2. The production and consumption of fossil fuels in Lithuania (coal – left, gas – in the center, oil – right)
As can be seen above, Lithuania imports all the natural gas and coal it consumes, the amount of which has slightly decreased over the last 10 years. On the contrary, oil consumption has slightly increased, while production has remained at approximately the same level. 85% of the oil consumed is imported.
Sources: U.S. Energy Information Administration (Mar 2024) / www.eia.gov | ||
| Figure 3. Electricity production in Lithuania |
In Lithuania, electricity consumption is more than three times higher than production. According to the Official Statistic Portal, in 2019, 70% of electricity was imported. Out of 3.72 TWh of electricity produced domestically 61.7% came from renewable energy sources. Over the last ten years, the country's electricity consumption has increased by 30%.
| Sources: 1. Crude oil proved reserves, 2021 / International Energy Statistic/Geography / U.S. Energy Information Administration (Nov 2021)*98 2. Natural gas proved reserves 2021 / International Energy Statistic / Geography / U.S. Energy Information Administration (Nov 2021) *99 3. Total recoverable coal reserves 2019 / International Energy Statistic / Geography / U.S. Energy Information Administration (Nov 2021) *81 4. Combination production-consumption for Crude oil 2018 / International Energy Statistic / Geography / U.S. Energy Information Administration (Nov 2021) *219 5. Combination production-consumption for Natural gas 2019 / International Energy Statistic / Geography / U.S. Energy Information Administration (Nov 2021) *123 6. Combination production-consumption for Coal 2019 / International Energy Statistic / Geography / U.S. Energy Information Administration (Nov 2021) *128 7. Electricity – from other renewable sources (% of total installed capacity), 2017 est. / The World Factbook / Library / Central Intelligence Agency *170 8. GDP per unit of energy use (PPP per unit of oil equivalent), 2020 *66 Primary energy consumption - BP Statistical Review of World Energy 2021/BP;GDP (purchasing power parity) - The World Factbook/Library/Central Intelligence Agency 9. Energy use (primary energy use of oil equivalent per capita) 2020 *127 Primary energy consumption – BP Statistical Review of World Energy 2021; Population - United Nations, Department of Economic and Social Affairs, Population Division (2019). World Population Prospects 2019, custom data acquired via website. Retrieved 15 November 2021*66 10. The Global Energy Architecture Performance Index Report (EAPI) 2017 / Rankings / Reports / World Economic Forum 11. Electric power consumption (kWh per capita), 2016 *217 Electricity Consumption - The World Factbook / Library / Central Intelligence Agency; Population - United Nations, Department of Economic and Social Affairs, Population Division (2019). World Population Prospects 2019, custom data acquired via website. Retrieved 15 November 2021 12. Combination of electricity production-consumption (kWh)/The World Factbook/Library/Central Intelligence Agency *216 * Total number of countries participating in ranking Figure 4. Energy indices of Lithuania |
Lithuania’s dependency on imports of fossil fuels and electricity is reflected in the energy index chart, where the country has the lowest indicator among those presented for the Combination of electricity production-consumption (0.01). Even though only a third of the energy consumed in the country is produced domestically, more than 60% of it is renewable, so the indicator for Combination of electricity production-consumption (0.82) is the highest of those presented. Since there are no natural gas and coal reserves in the country, these two positions remained blank in the chat.
Energy Infrastructure
Lithuania's fossil fuel infrastructure is dominated by the oil sector, which includes all processes and activities from crude oil extraction to transportation of oil products. The main crude oil deposits are located in the west of the country. The major oil system infrastructure includes the Mazeikiai Refinery, the Birzai Pipeline, the Butinga Oil Terminal and the Klaipeda Oil Terminal.
Figure 5. Basic infrastructure facilities of the fossil fuel sector in Lithuania
Although heavily dependent on energy imports, Lithuania has managed to overcome its dependence on Russian energy by consistently refusing to import gas, oil, electricity and coal from Russia, redirecting energy imports through the LNG terminal in Klaipeda, the oil terminal in Butinge, the new gas connection to Poland and the expanded connection to Latvia [15].
Figure 6. Electricity production in Lithuania
At the end of 2009, Lithuania closed its last nuclear reactor in Ignalina, which generated about 70% of the country's electricity. Lithuania has thus turned from an electricity exporter to an importer and buys about two-thirds of its electricity due to insufficient, though growing, domestic generation. The country has a well-developed electricity transmission system connected to Poland, Latvia and Sweden, which provides the necessary imports.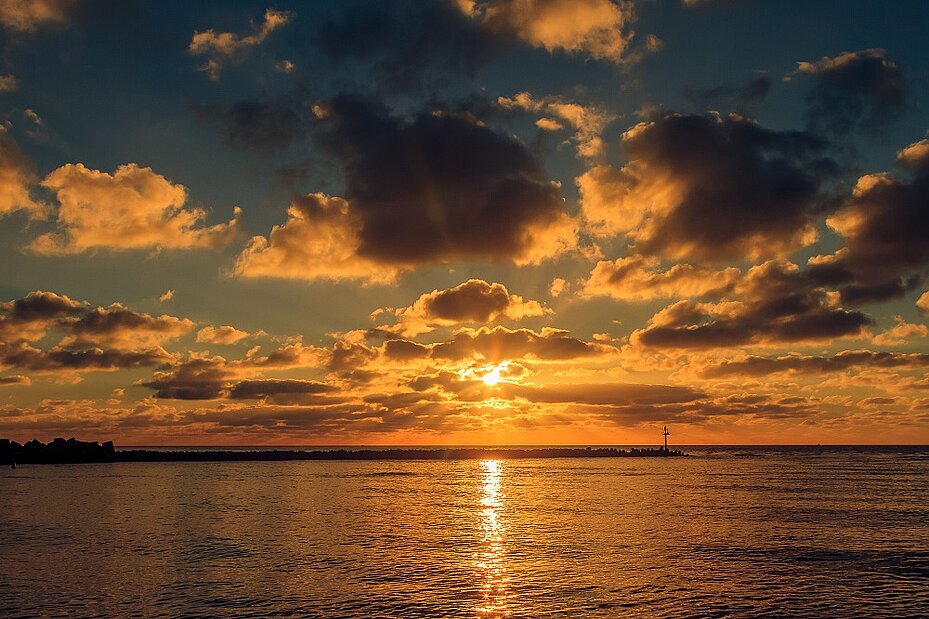
Sunset at the gates to the port of Klaipeda, Lithuania. Envato. 9W5SEQ234U
A minor part of the electricity produced domestically comes from hydro. According to the Lithuanian Hydropower Association (LHA), the country's small hydropower plants have an installed capacity of 28 MW and generate about 100 GWh per year, representing 3-4% of the total electricity production. The Kaunas Hydro Power Plant, located on the Nemunas River, is the largest renewable sources power plant in Lithuania [16]. 
Figure 7. Renewable energy in Lithuania
Of all renewable energy sources, wind energy is the most developed in Lithuania. According to the Lithuanian Wind Energy Association [17], in 2022, the electricity produced by wind turbines amounted to 1.51 terawatt hours, which corresponds to 13.5% of the final electricity consumption in the country. The total installed capacity of wind farms reached 946 MW, accounting for 62.4% of the renewable energy installed in the national grid. Starting its operation in 2016, the 73.5 MW Pagėgiai 13 is the largest wind park in Lithuania and in the Baltic Region [18].
Encouraging the production of electricity from renewables and thus reducing dependence on fossil fuels is a priority in the country's energy development. According to the National Energy and Climate Action Plan of the Republic of Lithuania for 2021-2030 [19], the gradual replacement of electricity imports by local electricity production is planned: up to 70% in 2030 and up to 100% in 2050. This goal is planned to be achieved due to the intensive development of electricity production from renewable sources.
One of the important projects on the way to the country's energy independence is the construction of offshore wind farms in the Baltic Sea near Palanga, which will start operating in 2028. The offshore wind farms, with a capacity of about 1.4 GW, are expected to generate up to 6 TWh of clean electricity per year, which will meet up to half of Lithuania's current electricity demand [20].
There are also many projects in the rapidly developing field of solar energy, one of which is a 65 MW solar project in the municipality of Anikšiai. The solar panel area will cover more than 140,000 hectares and the annual electricity generation will be around 90,000 MWh. In addition to this solar power plant, other solar projects have been launched in Jonava and Skuodas, which are planned to be connected to the grid by 2026 [21].
Education and Innovation
The following chart shows Lithuania’s positions in terms of education and innovation.
| Sources: 1. The Global Innovation Index 2021, Rankings / Knowledge / World Intellectual Property Organization / Cornell University, INSEAD, and WIPO (2021): Energizing the World with Innovation. Ithaca, Fontainebleau, and Geneva *132 2. Patent Grants 2011-2020, resident & abroad / Statistical country profiles / World Intellectual Property Organization *185 3.Patents in Force 2020 / Statistical country profiles / World Intellectual Property Organization *109 4. QS World University Rankings 2022 *97 5. SCImago Country Rankings (1996-2020) / Country rankings / SCImago, (n.d.). SIR-SCImago Journal & Country Rank [Portal]. Retrieved 17 Nov 2021 *240 6. Internet users in 2018 / The World Factbook / Central Intelligence Agency *229 7. Internet users in 2018 (% Population) / The World Factbook / Central Intelligence Agency *229 8. Government expenditure on education, total (% of GDP), 2019 / United Nations Educational, Scientific, and Cultural Organization (UNESCO) Institute for Statistics. License: CCBY-4.0 / Data as of September 2021*177 9. Research and development expenditure (% of GDP), 2018 / UNESCO Institute for Statistics. License: CCBY-4.0 / Data *119 10. Scientific and technical journal articles, 2018 / National Science Foundation, Science and Engineering Indicators. License: CCBY-4.0 / Data *197 * Total number of countries participating in ranking Figure 8. The indices of education and innovation in Lithuania |
80% of Lithuania indices describing the country's positioning in the various international rankings related to education and innovation are above average. Lithuania has the highest rankings in the SCImago Country Rankings (0.74), Internet users as % of population (0.72), and the Research and development expenditure as % of GDP (0.71). The lowest indicator of the country is QS World University Rankings 2022 (0.40). Overall, Lithuania's indexes in the education and innovation sector look quite convincing.
Ecology and Environment Protection
Indicators related to environmental issues are presented in the following diagram.
| Sources: 1. CO2 total emission by countries 2020 / European Commission / Joint Research Centre (JRC) / Emission Database for Global Atmospheric Research (EDGAR)*208 2. CO2 per capita emission 2020/European Commission/Joint Research Centre (JRC) / Emission Database for Global Atmospheric Research (EDGAR) *208 3. Forest area 2020 (% of land area) / The Global Forest Resources Assessment 2020 / Food and Agriculture Organization of the United Nations *234 4. Forest area change 2010-2020 (1000 ha/year) / The Global Forest Resources Assessment 2020 / Food and Agriculture Organization of the United Nations *234 5. The Environmental Performance Index (EPI) 2020 / Rankings / Yale Center for Environmental Law & Policy / Yale University *180 6. Annual freshwater withdrawals (m3 per capita), 2017 *179 Annual freshwater withdrawals, total (billion m3), 2017 – Food and Agriculture Organization, AQUASTAT data. /License: CC BY-4.0; Population – United Nations, Department of Economic and Social Affairs, Population Division (2019). World Population Prospects 2019, custom data acquired via website. Retrieved 15 November 2021 7. The National Footprint Accounts 2017 (Biocapacity Credit / Deficit) / Global Footprint Network *188 8. Methane emissions (kt of CO2 equivalent), 2018 / Data for up to 1990 are sourced from Carbon Dioxide Information Analysis Center, Environmental Sciences Division, Oak Ridge National Laboratory, Tennessee, United States. Data from 1990 are CAIT data: Climate Watch. 2020. GHG Emissions. Washington, DC: World Resources Institute. Available at: License : Attribution-NonCommercial 4.0 International (CC BY-NC 4.0) *191 9. The Climate Change Performance Index (CCPI) 2022 / Overall Results / Jan Burck, Thea Uhlich, Christoph Bals, Niklas Höhne, Leonardo Nascimento / Germanwatch, NewClimate Institute & Climate Action Network *60 * Total number of countries participating in ranking Figure 9. Environmental Indices of Lithuania |
The fact that around 36% of the area in Lithuania is covered by forest is positively reflected in the environmental indices chart (0.58). In addition, the forest resources change (0.81) is one of the countries strongest spots of those presented.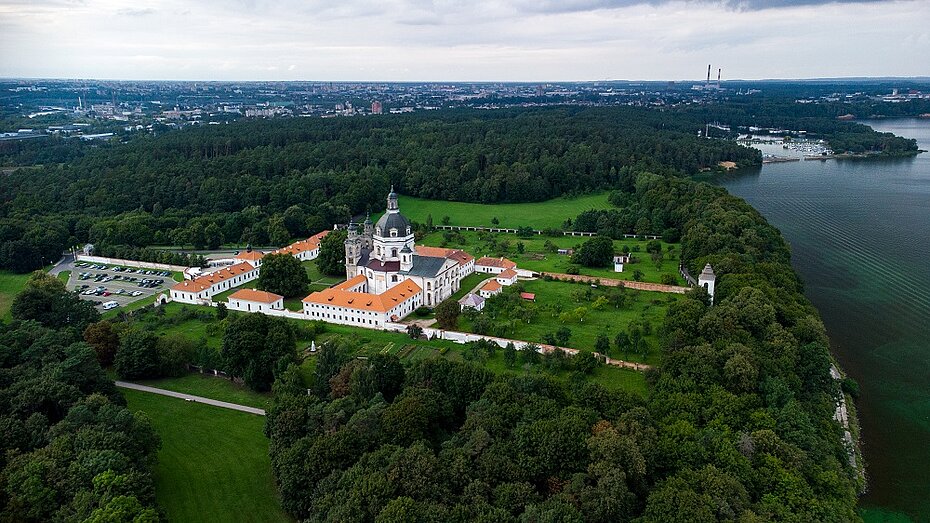 Aerial view of Pazaislis Monastery among the beautiful nature in Kaunas, Lithuania. Envato. FSBH6GCRA3
Lithuania is well positioned in The Climate Change Performance Index-2022 (0.83) and The Environmental Performance Index (0.81). Among the country's negative environmental characteristics is its annual freshwater withdrawal (0.21), which is very low, compared to other countries. Thus, according to Figure 9, the environmental situation in Lithuania as a whole is not a cause for concern, but some indicators as CO2 emissions, need improvement.
References
[1] List of sovereign states and dependencies by area / Wikipedia / en.wikipedia.org/wiki/List_of_sovereign_states_and_dependencies_by_area
[2] List of countries and dependencies by population density / Wikipedia / en.wikipedia.org/wiki/List_of_countries_and_dependencies_by_population_density
[3] Lithuania / The world factbook / Library / Central Intelligence Agency / www.cia.gov
[4] GDP, PPP (constant 2011 international $) / World Bank, International Comparison Program database. License: CC BY-4.0 / Data / The World Bank / www.worldbank.org
[5] GDP per capita, PPP (current international $) / World Bank, International Comparison Program database. License: CC BY-4.0 / Data / The World Bank / www.worldbank.org
[6] International Energy Statistic / Geography / U.S. Energy Information Administration (Dec 2022) / www.eia.gov/beta/international/
[7] Environment, Agriculture and Energy in Lithuania (edition 2022) / Official Statistics Portal / https://osp.stat.gov.lt/lietuvos-aplinka-zemes-ukis-ir-energetika-2022/energetika/atsinaujinantys-energijos-istekliai
[8] Solar resource data obtained from the Global Solar Atlas, owned by the World Bank Group and provided by Solargis / Global Solar Atlas / globalsolaratlas.info
[9] Wind Map / Global Wind Atlas 2.0, a free, web-based application developed, owned and operated by the Technical University of Denmark (DTU) in partnership with the World Bank Group, utilizing data provided by Vortex, with funding provided by the Energy Sector Management Assistance Program (ESMAP). For additional information: globalwindatlas.info
[10] Agricultural land (% of land area) /Food and Agriculture Organization, electronic files and web site. License: CC BY-4.0 / Data / The World Bank / www.worldbank.org
[11] Forest area (% of land area) /Food and Agriculture Organization, electronic files and web site. License: CC BY-4.0 / Data / The World Bank / www.worldbank.org
[12] Municipal waste statistics Updated / Statistics Explained / Eurostat / https://ec.europa.eu/eurostat/statistics-explained/index.php?title=Municipal_waste_statistics
[13] BP Statistical Review of World Energy 2020-2022 (PDF) / BP / www.bp.com
[14] Official Statistics Office of Lithuania / osp.stat.gov.lt
[15] 2023 Country Report – Lithuania / economy-finance.ec.europa.eu/system/files/2023-05/LT_SWD_2023_615_en.pdf
[16] The Lithuanian Hydropower Association (LHA) / www.hidro.lt
[17] Statistics. Wind energy in Lithuania 2022 / lvea.lt/en/statistics
[18] Pagegiai 13" / www.stemma.lt/en/wind-energy/5-wind-energy
[19] National Energy and Climate Action Plan of the Republic of Lithuania for 2021-2030 / energy.ec.europa.eu/system/files/2022-08/lt_final_necp_main_en.pdf
[20] OFFSHORE WIND PARKS IN LITHUANIA / offshorewind.lt/en/
[21] European Energy to build 65MW solar plant in Lithuania / www.power-technology.com/news/european-energy-solar-plant-lithuania/
[22[ World Shale Resource Assessments / Last updated: September 24, 2015/ www.eia.gov/analysis/studies/worldshalegas/
The sources of charts and curves are specified under the images.
For more information about the energy industry in Lithuania see here