
Contents
General State of the Economy
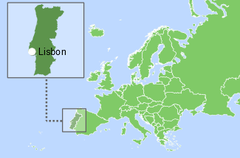
Portugal, officially the Portuguese Republic, is a European country in the southern region of the continent located on the Iberian Peninsula. Portugal also includes two Atlantic archipelagos, Madeira and Azores, both of which are autonomous entities with their own governments. The only country Portugal shares borders with is Spain to the east and north, while to the west and south the Atlantic Ocean laps its 1,794 km coastline [1,2,3].
| Portugal | ||
|---|---|---|
| Capital: Lisbon | Density: 113.5/km2 | Currency: Euro (€) (EUR) |
| Official languages: Portuguese | Life expectancy at birth: 82.47 years | GDP (PPP): $465.1 billion (2023 est.) |
| National Day: 10 June | Area: 92,212 km2 | GDP - per capita (PPP): $45,227 (2023 est.) |
| Population: 10,467,366 (2022 est.) | Coastline: 1,794 km | Internet country code: .pt |
Source: [1,2,3,4,5]
According to 2023 statistics, Portugal, which ranks 111th in the world in terms of the size of its territory, is home to around 10 million people. In terms of population density, the country occupies the 103rd place in the world [1,2,3]. Lisbon is the capital of Portugal and has a population of around 3 million people. Portugal is a semi-presidential republic. The continental part of the country is divided into 18 districts [3].
Portugal’s ranking positions relative to other countries have been determined for an extensive list of economic, energy, innovative and educational indices, as well as for metrics reflecting the state of the environment. The economic indices include, for example, GDP per capita, annual average GDP growth, high-technology exports, and others. The list of energy indices includes proven reserves of oil, gas and coal, production-consumption ratio combined, and energy use, etc. Each of the indices has a ranked list of included member countries. Since the number of countries in each rating is different for each index, the positioning of the country of interest is displayed on a special chart, where the vertical axis is a uniform relative scale from 0 to 1, whereas the horizontal axis denominates the various indices and respective numbers relating to the descriptions given underneath.
Thus, in such a relative “0-1” diagram, the country’s position is marked with a dot in proportion to its location in the original rating list. If the country is among the leaders regarding the selected indicator, it will be marked close to 1 in the upper green zone on the relevant chart “0-1”, if the country is an outsider in the rating list, then it will be marked in the lower red zone of the chart “0-1”, etc.
Ranking position of Portugal for list of economic indices:
| Sources: 1. GDP (purchasing power parity), 2020 est. / The World Factbook/Library/Central Intelligence Agency *228 2. GDP - per capita (PPP), 2020 / The World Factbook/Library/Central Intelligence Agency *229 3. Inflation rate (consumer prices), 2019 est. / The World Factbook/Library/Central Intelligence Agency *228 4. Charges for the use of intellectual property, receipts (BoP, current US$), 2020 / International Monetary Fund, Balance of Payments Statistics Yearbook, and data files. / License: CC BY-4.0 *88 5. The Global Competitiveness Index 2019 / Rankings / Reports / World Economic Forum *141 6. High-technology exports (current US$) 2019-2020 / United Nations, Comtrade database through the WITS platform / License: CCBY-4.0 / Data *134 7. 2021 Index of Economic Freedom / International Economies / The Heritage Foundation *178 8. Reserves of foreign exchange and gold, 2017 est. / The World Factbook / Library / Central Intelligence Agency *195 9. Annual average GDP growth in %, for the last 10 years (2011-2020) / World Bank national accounts data, and OECD National Accounts data files / License: CC BY-4.0 *206 10. Public debt (% of GDP), 2017 est. / The World Factbook / Library / Central Intelligence Agency (from smallest to largest) *210 * Total number of countries participating in ranking Figure 1. Economic Indices of Portugal |
For most of the indices shown in the graph, Portugal is above the middle of the rankings. Of the indices presented, the country has the highest values for Inflation rate (0.84), High-technology exports (0.78) and GDP (0.77). The weakest parts of Portugal’s economic indicators are Public debt (0.04) and Annual average GDP growth in % (0.13).
Energy Resources
There are no significant deposits of natural gas or oil in Portugal. All oil and natural gas in Portugal comes from other countries, making Portugal highly dependent on fossil fuel imports. Although the country has small coal deposits, the last coal mine was closed almost 30 years ago. In addition, Portugal closed its last remaining coal-fired power plant in 2021, becoming the fourth country in the EU after Belgium, Austria and Sweden to stop using coal for power generation [6].
In terms of tons of oil equivalent, according to 2024 data, conventional proved reserves were represented to 100% by coal (Fig.5).
Table 1. Fossil energy resources of Portugal
| Resource /Explanations | Crude oil | Natural gas | Coal* | Shale Gas | Tight Oil | Coalmine methane |
|---|---|---|---|---|---|---|
| Value | - | - | 40 (0.003%) | - | - | - |
| Unit | - | - | million short tons | - | - | - |
| Year | - | - | 2021 | - | - | - |
| Source | [-] | [-] | [7] | - | - | [-] |
* share of the country’s reserves in world total is provided in brackets
Portugal has favorable conditions for the development of renewable energy in general and wind power in particular. In a number of regions of the country, especially on the coast, wind speed reaches 7 m/s at a height of 50 m. The southern part of Portugal, especially the Faro and Beja regions, has the most favourable climatic conditions for the development of solar energy, where the solar GHI reaches 4.9-5.2 kWh/m2 per day. Hydropower has significant potential in the country, with most of the hydropower plants located in the mountainous northern region.
Table 2.Renewable energy resources of Portugal
| Resource/ Explanations | Solar Potential (GHI)* | Wind Potential (50 м)* | Bio Potential (agricultural area) | Bio Potential (forest area) | Geothermal Potenial | Municipal Solid Waste |
|---|---|---|---|---|---|---|
| Value | 4.6-5.2 | 6.0-7.0 | 42.3 | 36.2 | low enthalpy (30-73°C) | 513 |
| Unit | kWh/m2/day | m/s | % of land area | % of land area | - | kg per capita |
| Year | 2020 | 2020 | 2020 | 2020 | - | 2021 |
| Source | [8] | [9] | [10] | [11] | [12] | [13] |
*for most of the territory of the country
FARO, PORTUGAL, Latitude: 37.01, Longitude: -7.97
Sky cover, %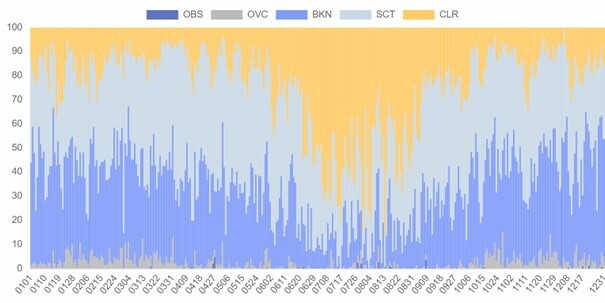
Source: Based on NOAA
CABO CARVOEIRO, PORTUGAL, Latitiude: 39.35, Longitude: -9.4
Average speed: 4.91 m/s, Operational share: 81%, Height 10 m
Wind speed, m/s
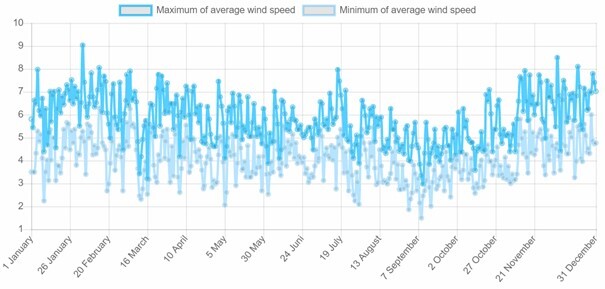
Source: Based on NOAA
Almost 80% of the country's territory is covered by agricultural and forest areas. Industrial waste from these areas can provide a sufficient resource base for the development of various bioenergy technologies, in particular the production of biogas, bioethanol or biodiesel.
Energy Balance
According to [7], in 2021 in Portugal, the total production of primary energy was 0.273 Btu, while consumption was at the level of 0.937 Btu. Thus, the share of domestic production in primary energy consumption was about 30%. This makes Portugal a country heavily dependent on energy imports.
According to the Statistical Review of World Energy 2022, primary energy consumption in Portugal in 2021 amounted to 0.96 Exajoules and was dominated by oil – 43.7 % , followed by natural gas – 21.9%, renewables – 20.8%, hydroelectricity – 11.5%, and coal – 1% [14].
Source: U.S. Energy Information Administration (Mar 2024) / www.eia.gov
Figure 2. The production and consumption of fossil fuels in Portugal (coal – left, gas – in the center, oil – right)
As can be seen from the graph above, over the past twenty years Portugal has produced neither coal nor gas, and the consumption of coal decreased from 6 million short tons in 2003 to 0.003 in 2022, while gas consumption, on the contrary, increased by almost 90% over the same period of time. The country's consumption of oil is 18 times higher than its insignificant production (include other liquids).
Sources: U.S. Energy Information Administration (Mar 2024) / www.eia.gov | ||
| Figure 3. Electricity production in Portugal |
Total electricity generation in Portugal in 2021 was 46.19 TWh with approximately 44% of produced by renewable sources, 42% – by thermal power plants and about 14% – by hydroelectric power plants. Renewable generation is a strong sector, providing 60% of consumption.
The chart of Portugal's energy indices is presented in the figure below.
| Sources: 1. Crude oil proved reserves, 2021 / International Energy Statistic/Geography / U.S. Energy Information Administration (Nov 2021)*98 2. Natural gas proved reserves 2021 / International Energy Statistic / Geography / U.S. Energy Information Administration (Nov 2021) *99 3. Total recoverable coal reserves 2019 / International Energy Statistic / Geography / U.S. Energy Information Administration (Nov 2021) *81 4. Combination production-consumption for Crude oil 2018 / International Energy Statistic / Geography / U.S. Energy Information Administration (Nov 2021) *219 5. Combination production-consumption for Natural gas 2019 / International Energy Statistic / Geography / U.S. Energy Information Administration (Nov 2021) *123 6. Combination production-consumption for Coal 2019 / International Energy Statistic / Geography / U.S. Energy Information Administration (Nov 2021) *128 7. Electricity – from other renewable sources (% of total installed capacity), 2017 est. / The World Factbook / Library / Central Intelligence Agency *170 8. GDP per unit of energy use (PPP per unit of oil equivalent), 2020 *66 Primary energy consumption - BP Statistical Review of World Energy 2021/BP;GDP (purchasing power parity) - The World Factbook/Library/Central Intelligence Agency 9. Energy use (primary energy use of oil equivalent per capita) 2020 *127 Primary energy consumption – BP Statistical Review of World Energy 2021; Population - United Nations, Department of Economic and Social Affairs, Population Division (2019). World Population Prospects 2019, custom data acquired via website. Retrieved 15 November 2021*66 10. The Global Energy Architecture Performance Index Report (EAPI) 2017 / Rankings / Reports / World Economic Forum 11. Electric power consumption (kWh per capita), 2016 *217 Electricity Consumption - The World Factbook / Library / Central Intelligence Agency; Population - United Nations, Department of Economic and Social Affairs, Population Division (2019). World Population Prospects 2019, custom data acquired via website. Retrieved 15 November 2021 12. Combination of electricity production-consumption (kWh)/The World Factbook/Library/Central Intelligence Agency *216 * Total number of countries participating in ranking Figure 4. Energy indices of Portugal |
In terms of coal reserves, Portugal is at the bottom of the graph (0.20), and since the country does not have any significant reserves of oil and natural gas, the first two positions remain unoccupied. Portugal has consequently a low ratio in all positions concerning the combined production-consumption of fossil fuels. The fact that renewable energy is the main contributor to the country's electricity production is reflected in Portugal's position in Electricity – from other renewable sources (0.95) – the strongest indicator reflected on the graph. Apart from that, the country is relatively well-positioned in the Global Energy Architecture Performance Index Report (0.91) and Combination of electricity production-consumption (0.84).
Energy Infrastructure

Figure 5. Basic infrastructure facilities of the fossil fuel sector in Portugal (click on the map to view a PDF version)
The main artery of the gas network runs along the Portuguese coast, connecting to the country's main gas storage facility, the Carriço UGS in the west and the country's only LNG terminal in the port of Sines, which also includes LNG storage.

Figure 6. Electricity production in Portugal (click on the map to view a PDF version)
Since Portugal closed two large coal-fired plants in 2021, the country's largest electricity production plant, the 1,250 MW Ribatejo power station in Lisbon, runs on gas. Although fossil fuels, mainly gas, still play a significant role in total electricity production, Portugal is one of the global leaders in meeting the country's domestic electricity needs through renewable energy, with hydropower accounting for about 47% of Portugal's generating capacity. The main hydro power and pumped-storage plants are located in northern Portugal. One of the hydro power complexes worth mentioning is being developed on the Tâmega River between Porto and the Spanish town of Ourense and represents the largest hydro power project in Portugal and one of the biggest in Europe. Tâmega comprises three dams with an installed capacity of 1.158 MW. The Gouvães and Daivões dams, with a capacity of 880 MW and 118 MW respectively, have been commissioned, and the remaining unit, Alto Tâmega, is planned to be completed in June 2024. This energy complex will increase the country's total installed electric capacity by 6% [15].

Figure 7. Renewable energy in Portugal (click on the map to view a PDF version)
Thanks mainly to wind generation, renewable energy sources, not including hydropower, cover about 45% of electricity production. The majority of wind power plants are concentrated in the northern and central parts of the country. The largest of them have a capacity of more than 200 MW.
The Portuguese government is taking steps to accelerate the introduction of renewable energy sources, especially solar photovoltaics. One of the big projects is the construction of the Europe’s largest photovoltaic plant with a capacity of 1200 MW in Santiago do Cacém near Sines. The farm is expected to become operational in 2025 and produce the energy equivalent of 370 million cubic meters of gas per year [16].
According to the Portugal’s National Energy and Climate Plan 2021-2030, the country aims to achieve carbon neutrality by 2050 and to cover 80% of its electricity consumption with renewables by 2026. In addition, it is targeted that renewable energy sources will account for 47% of national gross final energy consumption in 2030 [17].
Among other sectors of renewable energy, bioenergy is under active development in Portugal, especially the production of biodiesel and pellets.
Education and Innovation
The following chart shows Portugal's positions in terms of education and innovation:
Sources: 1. The Global Innovation Index 2021, Rankings / Knowledge / World Intellectual Property Organization / Cornell University, INSEAD, and WIPO (2021): Energizing the World with Innovation. Ithaca, Fontainebleau, and Geneva *132 2. Patent Grants 2011-2020, resident & abroad / Statistical country profiles / World Intellectual Property Organization *185 3.Patents in Force 2020 / Statistical country profiles / World Intellectual Property Organization *109 4. QS World University Rankings 2022 *97 5. SCImago Country Rankings (1996-2020) / Country rankings / SCImago, (n.d.). SIR-SCImago Journal & Country Rank [Portal]. Retrieved 17 Nov 2021 *240 6. Internet users in 2018 / The World Factbook / Central Intelligence Agency *229 7. Internet users in 2018 (% Population) / The World Factbook / Central Intelligence Agency *229 8. Government expenditure on education, total (% of GDP), 2019 / United Nations Educational, Scientific, and Cultural Organization (UNESCO) Institute for Statistics. License: CCBY-4.0 / Data as of September 2021*177 9. Research and development expenditure (% of GDP), 2018 / UNESCO Institute for Statistics. License: CCBY-4.0 / Data *119 10. Scientific and technical journal articles, 2018 / National Science Foundation, Science and Engineering Indicators. License: CCBY-4.0 / Data *197 * Total number of countries participating in ranking | ||
| Figure 8. The indices of education and innovation in Portugal |
All Portuguese indices describing the country's positioning in the various international rankings related to education and innovation are above average. Portugal has the highest rankings in SCImago Country Rankings (0.88), Scientific and technical journal articles (0.87) and Research and development expenditure as % of GDP (0.79). The lowest indicator of the country is QS World University Rankings 2022 (0.51). Overall, Portugal's indexes in the education and innovation sector look quite convincing.
Ecology and Environment Protection
Indicators related to environmental issues are presented in the following diagram:
| Sources: 1. CO2 total emission by countries 2020 / European Commission / Joint Research Centre (JRC) / Emission Database for Global Atmospheric Research (EDGAR)*208 2. CO2 per capita emission 2020/European Commission/Joint Research Centre (JRC) / Emission Database for Global Atmospheric Research (EDGAR) *208 3. Forest area 2020 (% of land area) / The Global Forest Resources Assessment 2020 / Food and Agriculture Organization of the United Nations *234 4. Forest area change 2010-2020 (1000 ha/year) / The Global Forest Resources Assessment 2020 / Food and Agriculture Organization of the United Nations *234 5. The Environmental Performance Index (EPI) 2020 / Rankings / Yale Center for Environmental Law & Policy / Yale University *180 6. Annual freshwater withdrawals (m3 per capita), 2017 *179 Annual freshwater withdrawals, total (billion m3), 2017 – Food and Agriculture Organization, AQUASTAT data. /License: CC BY-4.0; Population – United Nations, Department of Economic and Social Affairs, Population Division (2019). World Population Prospects 2019, custom data acquired via website. Retrieved 15 November 2021 7. The National Footprint Accounts 2017 (Biocapacity Credit / Deficit) / Global Footprint Network *188 8. Methane emissions (kt of CO2 equivalent), 2018 / Data for up to 1990 are sourced from Carbon Dioxide Information Analysis Center, Environmental Sciences Division, Oak Ridge National Laboratory, Tennessee, United States. Data from 1990 are CAIT data: Climate Watch. 2020. GHG Emissions. Washington, DC: World Resources Institute. Available at: License : Attribution-NonCommercial 4.0 International (CC BY-NC 4.0) *191 9. The Climate Change Performance Index (CCPI) 2022 / Overall Results / Jan Burck, Thea Uhlich, Christoph Bals, Niklas Höhne, Leonardo Nascimento / Germanwatch, NewClimate Institute & Climate Action Network *60 * Total number of countries participating in ranking | ||
| Figure 9. Environmental Indices of Portugal |
The significant amount of electricity generation through hydropower and renewable energy is positively reflected in the Environmental Indices chart. For example, Portugal is well positioned in The Environmental Performance Index (EPI) 2020 (0.82), Annual freshwater withdrawals (0.87) and Forest area change 2010-2020 (0.85). However, the CO2 emission figures are 0.30-0.38 and The National Footprint Accounts 2017 is even lower. Thus, according to Figure 9, the environmental situation in Portugal as a whole is not a cause for concern, but some indicators need improvement.
References
[1] List of sovereign states and dependencies by area / Wikipedia / en.wikipedia.org/wiki/List_of_sovereign_states_and_dependencies_by_area
[2] List of countries and dependencies by population density / Wikipedia / en.wikipedia.org/wiki/List_of_countries_and_dependencies_by_population_density
[3] Portugal / The world factbook / Library / Central Intelligence Agency / www.cia.gov
[4] GDP, PPP (constant 2011 international $) / World Bank, International Comparison Program database. License: CC BY-4.0 / Data / The World Bank / www.worldbank.org
[5] GDP per capita, PPP (current international $) / World Bank, International Comparison Program database. License: CC BY-4.0 / Data / The World Bank / www.worldbank.org
[6] Portugal becomes fourth European country to go coal free / November 2021 / Beyond Fossil Fuels / https://beyondfossilfuels.org/
[7] International Energy Statistic / Geography / U.S. Energy Information Administration (Dec 2022) / www.eia.gov/beta/international/
[8] Solar resource data obtained from the Global Solar Atlas, owned by the World Bank Group and provided by Solargis / Global Solar Atlas / globalsolaratlas.info
[9] Wind Map / Global Wind Atlas 2.0, a free, web-based application developed, owned and operated by the Technical University of Denmark (DTU) in partnership with the World Bank Group, utilizing data provided by Vortex, with funding provided by the Energy Sector Management Assistance Program (ESMAP). For additional information: globalwindatlas.info
[10] Agricultural land (% of land area) /Food and Agriculture Organization, electronic files and web site. License: CC BY-4.0 / Data / The World Bank / www.worldbank.org
[11] Forest area (% of land area) /Food and Agriculture Organization, electronic files and web site. License: CC BY-4.0 / Data / The World Bank / www.worldbank.org
[12] Potential for hot groundwater in Portugal / Global Geothermal Alliance (GGA) / https://globalgeothermalalliance.org/
[13] Municipal waste statistics Updated / 19 July 2018 / Full list / Statistics Explained / Eurostat / ec.europa.eu
[14] BP Statistical Review of World Energy 2020-2022 (PDF) / BP / www.bp.com
[15] Tâmega Giga Battery / IBERDROLA / www.iberdrola.com/about-us/what-we-do/hydroelectric-power/tamega-giga-battery
[16] Europe’s biggest solar farm to open in Portugal / EURACTIV / www.euractiv.com/section/politics/news/europes-biggest-solar-farm-to-open-in-portugal/
[17] Portugal National Energy and Climate Plan 2021-2030 (NECP 2030) / energy.ec.europa.eu/system/files/2020-06/pt_final_necp_main_en_0.pdf
The sources of charts and curves are specified under the images.
For more information about the energy industry in Portugal see here