
Contents
General State of the Economy
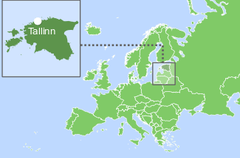
Estonia, officially the Republic of Estonia, is a Baltic country in northeastern Europe bordered to the north by the Gulf of Finland, to the west by the Baltic Sea, to the south by Latvia, and to the east by Russia and Lake Peipus. In addition to the mainland, Estonia’s territory consists of the large islands of Saaremaa and Hiiumaa, as well as more than 2000 islands and islets on the eastern coast of the Baltic Sea.
| Estonia / Republic of Estonia | ||
|---|---|---|
| Capital: Tallinn | Density: 30.6/km2 | Currency: Euro (€) (EUR) |
| Official languages: Estonian | Life expectancy at birth: 78.35 years | GDP (PPP): $61.757 billion (2023 est.) |
| National Day: 24 February | Area (land): 45,339 km2 | GDP - per capita (PPP): $46,385 (2023 est.) |
| Population: 1,357,739 (2023 est.) | Coastline: 3,794 km | Internet country code: .ee |
Source: [1,2,3,4,5]
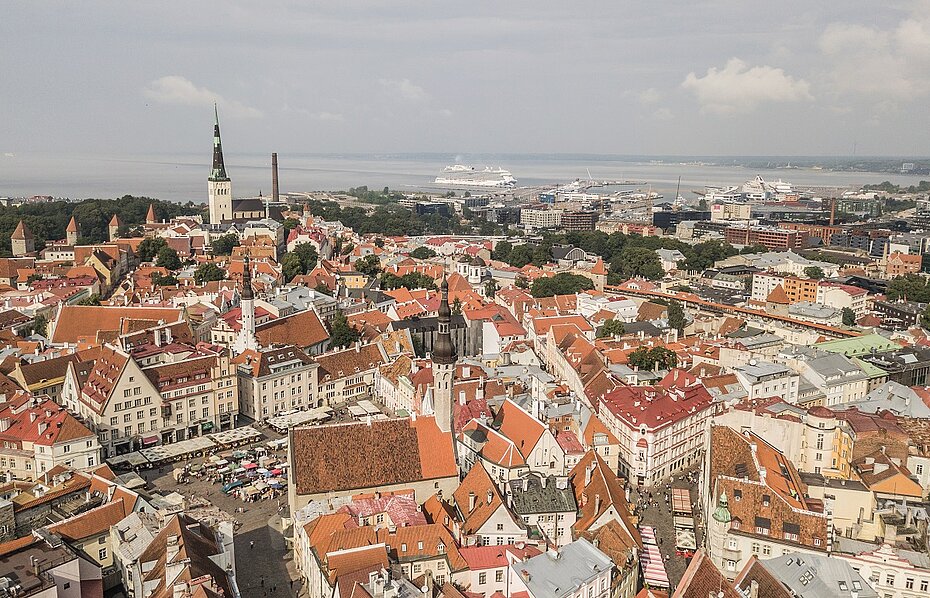
Aerial view of Tallinn city. Envato. N5UDZX64C9
According to 2023 statistics, Estonia, which ranks 132nd in the world in terms of the size of its territory, is home to around 1,3 million people. In terms of population density, the country occupies the 193rd place in the world. The length of the country’s coastline is 3,794 km. Estonia is a parliamentary republic divided into 15 urban municipalities and 64 rural municipalities. The capital and most densely populated area is Tallinn, the official language is Estonian.
The rating positions of Estonia relative to other countries have been determined for an extensive list of economic, energy, innovative and educational indices, as well as for metrics reflecting the state of the environment. The economic indices include, for example, GDP per capita, annual average GDP growth, high-technology exports, and others. The list of energy indices includes proven reserves of oil, gas and coal, production-consumption ratio combined, and energy use, etc. Each of the indices has a ranked list of included member countries. Since the number of countries in each rating is different for each index, the positioning of the country of interest is displayed on a special chart, where the vertical axis is a uniform relative scale from 0 to 1, whereas the horizontal axis denominates the various indices and respective numbers relating to the descriptions given underneath.
Thus, in such a relative “0-1” diagram, the country’s position is marked with a dot in proportion to its location in the original rating list. If the country is among the leaders regarding the selected indicator, it will be marked close to 1 in the upper green zone on the relevant chart “0-1”, if the country is an outsider in the rating list, then it will be marked in the lower red zone of the chart “0-1”, etc.
Ranking position of Estonia for list of economic indices:
| Sources: 1. GDP (purchasing power parity), 2020 est. / The World Factbook/Library/Central Intelligence Agency *228 2. GDP - per capita (PPP), 2020 / The World Factbook/Library/Central Intelligence Agency *229 3. Inflation rate (consumer prices), 2019 est. / The World Factbook/Library/Central Intelligence Agency *228 4. Charges for the use of intellectual property, receipts (BoP, current US$), 2020 / International Monetary Fund, Balance of Payments Statistics Yearbook, and data files. / License: CC BY-4.0 *88 5. The Global Competitiveness Index 2019 / Rankings / Reports / World Economic Forum *141 6. High-technology exports (current US$) 2019-2020 / United Nations, Comtrade database through the WITS platform / License: CCBY-4.0 / Data *134 7. 2021 Index of Economic Freedom / International Economies / The Heritage Foundation *178 8. Reserves of foreign exchange and gold, 2017 est. / The World Factbook / Library / Central Intelligence Agency *195 9. Annual average GDP growth in %, for the last 10 years (2011-2020) / World Bank national accounts data, and OECD National Accounts data files / License: CC BY-4.0*206 10. Public debt (% of GDP), 2017 est. / The World Factbook / Library / Central Intelligence Agency (from smallest to largest) *210 * Total number of countries participating in ranking Figure 1. Economic Indices of Estonia |
Estonian economy is considered to be one of the most liberal in Europe; therefore of all the economic indicators presented in the chart, the highest is the Index of Economic Freedom (0.96). Estonia also scores quite high in Public debt as a % of GDP (0.94) and has a relatively strong position in the Global Competitiveness Index (0.78). The weakest spots in Estonia’s economic indicators are Reserves of foreign exchange and gold (0.16) and Charges for the use of intellectual property (0.43).
Energy Resources
Estonia does not have significant reserves of conventional oil or natural gas. The country‘s most important mineral resource is oil shale, of which Estonia is one of the world‘s producers. According to the World Energy Council [6], Estonian oil shale deposits are evaluated at 16 286 million barrels. Oil shale in the country is used to produce electricity and shale oil.
Table 1. Fossil energy resources of Estonia
| Resource /Explanations | Crude oil | Natural gas | Coal | Oil shale* |
|---|---|---|---|---|
| Value | - | - | - | 16286 |
| Unit | - | - | - | million barrels |
| Year | - | - | - | 2008 |
| Source | [-] | [-] | [-] | [6] |
*in-place resources
Estonia has favorable conditions for the development of renewable energy, particular the wind power. In a number of regions of the country, especially on the coast, wind speed reaches 6.5 m/s at a height of 50 m. In contrast, the country does not have the most favorable climatic environment for solar energy development. The highest solar GHI reaches 3 kWh/m2 per day on Saaremaa Island and some other islands.
KUUSIKU. ESTONIA
Latitüde: 58.97 Longitude: 24.73
Average speed: 2.80 m/s Operational share: 52%
Average daily wind speed for 10 years of observations, m/s, 10 m above the ground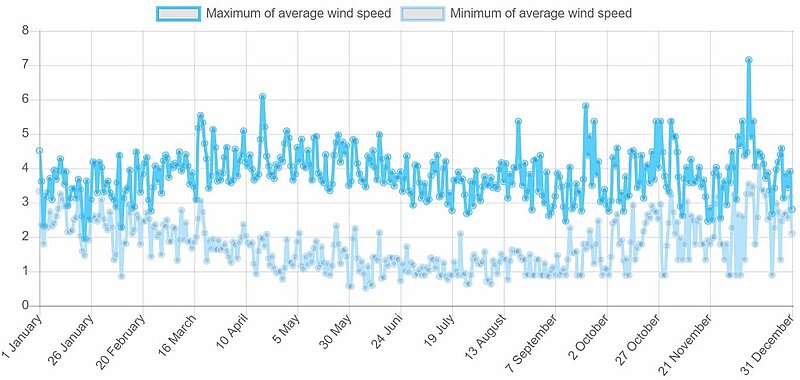
Source: based on NOAA U.S. Department of Commerce
Detailed information: Interactive map of wind resources
KUUSIKU. ESTONIA
Latitüde: 58.97 Longitude: 24.73
Average daily sky coverage over 10 years of observations, %
CLR - clear, SCT - scattered from 1/8 TO 4/8, BKN - broken from 5/8 TO 7/8, OVC - overcast, OBS - obscured, POB - partial obscuration
Source: based on NOAA U.S. Department of Commerce
Detailed information: Interactive map of solar resources
Estonia has quite a lot of water resources. The longest river, the Pärnu, stretches for about 145 km. Although hydroelectricity generation in the country currently accounts for less than 1% of the country's total energy production, hydro resources can play an important role in Estonia's efforts to transition to a more sustainable and diversified energy system.
Table 2. Renewable energy resources of Estonia
| Resource/ explanations | Solar Potential (GHI)* | Wind Potential (50 м)* | Bio Potential (agricultural area) | Bio Potential (forest area) | Hydro energy Potential | Municipal Solid Waste |
|---|---|---|---|---|---|---|
| Value | 2.7-2.8 | 5.0-6.5 | 23.0 | 57.0 | 2 000 | 395 |
| Unit | kWh/m2/day | m/s | % of land area | % of land area | GWh/year | kg per capita |
| Year | 2020 | 2020 | 2020 | 2020 | 2013 | 2021 |
| Source | [7] | [8] | [9] | [10] | [11] | [12] |
*for the majority of the territory of the country
**gross theoretical capability
Almost 80% of the country’s territory is covered by agricultural and forest areas. Industrial waste from these areas provides a sufficient resource base for the development of various bioenergy technologies. Bioenergy is mainly produced from biomass from domestic forests and plays a key role in reducing the use of fossil fuels.
Energy Balance
According to [13], in 2022 in Estonia, the total production of primary energy was 0.017 quadrillion Btu, while consumption was at the level of 0.098 quadrillion Btu. Thus, the share of domestic production in primary energy consumption was about 17.3%. This makes Estonia a country heavily dependent on energy imports.
According to the Statistical Review of World Energy 2022 [14], primary energy consumption in Estonia in 2021 amounted to 0.24 exajoules.
According to the Review by the International Energy Agency, Estonia’s energy mix is dominated by fossil fuels, however the share of fossil fuels in total energy supply declined from 90% in 2010 to 71% in 2022.
Source: U.S. Energy Information Administration (Mar 2024) / https://www.eia.gov
Figure 2. The production and consumption of fossil fuels in Estonia (coal – left, gas – in the center, oil – right)
Estonian oil shale production has been growing steadily over the last twenty years, and in 2022 it was about three times higher than in 2003. At the same time, consumption has not changed dramatically, growing only slightly.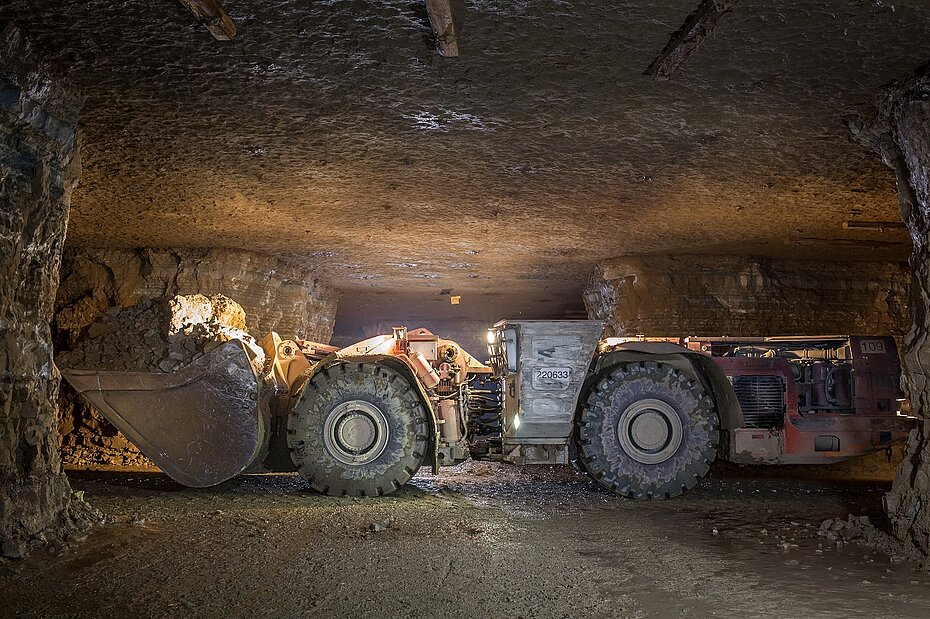
Huge bucket loader operating in Estonia oil-shale mine. Credit – K.Kravik
Estonia produces almost no natural gas or coal. There is a clear downward trend in their consumption. Thus, coal consumption has almost been reduced to nothing, while gas consumption in 2022 was two times less than in 2003.
Sources: U.S. Energy Information Administration (Mar 2024) / www.eia.gov | ||
| Figure 3. Electricity production in Estonia |
As can be seen from the above graph, until 2018 Estonia was self-sufficient in electricity and almost 90% of it was generated by petroleum and gas derived from oil shale. In 2019, electricity generation from oil shale fell sharply and Estonia turned from an exporter to an importer of electricity.
The drop in oil shale generation was partially but not sufficiently compensated by the increase in power production from bioenergy, wind and solar PV.
The chart of Estonia's energy indices is presented in the figure below.
| Sources: 1. Crude oil proved reserves, 2021 / International Energy Statistic/Geography / U.S. Energy Information Administration (Nov 2021)*98 2. Natural gas proved reserves 2021 / International Energy Statistic / Geography / U.S. Energy Information Administration (Nov 2021) *99 3. Total recoverable coal reserves 2019 / International Energy Statistic / Geography / U.S. Energy Information Administration (Nov 2021) *81 4. Combination production-consumption for Crude oil 2018 / International Energy Statistic / Geography / U.S. Energy Information Administration (Nov 2021) *219 5. Combination production-consumption for Natural gas 2019 / International Energy Statistic / Geography / U.S. Energy Information Administration (Nov 2021) *123 6. Combination production-consumption for Coal 2019 / International Energy Statistic / Geography / U.S. Energy Information Administration (Nov 2021) *128 7. Electricity – from other renewable sources (% of total installed capacity), 2017 est. / The World Factbook / Library / Central Intelligence Agency *170 8. GDP per unit of energy use (PPP per unit of oil equivalent), 2020 *66 Primary energy consumption - BP Statistical Review of World Energy 2021/BP;GDP (purchasing power parity) - The World Factbook/Library/Central Intelligence Agency 9. Energy use (primary energy use of oil equivalent per capita) 2020 *127 Primary energy consumption – BP Statistical Review of World Energy 2021; Population - United Nations, Department of Economic and Social Affairs, Population Division (2019). World Population Prospects 2019, custom data acquired via website. Retrieved 15 November 2021*66 10. The Global Energy Architecture Performance Index Report (EAPI) 2017 / Rankings / Reports / World Economic Forum 11. Electric power consumption (kWh per capita), 2016 *217 Electricity Consumption - The World Factbook / Library / Central Intelligence Agency; Population - United Nations, Department of Economic and Social Affairs, Population Division (2019). World Population Prospects 2019, custom data acquired via website. Retrieved 15 November 2021 12. Combination of electricity production-consumption (kWh)/The World Factbook/Library/Central Intelligence Agency *216 * Total number of countries participating in ranking Figure 4. Energy indices of Estonia |
Since Estonia does not have any significant reserves of crude oil, natural gas or coal, the first three positions remain unoccupied. The fact that renewable energy sources provide almost half of the domestically generated electricity is reflected in Estonia's position in Electricity – from other renewable sources (0.88) – the strongest indicator on the graph. Apart from that, the country is relatively well-positioned in the Electric power consumption per capita (0.82) and the Primary energy use of oil equivalent per capita) (0.82). The lowest indicator of Estonian energy indices is GDP per unit of energy use (0.25).
Energy Infrastructure
Estonia's fossil fuel infrastructure, which is dominated by oil shale, is shown on the map below. Oil shale mining and related processes and activities, such as liquefaction and electricity production, take place in Ida-Viru County, located in the north-east of Estonia along the border with the Russian Federation.
Figure 5. Basic infrastructure facilities of the fossil fuel sector in Estonia
According to the Energy Information Administration, the share of fossil fuels in electricity generation in 2022 was 63.5%, followed by other renewables (36.3%) and hydroelectricity (0.2%). When looking at electricity generation from renewable sources, bioenergy leads the way (61.5%), ahead of wind power (25.4%), solar photovoltaics (12.3%) and hydroelectricity (0.8%).
Port of Sillamäe at night. Estonia. Credit – K.Kravik
The Linnamäe power station situated in the lower stretch of the Jägala River on the north of the country is the most powerful hydro-electric power station in Estonia. 
Figure 6. Electricity production in Estonia
According to Statistics Estonia, the amount of electricity produced from oil shale increased by 42% in 2022. Estonia was forced to return to producing electricity from oil shale in an attempt to reduce the supply of natural gas from Russia due to the latter's attack on Ukraine [15]. Despite this, the government intends to end the use of oil shale for electricity generation by 2035 and eliminate the use of solid fossil fuels throughout the energy sector by 2040 [16].
Figure 7. Renewable energy in Estonia
Renewable energy accounted for 36.5% of total electricity production in 2022. More than half (52%) of renewable energy was generated from wood. Bioenergy plays a very important role in the energy system of the country. Estonia has a well-developed infrastructure for biofuel production, in particular many wood pellet production plants, which are spread all over the country.
The largest growth (68%) in renewable energy production was in solar energy, which accounted for 20% of total renewable energy production in 2022 [15].
As part of the transition to 100% renewable electricity, further intensive development of solar energy is planned. Construction of one of the largest solar projects in Estonia, the 45 MW Raba solar power plant, has started in Pärnu County and will be completed in 2024 [17].
According to the Estonian Wind Energy Association, the overall capacity of Estonian wind farms is 320 MW and the total electricity generation in 2021 was 730 GWh. The Aulepa wind farm in Laehan County, with a total capacity of 48 MW, is the largest wind farm, generating about 80 gigawatt-hours of electricity to power about 26,600 conventional homes for one year [18].
Education and Innovation
The following chart shows Estonia’s positions in terms of education and innovation:
| Sources: 1. The Global Innovation Index 2021, Rankings / Knowledge / World Intellectual Property Organization / Cornell University, INSEAD, and WIPO (2021): Energizing the World with Innovation. Ithaca, Fontainebleau, and Geneva *132 2. Patent Grants 2011-2020, resident & abroad / Statistical country profiles / World Intellectual Property Organization *185 3.Patents in Force 2020 / Statistical country profiles / World Intellectual Property Organization *109 4. QS World University Rankings 2022 *97 5. SCImago Country Rankings (1996-2020) / Country rankings / SCImago, (n.d.). SIR-SCImago Journal & Country Rank [Portal]. Retrieved 17 Nov 2021 *240 6. Internet users in 2018 / The World Factbook / Central Intelligence Agency *229 7. Internet users in 2018 (% Population) / The World Factbook / Central Intelligence Agency *229 8. Government expenditure on education, total (% of GDP), 2019 / United Nations Educational, Scientific, and Cultural Organization (UNESCO) Institute for Statistics. License: CCBY-4.0 / Data as of September 2021*177 9. Research and development expenditure (% of GDP), 2018 / UNESCO Institute for Statistics. License: CCBY-4.0 / Data *119 10. Scientific and technical journal articles, 2018 / National Science Foundation, Science and Engineering Indicators. License: CCBY-4.0 / Data *197 * Total number of countries participating in ranking Figure 8. The indices of education and innovation in Estonia |
The majority indices describing the country‘s positioning in the various international rankings related to education and innovation are above average. Estonia has the highest rankings for Internet users as % of the population (0.86) and the Global Innovation Index (0.84). In addition, the government provides a considerable expenditure to support Research and development (0.81) as well as Education (0.67). The lowest spot in the country is the QS World University Rankings 2022 (0.31) and the total number of Internet users (0.41), which is, however, due to the low population of the country.
Ecology and Environment Protection
Indicators related to environmental issues are presented in the following diagram:
| Sources: 1. CO2 total emission by countries 2020 / European Commission / Joint Research Centre (JRC) / Emission Database for Global Atmospheric Research (EDGAR)*208 2. CO2 per capita emission 2020/European Commission/Joint Research Centre (JRC) / Emission Database for Global Atmospheric Research (EDGAR) *208 3. Forest area 2020 (% of land area) / The Global Forest Resources Assessment 2020 / Food and Agriculture Organization of the United Nations *234 4. Forest area change 2010-2020 (1000 ha/year) / The Global Forest Resources Assessment 2020 / Food and Agriculture Organization of the United Nations *234 5. The Environmental Performance Index (EPI) 2020 / Rankings / Yale Center for Environmental Law & Policy / Yale University *180 6. Annual freshwater withdrawals (m3 per capita), 2017 *179 Annual freshwater withdrawals, total (billion m3), 2017 – Food and Agriculture Organization, AQUASTAT data. /License: CC BY-4.0; Population – United Nations, Department of Economic and Social Affairs, Population Division (2019). World Population Prospects 2019, custom data acquired via website. Retrieved 15 November 2021 7. The National Footprint Accounts 2017 (Biocapacity Credit / Deficit) / Global Footprint Network *188 8. Methane emissions (kt of CO2 equivalent), 2018 / Data for up to 1990 are sourced from Carbon Dioxide Information Analysis Center, Environmental Sciences Division, Oak Ridge National Laboratory, Tennessee, United States. Data from 1990 are CAIT data: Climate Watch. 2020. GHG Emissions. Washington, DC: World Resources Institute. Available at: License : Attribution-NonCommercial 4.0 International (CC BY-NC 4.0) *191 9. The Climate Change Performance Index (CCPI) 2022 / Overall Results / Jan Burck, Thea Uhlich, Christoph Bals, Niklas Höhne, Leonardo Nascimento / Germanwatch, NewClimate Institute & Climate Action Network *60 * Total number of countries participating in ranking Figure 9. Environmental Indices of Estonia |
Estonia‘s indexes in the Ecology and Environment Protection sector look quite convincing. Apart from CO2 emissions overall (0.30) and per capita (0.38), and an average ranking in The Climate Change Performance Index (0.50), all of the country’s indicators are at the top of the rankings. The highest of them are Annual freshwater withdrawals (0.96), The National Footprint Accounts (0.83), and Methane emissions (0.82). The fact that forests cover more than half of Estonia’s territory is positively reflected in the graph (0.82). In addition, it should be noted that there is a strong positive trend in the forest area change (0.89).
References
[1] List of sovereign states and dependencies by area / Wikipedia / en.wikipedia.org/wiki/List_of_sovereign_states_and_dependencies_by_area
[2] List of countries and dependencies by population density / Wikipedia / en.wikipedia.org/wiki/List_of_countries_and_dependencies_by_population_density
[3] Estonia / The world factbook / Library / Central Intelligence Agency / www.cia.gov
[4] GDP, PPP (constant 2011 international $) / World Bank, International Comparison Program database. License: CC BY-4.0 / Data / The World Bank / www.worldbank.org
[5] GDP per capita, PPP (current international $) / World Bank, International Comparison Program database. License: CC BY-4.0 / Data / The World Bank / www.worldbank.org
[6] 2010 Survey of Energy Resources (PDF) / 2010 / Uploads / World Energy Council / https://www.worldenergy.org/
[7] Solar resource data obtained from the Global Solar Atlas, owned by the World Bank Group and provided by Solargis / Global Solar Atlas / globalsolaratlas.info
[8] Wind Map / Global Wind Atlas 2.0, a free, web-based application developed, owned and operated by the Technical University of Denmark (DTU) in partnership with the World Bank Group, utilizing data provided by Vortex, with funding provided by the Energy Sector Management Assistance Program (ESMAP). For additional information: globalwindatlas.info
[9] Agricultural land (% of land area) /Food and Agriculture Organization, electronic files and web site. License: CC BY-4.0 / Data / The World Bank / www.worldbank.org
[10] Forest area (% of land area) /Food and Agriculture Organization, electronic files and web site. License: CC BY-4.0 / Data / The World Bank / www.worldbank.org
[11] Hydro (PDF) / World Energy Council / https://www.worldenergy.org/
[12] Municipal waste statistics Updated / Statistics Explained / Eurostat / https://ec.europa.eu/eurostat/statistics-explained/index.php?title=Municipal_waste_statistics
[13] International Energy Statistic / Geography / U.S. Energy Information Administration / www.eia.gov/beta/international/
[14] BP Statistical Review of World Energy 2020-2022 (PDF) / BP / www.bp.com
[15] Statistics Estonia / https://www.stat.ee/en/news/oil-shale-electricity-production-increased-last-year
[16] Governance agreement for 2021–2023 / https://valitsus.ee/en/governance-agreement-2021-2023
[17] Sunly x Metsagrupp building one of the largest solar parks in Estonia / https://sunly.ee/sunly-x-metsagrupp-building-one-of-the-largest-solar-parks-in-estonia/
[18] Eesti Tuuleenergia Assotsiatsioon / https://tuuleenergia.ee/?lang=en
The sources of charts and curves are specified under the images.
For more information about the energy industry in Estonia see here