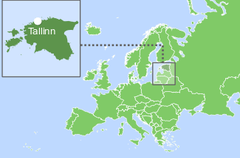

爱沙尼亚,正式名称为爱沙尼亚共和国,是欧洲东北部的一个波罗的海国家,北临芬兰湾,西临波罗的海,南接拉脱维亚,东临俄罗斯和佩普斯湖。除大陆外,爱沙尼亚的领土还包括萨雷马岛和希乌马岛大岛以及波罗的海东岸的2000多个岛屿和小岛。
| Estonia / Republic of Estonia | ||
|---|---|---|
| Capital: Tallinn | Density: 30.6/km2 | Currency: Euro (€) (EUR) |
| Official languages: Estonian | Life expectancy at birth: 78.35 years | GDP (PPP): $61.757 billion (2023 est.) |
| National Day: 24 February | Area (land): 45,339 km2 | GDP - per capita (PPP): $46,385 (2023 est.) |
| Population: 1,357,739 (2023 est.) | Coastline: 3,794 km | Internet country code: .ee |
Source: [1,2,3,4,5]
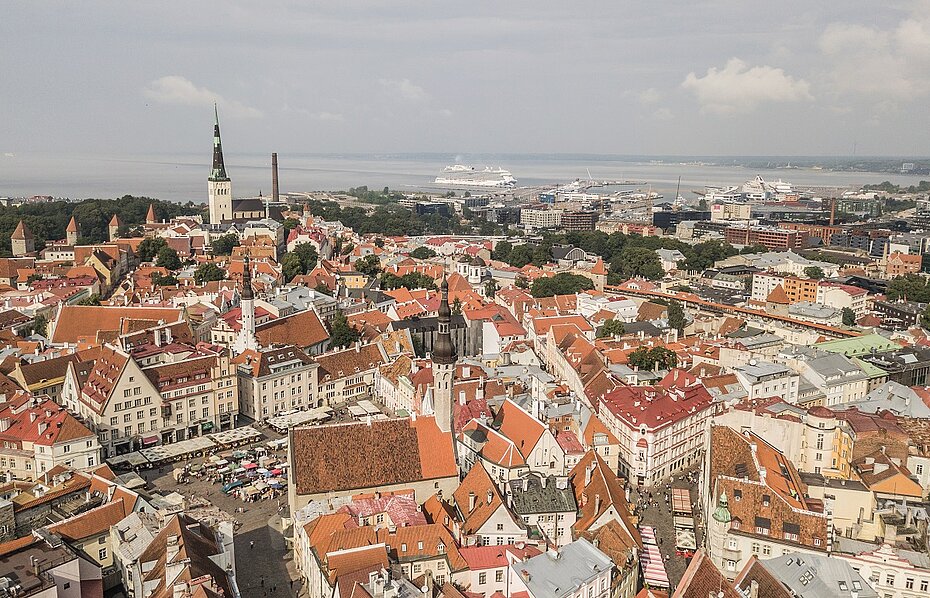
Aerial view of Tallinn city. Envato. N5UDZX64C9
据2023年统计,爱沙尼亚国土面积排名世界第132位,人口约130万。按人口密度计算,该国居世界第193位。该国海岸线长度为3,794公里。爱沙尼亚是一个议会制共和国,分为 15 个城市自治市和 64 个农村自治市。首都和人口最稠密的地区是塔林,官方语言是爱沙尼亚语。
爱沙尼亚相对于其他国家的评级位置是根据一系列广泛的经济、能源、创新和教育指数以及反映环境状况的指标确定的。经济指标包括人均GDP、年均GDP增长率、高新技术出口等。能源指数列表包括石油、天然气和煤炭的探明储量、产耗比以及能源使用情况等。每个指数都有一个包含的成员国排名列表。由于每个指数的每个评级的国家数量不同,因此将感兴趣的国家的定位显示在一个特殊的图表上,其中纵轴是从0到1的统一相对刻度,而横轴表示各个指数以及与下面给出的描述相关的相应编号。
因此,在这样一个相对的“0-1”图中,该国家的位置按照其在原始评级列表中的位置成比例地用点来标记。如果该国在所选指标方面处于领先地位,则将在相关图表“0-1”的上部绿色区域中标记为接近 1,如果该国在评级列表中属于局外人,则将标记为接近 1图表下方红色区域“0-1”等
爱沙尼亚经济指数列表排名:
| Sources: 1. GDP (purchasing power parity), 2020 est. / The World Factbook/Library/Central Intelligence Agency *228 2. GDP - per capita (PPP), 2020 / The World Factbook/Library/Central Intelligence Agency *229 3. Inflation rate (consumer prices), 2019 est. / The World Factbook/Library/Central Intelligence Agency *228 4. Charges for the use of intellectual property, receipts (BoP, current US$), 2020 / International Monetary Fund, Balance of Payments Statistics Yearbook, and data files. / License: CC BY-4.0 *88 5. The Global Competitiveness Index 2019 / Rankings / Reports / World Economic Forum *141 6. High-technology exports (current US$) 2019-2020 / United Nations, Comtrade database through the WITS platform / License: CCBY-4.0 / Data *134 7. 2021 Index of Economic Freedom / International Economies / The Heritage Foundation *178 8. Reserves of foreign exchange and gold, 2017 est. / The World Factbook / Library / Central Intelligence Agency *195 9. Annual average GDP growth in %, for the last 10 years (2011-2020) / World Bank national accounts data, and OECD National Accounts data files / License: CC BY-4.0*206 10. Public debt (% of GDP), 2017 est. / The World Factbook / Library / Central Intelligence Agency (from smallest to largest) *210 * Total number of countries participating in ranking 图 1. 爱沙尼亚的经济指数 |
爱沙尼亚经济被认为是欧洲最自由的经济体之一;因此,在图表中呈现的所有经济指标中,最高的是经济自由指数(0.96)。爱沙尼亚的公共债务占 GDP 的比例也很高(0.94),并且在全球竞争力指数中拥有相对较强的地位(0.78)。爱沙尼亚经济指标中最薄弱的部分是外汇和黄金储备(0.16)和知识产权使用费(0.43)。
爱沙尼亚没有大量常规石油或天然气储量。该国最重要的矿产资源是油页岩,爱沙尼亚是世界上的生产国之一。根据世界能源理事会[6]的数据,爱沙尼亚油页岩储量估计为 162.86 亿桶。该国的油页岩用于生产电力和页岩油。
表1. 爱沙尼亚化石能源资源
| Resource /Explanations | Crude oil | Natural gas | Coal | Oil shale* |
|---|---|---|---|---|
| Value | - | - | - | 16286 |
| Unit | - | - | - | million barrels |
| Year | - | - | - | 2008 |
| Source | [-] | [-] | [-] | [6] |
*就地资源
爱沙尼亚具有发展可再生能源特别是风电的有利条件。全国部分地区,特别是沿海地区,50m高度处风速达到6.5m/s。相比之下,该国并不具备最有利于太阳能发展的气候环境。萨雷马岛和其他一些岛屿的太阳能 GHI 最高达到每天 3 kWh/m2。
KUUSIKU. ESTONIA
Latitüde: 58.97 Longitude: 24.73
Average speed: 2.80 m/s Operational share: 52%
Average daily wind speed for 10 years of observations, m/s, 10 m above the ground
Source: based on NOAA U.S. Department of Commerce
Detailed information: Interactive map of wind resources
KUUSIKU. ESTONIA
Latitüde: 58.97 Longitude: 24.73
Average daily sky coverage over 10 years of observations, %
CLR - clear, SCT - scattered from 1/8 TO 4/8, BKN - broken from 5/8 TO 7/8, OVC - overcast, OBS - obscured, POB - partial obscuration
Source: based on NOAA U.S. Department of Commerce
Detailed information: Interactive map of solar resources
爱沙尼亚拥有相当多的水资源。最长的河流派尔努河全长约 145 公里。尽管目前该国的水力发电量仅占该国能源总产量的不到1%,但水力资源可以在爱沙尼亚向更加可持续和多元化的能源系统转型的努力中发挥重要作用。
表2. 爱沙尼亚的可再生能源资源
| Resource/ explanations | Solar Potential (GHI)* | Wind Potential (50 м)* | Bio Potential (agricultural area) | Bio Potential (forest area) | Hydro energy Potential | Municipal Solid Waste |
|---|---|---|---|---|---|---|
| Value | 2.7-2.8 | 5.0-6.5 | 23.0 | 57.0 | 2 000 | 395 |
| Unit | kWh/m2/day | m/s | % of land area | % of land area | GWh/year | kg per capita |
| Year | 2020 | 2020 | 2020 | 2020 | 2013 | 2021 |
| Source | [7] | [8] | [9] | [10] | [11] | [12] |
*国家大部分领土
**总理论能力
国家近 80% 的领土被农业和林区覆盖。这些地区的工业废物为各种生物能源技术的发展提供了充足的资源基础。生物能源主要由国内森林的生物质产生,在减少化石燃料的使用方面发挥着关键作用。
根据[13],2021年爱沙尼亚一次能源总产量为0.028 Btu,而消费量为0.117 Btu。因此,国内生产在一次能源消费中的份额约为24%。这使得爱沙尼亚成为一个严重依赖能源进口的国家。
根据《2022年世界能源统计回顾》[14],2021年爱沙尼亚一次能源消费量为0.24艾焦耳。
根据国际能源署的审查,爱沙尼亚的能源结构以化石燃料为主,但化石燃料占能源供应总量的比重从2010年的90%下降到2022年的71%。
Source: U.S. Energy Information Administration (Mar 2024) / https://www.eia.gov
图 2. 爱沙尼亚化石燃料的生产和消费(煤炭 – 左,天然气 – 中,石油 – 右)
爱沙尼亚油页岩过去20年产量一直稳定增长,2022年比2003年增长约三倍。与此同时,消费并没有发生巨大变化,仅小幅增长。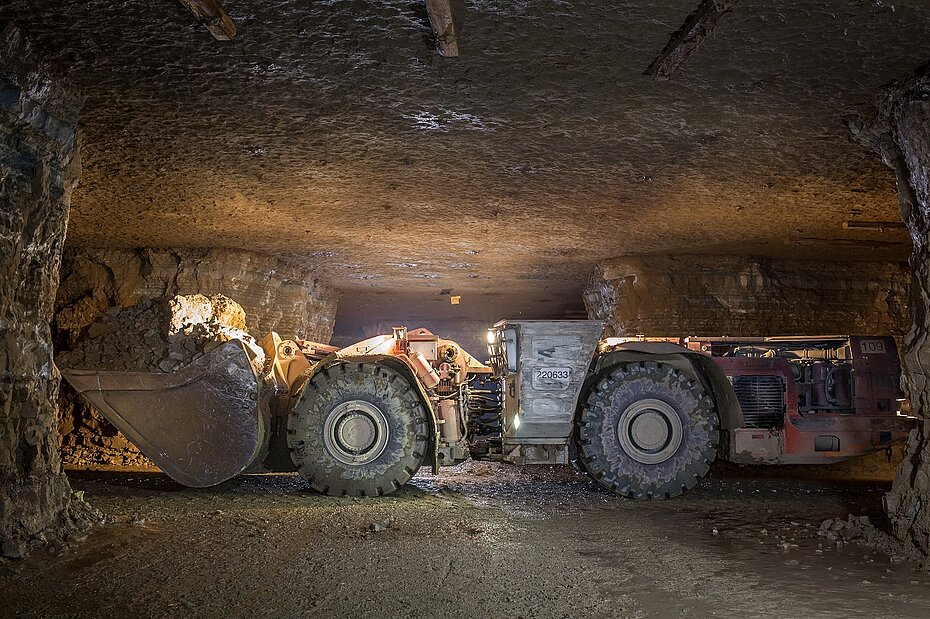
Huge bucket loader operating in Estonia oil-shale mine. Credit – K.Kravik
爱沙尼亚几乎不生产天然气或煤炭。他们的消费呈现出明显的下降趋势。因此,煤炭消耗几乎为零,而2022年天然气消耗量比2003年减少两倍。
| Sources: U.S. Energy Information Administration (Mar 2024) / www.eia.gov | ||
图 3. 爱沙尼亚的发电量 |
从上图可以看出,直到2018年爱沙尼亚电力自给自足,其中近90%是由油页岩中的石油和天然气产生的。2019年,油页岩发电量大幅下降,爱沙尼亚从电力出口国变成了电力进口国。
生物能源、风能和太阳能光伏发电的增加部分但不足以弥补油页岩发电量的下降。
爱沙尼亚能源指数图表如下图所示。
| Sources: 1. Crude oil proved reserves, 2021 / International Energy Statistic/Geography / U.S. Energy Information Administration (Nov 2021)*98 2. Natural gas proved reserves 2021 / International Energy Statistic / Geography / U.S. Energy Information Administration (Nov 2021) *99 3. Total recoverable coal reserves 2019 / International Energy Statistic / Geography / U.S. Energy Information Administration (Nov 2021) *81 4. Combination production-consumption for Crude oil 2018 / International Energy Statistic / Geography / U.S. Energy Information Administration (Nov 2021) *219 5. Combination production-consumption for Natural gas 2019 / International Energy Statistic / Geography / U.S. Energy Information Administration (Nov 2021) *123 6. Combination production-consumption for Coal 2019 / International Energy Statistic / Geography / U.S. Energy Information Administration (Nov 2021) *128 7. Electricity – from other renewable sources (% of total installed capacity), 2017 est. / The World Factbook / Library / Central Intelligence Agency *170 8. GDP per unit of energy use (PPP per unit of oil equivalent), 2020 *66 Primary energy consumption - BP Statistical Review of World Energy 2021/BP;GDP (purchasing power parity) - The World Factbook/Library/Central Intelligence Agency 9. Energy use (primary energy use of oil equivalent per capita) 2020 *127 Primary energy consumption – BP Statistical Review of World Energy 2021; Population - United Nations, Department of Economic and Social Affairs, Population Division (2019). World Population Prospects 2019, custom data acquired via website. Retrieved 15 November 2021*66 10. The Global Energy Architecture Performance Index Report (EAPI) 2017 / Rankings / Reports / World Economic Forum 11. Electric power consumption (kWh per capita), 2016 *217 Electricity Consumption - The World Factbook / Library / Central Intelligence Agency; Population - United Nations, Department of Economic and Social Affairs, Population Division (2019). World Population Prospects 2019, custom data acquired via website. Retrieved 15 November 2021 12. Combination of electricity production-consumption (kWh)/The World Factbook/Library/Central Intelligence Agency *216 * Total number of countries participating in ranking 图 4. 爱沙尼亚的能源指数 |
由于爱沙尼亚没有大量的原油、天然气或煤炭储量,因此前三个位置仍然无人占据。可再生能源提供了近一半的国内发电量,这一事实反映在爱沙尼亚在“来自其他可再生能源的电力”(0.88) 中的地位,这是图表上最强的指标。除此之外,该国在人均电力消耗(0.82)和人均一次能源使用量(石油当量)(0.82)方面处于相对有利的位置。爱沙尼亚能源指数的最低指标是每单位能源使用的GDP(0.25)。
爱沙尼亚的化石燃料基础设施以油页岩为主,如下图所示。油页岩开采以及液化和电力生产等相关工艺和活动在位于爱沙尼亚东北部与俄罗斯联邦边境的伊达维鲁县进行。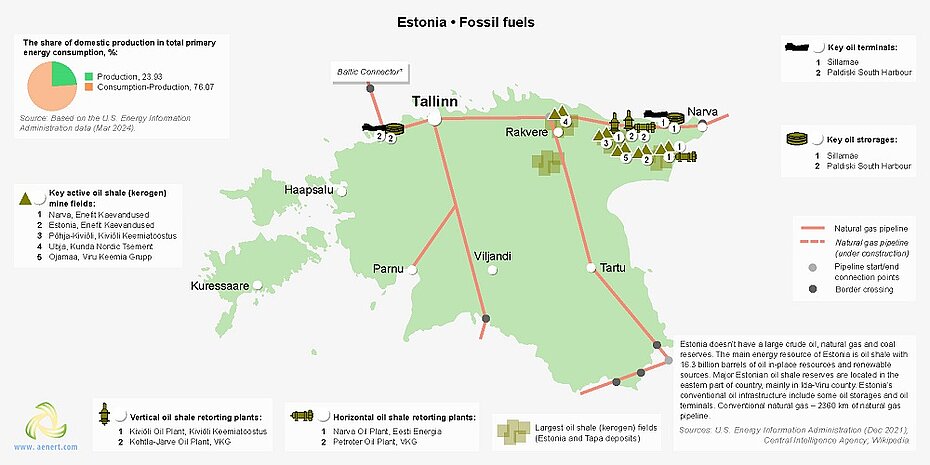
图5.爱沙尼亚化石燃料行业的基础设施
根据能源信息管理局的数据,2022年化石燃料在发电中的份额为63.5%,其次是其他可再生能源(36.3%)和水力发电(0.2%)。在可再生能源发电方面,生物能源处于领先地位(61.5%),领先于风电(25.4%)、太阳能光伏发电(12.3%)和水力发电(0.8%)。
Port of Sillamäe at night. Estonia. Credit – K.Kravik
Linnamäe 电站位于该国北部的 Jägala 河下游,是爱沙尼亚最强大的水力发电站。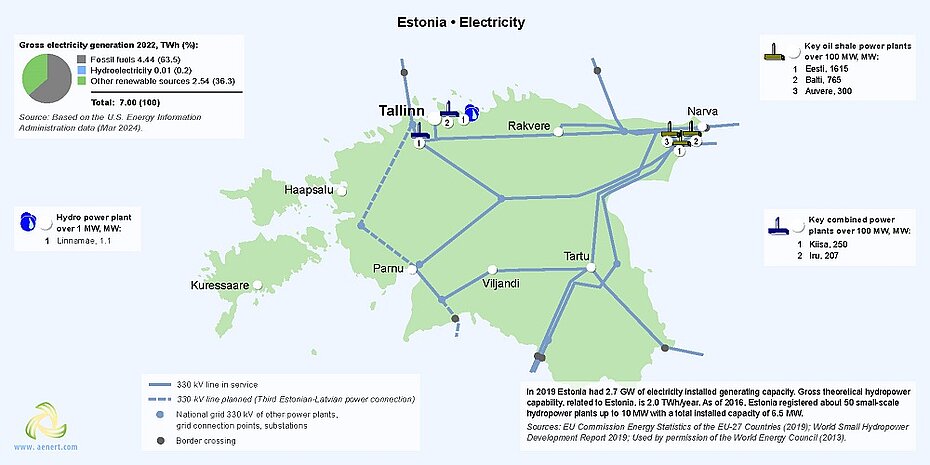
图 6. 爱沙尼亚的发电量
据爱沙尼亚统计局称,2022年油页岩发电量增加了42%。由于俄罗斯对乌克兰的袭击,爱沙尼亚被迫恢复油页岩发电,试图减少俄罗斯的天然气供应 [15]。 尽管如此,政府仍计划到 2035 年停止使用油页岩发电,并到 2040 年在整个能源领域消除固体化石燃料的使用[16]。
图 7. 爱沙尼亚的可再生能源
到 2022 年,可再生能源占发电总量的 36.5%。超过一半 (52%) 的可再生能源来自木材。 生物能源在国家能源体系中发挥着非常重要的作用。 爱沙尼亚拥有发达的生物燃料生产基础设施,特别是许多木颗粒生产厂,遍布全国各地。
可再生能源产量增长最大(68%)是太阳能,到2022年,太阳能占可再生能源总产量的20%[15]。
作为向 100% 可再生电力过渡的一部分,计划进一步集约开发太阳能。 爱沙尼亚最大的太阳能项目之一,45 兆瓦的拉巴太阳能发电厂已在派尔努县动工,将于 2024 年完工[17]。
据爱沙尼亚风能协会统计,爱沙尼亚风电场总容量为320兆瓦,2021年总发电量为730吉瓦时。 莱汉县的奥莱帕风电场总容量为 48 兆瓦,是最大的风电场,发电量约为 80 吉瓦时,可供约 26,600 个传统家庭使用一年[18]。
| Sources: 1. The Global Innovation Index 2021, Rankings / Knowledge / World Intellectual Property Organization / Cornell University, INSEAD, and WIPO (2021): Energizing the World with Innovation. Ithaca, Fontainebleau, and Geneva *132 2. Patent Grants 2011-2020, resident & abroad / Statistical country profiles / World Intellectual Property Organization *185 3.Patents in Force 2020 / Statistical country profiles / World Intellectual Property Organization *109 4. QS World University Rankings 2022 *97 5. SCImago Country Rankings (1996-2020) / Country rankings / SCImago, (n.d.). SIR-SCImago Journal & Country Rank [Portal]. Retrieved 17 Nov 2021 *240 6. Internet users in 2018 / The World Factbook / Central Intelligence Agency *229 7. Internet users in 2018 (% Population) / The World Factbook / Central Intelligence Agency *229 8. Government expenditure on education, total (% of GDP), 2019 / United Nations Educational, Scientific, and Cultural Organization (UNESCO) Institute for Statistics. License: CCBY-4.0 / Data as of September 2021*177 9. Research and development expenditure (% of GDP), 2018 / UNESCO Institute for Statistics. License: CCBY-4.0 / Data *119 10. Scientific and technical journal articles, 2018 / National Science Foundation, Science and Engineering Indicators. License: CCBY-4.0 / Data *197 * Total number of countries participating in ranking 图 8. 爱沙尼亚的教育和创新指数 |
描述该国在教育和创新相关的各种国际排名中的定位的大多数指数都高于平均水平。爱沙尼亚的互联网用户占人口百分比(0.86)和全球创新指数(0.84)排名最高。此外,政府还提供大量支出来支持研究与开发(0.81)以及教育(0.67)。该国排名最低的是 2022 年 QS 世界大学排名(0.31)和互联网用户总数(0.41),但这是由于该国人口较少。
| Sources: 1. CO2 total emission by countries 2020 / European Commission / Joint Research Centre (JRC) / Emission Database for Global Atmospheric Research (EDGAR)*208 2. CO2 per capita emission 2020/European Commission/Joint Research Centre (JRC) / Emission Database for Global Atmospheric Research (EDGAR) *208 3. Forest area 2020 (% of land area) / The Global Forest Resources Assessment 2020 / Food and Agriculture Organization of the United Nations *234 4. Forest area change 2010-2020 (1000 ha/year) / The Global Forest Resources Assessment 2020 / Food and Agriculture Organization of the United Nations *234 5. The Environmental Performance Index (EPI) 2020 / Rankings / Yale Center for Environmental Law & Policy / Yale University *180 6. Annual freshwater withdrawals (m3 per capita), 2017 *179 Annual freshwater withdrawals, total (billion m3), 2017 – Food and Agriculture Organization, AQUASTAT data. /License: CC BY-4.0; Population – United Nations, Department of Economic and Social Affairs, Population Division (2019). World Population Prospects 2019, custom data acquired via website. Retrieved 15 November 2021 7. The National Footprint Accounts 2017 (Biocapacity Credit / Deficit) / Global Footprint Network *188 8. Methane emissions (kt of CO2 equivalent), 2018 / Data for up to 1990 are sourced from Carbon Dioxide Information Analysis Center, Environmental Sciences Division, Oak Ridge National Laboratory, Tennessee, United States. Data from 1990 are CAIT data: Climate Watch. 2020. GHG Emissions. Washington, DC: World Resources Institute. Available at: License : Attribution-NonCommercial 4.0 International (CC BY-NC 4.0) *191 9. The Climate Change Performance Index (CCPI) 2022 / Overall Results / Jan Burck, Thea Uhlich, Christoph Bals, Niklas Höhne, Leonardo Nascimento / Germanwatch, NewClimate Institute & Climate Action Network *60 * Total number of countries participating in ranking 图9. 爱沙尼亚环境指数 |
爱沙尼亚在生态和环境保护领域的指数看起来很有说服力。除了CO 2排放总量(0.30)和人均排放量(0.38)以及气候变化绩效指数平均排名(0.50)外,该国的所有指标均位居前列。其中最高的是年度淡水抽取量(0.96)、国家足迹账户(0.83)和甲烷排放量(0.82)。图表(0.82)积极反映了森林覆盖爱沙尼亚一半以上领土的事实。此外,值得注意的是,森林面积变化呈现强烈的正向变化趋势(0.89)。
[1] List of sovereign states and dependencies by area / Wikipedia / en.wikipedia.org/wiki/List_of_sovereign_states_and_dependencies_by_area
[2] List of countries and dependencies by population density / Wikipedia / en.wikipedia.org/wiki/List_of_countries_and_dependencies_by_population_density
[3] Estonia / The world factbook / Library / Central Intelligence Agency / www.cia.gov
[4] GDP, PPP (constant 2011 international $) / World Bank, International Comparison Program database. License: CC BY-4.0 / Data / The World Bank / www.worldbank.org
[5] GDP per capita, PPP (current international $) / World Bank, International Comparison Program database. License: CC BY-4.0 / Data / The World Bank / www.worldbank.org
[6] 2010 Survey of Energy Resources (PDF) / 2010 / Uploads / World Energy Council / https://www.worldenergy.org/
[7] Solar resource data obtained from the Global Solar Atlas, owned by the World Bank Group and provided by Solargis / Global Solar Atlas / globalsolaratlas.info
[8] Wind Map / Global Wind Atlas 2.0, a free, web-based application developed, owned and operated by the Technical University of Denmark (DTU) in partnership with the World Bank Group, utilizing data provided by Vortex, with funding provided by the Energy Sector Management Assistance Program (ESMAP). For additional information: globalwindatlas.info
[9] Agricultural land (% of land area) /Food and Agriculture Organization, electronic files and web site. License: CC BY-4.0 / Data / The World Bank / www.worldbank.org
[10] Forest area (% of land area) /Food and Agriculture Organization, electronic files and web site. License: CC BY-4.0 / Data / The World Bank / www.worldbank.org
[11] Hydro (PDF) / World Energy Council / https://www.worldenergy.org/
[12] Municipal waste statistics Updated / Statistics Explained / Eurostat / https://ec.europa.eu/eurostat/statistics-explained/index.php?title=Municipal_waste_statistics
[13] International Energy Statistic / Geography / U.S. Energy Information Administration / www.eia.gov/beta/international/
[14] BP Statistical Review of World Energy 2020-2022 (PDF) / BP / www.bp.com
[15] Statistics Estonia / https://www.stat.ee/en/news/oil-shale-electricity-production-increased-last-year
[16] Governance agreement for 2021–2023 / https://valitsus.ee/en/governance-agreement-2021-2023
[17] Sunly x Metsagrupp building one of the largest solar parks in Estonia / https://sunly.ee/sunly-x-metsagrupp-building-one-of-the-largest-solar-parks-in-estonia/
[18] Eesti Tuuleenergia Assotsiatsioon / https://tuuleenergia.ee/?lang=en
图表和曲线的来源在图像下指定。
有关爱沙尼亚能源行业的更多信息,请参见此处