
克罗地亚共和国位于欧洲南部,部分位于巴尔干半岛。 克罗地亚北与斯洛文尼亚和匈牙利接壤,东与塞尔维亚接壤,南与黑山接壤。 克罗地亚与波斯尼亚和黑塞哥维那有最长的陆地边界,位于大陆西南部和北部。 该国南部和西南部濒临亚得里亚海,海岸线略小于1800公里。 克罗地亚约有 390 万人居住,该国人口密度相对较低,为 68.4 人/平方公里。 克罗地亚是议会制共和国。 该国于1991年从南斯拉夫分离期间获得独立。 克罗地亚首都是萨格勒布,居住着超过80万人口。
| Croatia | ||
|---|---|---|
| Capital: Zagreb | Density: 68.4/km2 | Currency: (€) (EUR) |
| Official languages: Croatian | Life expectancy at birth: 74.02 years | GDP (PPP): $172.781 billion (2024 est.) |
| National Day: 25 June | Area (land): 56,594 km2 | GDP - per capita (PPP): $45,087 (2024 est.) |
| Population: 3,855,64 (2022 est.) | Coastline: 1,777 km | Internet country code: .hr |
Source: [1,2,3,4,5]
克罗地亚相对于其他国家的排名是根据一系列广泛的经济、能源、创新和教育指数以及反映环境状况的指标确定的。 经济指标包括人均GDP、年均GDP增长率、高新技术出口等。 能源指数列表包括石油、天然气和煤炭的探明储量、产耗比以及能源使用情况等。每个指数都有一个包含的成员国排名列表。 由于每个指数的每个评级的国家数量不同,因此将感兴趣的国家的定位显示在一个特殊的图表上,其中纵轴是从0到1的统一相对刻度,而横轴表示各个指数 以及与下面给出的描述相关的相应编号。
因此,在这样一个相对的“0-1”图中,该国家的位置按照其在原始评级列表中的位置成比例地用点来标记。 如果该国在所选指标方面处于领先地位,则将在相关图表“0-1”的上部绿色区域中标记为接近 1,如果该国在评级列表中属于局外人,则将标记为接近 1 在图表的下部红色区域“0-1”等。
克罗地亚经济指数排名:
| Sources: 1. GDP (purchasing power parity), 2020 est. / The World Factbook/Library/Central Intelligence Agency *228 2. GDP - per capita (PPP), 2020 / The World Factbook/Library/Central Intelligence Agency *229 3. Inflation rate (consumer prices), 2019 est. / The World Factbook/Library/Central Intelligence Agency *228 4. Charges for the use of intellectual property, receipts (BoP, current US$), 2020 / International Monetary Fund, Balance of Payments Statistics Yearbook, and data files. / License: CC BY-4.0 *88 5. The Global Competitiveness Index 2019 / Rankings / Reports / World Economic Forum *141 6. High-technology exports (current US$) 2019-2020 / United Nations, Comtrade database through the WITS platform / License: CCBY-4.0 / Data *134 7. 2021 Index of Economic Freedom / International Economies / The Heritage Foundation *178 8. Reserves of foreign exchange and gold, 2017 est. / The World Factbook / Library / Central Intelligence Agency *195 9. Annual average GDP growth in %, for the last 10 years (2011-2020) / World Bank national accounts data, and OECD National Accounts data files / License: CC BY-4.0*206 10. Public debt (% of GDP), 2017 est. / The World Factbook / Library / Central Intelligence Agency (from smallest to largest) *210 * Total number of countries participating in ranking 图1. 克罗地亚经济指数 |
对于图表中显示的大多数指数来说,克罗地亚处于排名的中间或略高于中间的位置。 克罗地亚经济指标中最薄弱的部分是年平均 GDP 增长率(%)和公共债务,该国在这方面排名垫底。 在所列出的指数中,克罗地亚的国内生产总值、人均国内生产总值以及外汇和黄金储备值最高。
克罗地亚没有大量化石燃料储备。 例如,克罗地亚石油储量占世界储量的比例为0.004%,天然气储量为0.0124%。 以吨油当量计算,根据2024年数据,按燃料类型划分的常规探明储量为:石油30.1%,天然气69.9%(图5)。
表1. 克罗地亚化石能源资源
| Resource /Explanations | Crude oil* | Natural gas* | Coal | Shale Gas | Tight Oil | Coalmine methane |
|---|---|---|---|---|---|---|
| Value | 71 (0.004%) | 24.919 (0.0124%) | - | - | - | - |
| Unit | million barrels | Tcf | - | - | - | - |
| Year | 2021 | 2020 | - | - | - | - |
| Source | [3] | [3] | - | - | - | - |
* 括号内提供该国储量占世界总储量的比例
克罗地亚的可再生资源矩阵没有表现出异常或极端的价值。 该国有多条大河,包括多瑙河、萨瓦河和德拉瓦河,这些河流大部分沿着该国边境流淌,因此很难利用它们进行水力发电。 生物能源有一定的发展潜力,特别是颗粒、沼气、生物质气化的生产。 然而,农业用地和森林总面积相对较小,这意味着不可能到处提供足够数量的原料。
另一方面,该国拥有广阔的太阳能活动充足的地区,可以安装高效发电的太阳能发电厂。
表2. 克罗地亚的可再生能源资源
| Resource/ Explanations | Solar Potential (GHI)* | Wind Potential (50 м)* | Bio Potential (agricultural area) | Bio Potential (forest area) | Municipal Solid Waste |
|---|---|---|---|---|---|
| Value | 3.5-4.1 | 5.0-7.0 | 26.9 | 34.7 | 446 |
| Unit | kWh/m2/day | m/s | % of land area | % of land area | kg per capita |
| Year | 2020 | 2020 | 2020 | 2020 | 2021 |
| Source | [7] | [8] | [9] | [10] | [11] |
*该国大部分领土
风资源状况更加好。 该国多个地区的风速达到7 m/s以上,其中一些位于海岸线,另一些则位于该国的内陆地区。 下图是亚得里亚海沿岸希贝尼克地区十年观测期内参考日历年的平均统计风速图(基于美国商务部国家海洋和大气管理局)。
SIBENIK: Latitude: 43.73, Longitude: 15.92, height of 10 m
Average speed: 3.26 m/s, Operational share: 56%
Wind speed, m/s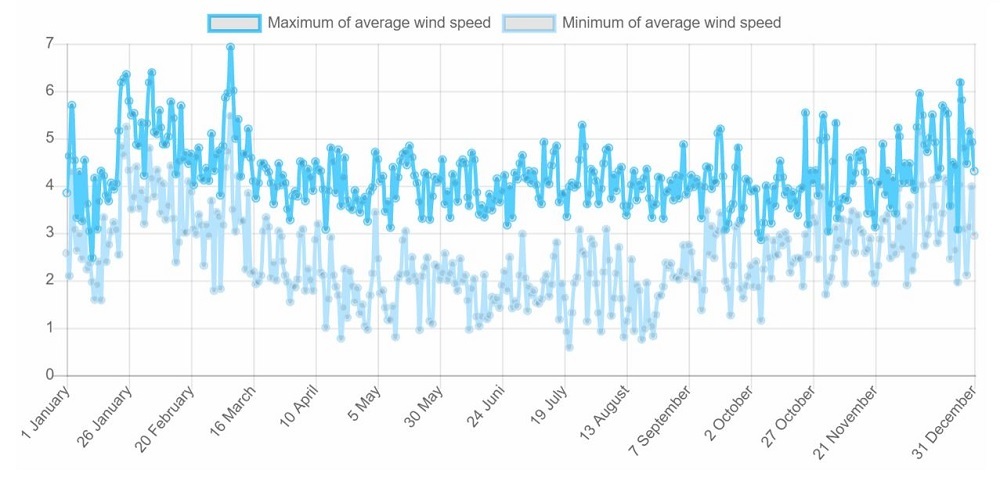
根据[6],2022年克罗地亚一次能源总产量为0.088万亿英热单位,而消费量为0.302万亿英热单位。 因此,国内生产占一次能源消费的比重为29.1%。 这说明克罗地亚是一个极度依赖能源进口的国家。 一次能源消费以石油为主(占 38%),其次是天然气(占 29%)和可再生资源(占 28%)。 煤炭在这里所占的份额最小——大约 5% [6]。
Source: U.S. Energy Information Administration (Mar 2024) / www.eia.gov
图 2. 克罗地亚化石燃料的生产和消费(煤炭 – 左,天然气 – 中,石油 – 右)
克罗地亚的石油和天然气产量在过去二十年中一直在稳步下降,除非局部产量出现一些峰值。 由于国内没有资源基础或生产,煤炭仅通过进口消费。
如图3所示,克罗地亚国内发电量远远落后于消费量。 过去十年,该国电力消耗量约为16太瓦时,发电量约为10至14太瓦时。 然而,在过去三年中,发电量逐年增加,主要来自可再生能源。
Sources: U.S. Energy Information Administration (Mar 2024) / www.eia.gov | ||
图 3. 克罗地亚的发电量 |
克罗地亚能源指数图表如下图所示。
Sources: 1. Crude oil proved reserves, 2021/International Energy Statistic/Geography/U.S. Energy Information Administration (Nov 2021)*98 2. Natural gas proved reserves 2021 / International Energy Statistic / Geography / U.S. Energy Information Administration (Nov 2021) *99 3. Total recoverable coal reserves 2019 / International Energy Statistic / Geography / U.S. Energy Information Administration (Nov 2021) *81 4. Combination production-consumption for Crude oil 2018 / International Energy Statistic / Geography / U.S. Energy Information Administration (Nov 2021) *219 5. Combination production-consumption for Natural gas 2019 / International Energy Statistic / Geography / U.S. Energy Information Administration (Nov 2021) *123 6. Combination production-consumption for Coal 2019 / International Energy Statistic / Geography / U.S. Energy Information Administration (Nov 2021) *128 7. Electricity – from other renewable sources (% of total installed capacity), 2017 est. / The World Factbook / Library / Central Intelligence Agency *170 8. GDP per unit of energy use (PPP per unit of oil equivalent), 2020 *66 Primary energy consumption - BP Statistical Review of World Energy 2021/BP;GDP (purchasing power parity) - The World Factbook/Library/Central Intelligence Agency 9. Energy use (primary energy use of oil equivalent per capita) 2020 *127 Primary energy consumption – BP Statistical Review of World Energy 2021; Population - United Nations, Department of Economic and Social Affairs, Population Division (2019). World Population Prospects 2019, custom data acquired via website. Retrieved 15 November 2021*66 10. The Global Energy Architecture Performance Index Report (EAPI) 2017 / Rankings / Reports / World Economic Forum 11. Electric power consumption (kWh per capita), 2016 *217 Electricity Consumption - The World Factbook/Library/Central Intelligence Agency; Population - United Nations, Department of Economic and Social Affairs, Population Division (2019). World Population Prospects 2019, custom data acquired via website. Retrieved 15 November 2021 12. Combination of electricity production-consumption (kWh)/The World Factbook/Library/Central Intelligence Agency *216 * Total number of countries participating in ranking | ||
| 图 4. 克罗地亚能源指数 |
图5显示了克罗地亚化石燃料行业最大基础设施项目分布的领土地图。如前所述,石油储量占常规探明储量的30.1%,天然气占69.9%。
图5.克罗地亚化石燃料行业基础设施(点击地图查看PDF版本)
克罗地亚的天然气生产主要在该国西南部的近海地区进行。 该油田天然气储量较小。 例如,Annamaria 气田的储量估计为 100 亿立方米,Izabela 海上气田的储量为 14 亿立方米[12]。 天然气管道网络总长约2500公里,连接该国西部、东部和南部地区。 距离奥米沙利港不远,克尔克岛上有一座容量为 29 亿立方米的浮动液化天然气接收站[13]。
克罗地亚石油工业包括总储量为 7100 万桶的几个小油田、奥米沙利的一个石油码头、一个储油罐网络、两家炼油厂以及一条源自奥米沙利并在锡萨克分支至匈牙利 Szazhalombatta 炼油厂的石油管道 和塞尔维亚的炼油厂。 克罗地亚的 Rijeka 炼油厂和 Sisak 炼油厂的总产能为 90,000 桶/天,由 INA 运营[14]。
2019年,克罗地亚发电装机容量为4.7吉瓦。 克罗地亚 2022 年发电量为 14.19 太瓦时 [图 6]。 水力发电对发电量的贡献最大,接近 40%。 可再生能源的份额略高于25%。
图 6. 克罗地亚的电力生产(点击地图查看 PDF 版本)
克罗地亚最大的水力发电厂是扎库查茨水力发电厂,装机容量约为0.5吉瓦[15]。 国家电网连接该国南部和东部地区,设计电压为400KV。
克罗地亚的可再生能源(不包括水力发电)种类繁多,主要以风电为代表。
图 7. 克罗地亚的可再生能源(点击地图查看 PDF 版本)
2021年,克罗地亚风电场园区大幅增加,三座大型新风电场投入运营。 Senj风电场容量为156,000千瓦,是在中国北方工业公司的帮助下投资建设的[16]。 Padjene 风电场容量为 129,600 kW,拥有 36 台涡轮机,每台功率为 3,600 kW,由德国 Nordex 公司制造[17]。 今年建成的另一座工厂是科拉特风电场,容量为 58 兆瓦[18]。
克罗地亚的太阳能产业要有限得多。 只有少数太阳能发电厂的容量超过1兆瓦。 其中最大的是 Vis 太阳能发电厂,容量为 3.5 MW [19]。 其他几座工厂正在建设中,其中包括容量近 7.5 兆瓦的 Obrovac。
除了风能和太阳能之外,克罗地亚的生物能源各个领域也正在蓬勃发展。 其中包括生物质发电、颗粒和沼气生产、生物质气化。 然而,生物能源对该国整体能源结构的贡献相当有限。
2020年2月,克罗地亚政府通过了到2030年的新能源战略,其中包括到2050年的展望。该战略明确指出,在最乐观的情况下,可再生能源在能源消费总量中的份额到2030年应增至36.7%,并增至65.6% 到 2050 年,电动和混合动力汽车占客运总量的份额将在 2030 年达到 4.5%,到 2050 年将达到 85%。该战略包括一系列提高能源效率、减少对化石能源依赖的措施 燃料,并使电网现代化[20]。 独立专家对 2030 年之前的许多情景看起来更为现实,其中可再生能源(不包括水力发电)占 33-35%。
Sources: 1. The Global Innovation Index 2021, Rankings / Knowledge / World Intellectual Property Organization / Cornell University, INSEAD, and WIPO (2021): Energizing the World with Innovation. Ithaca, Fontainebleau, and Geneva *132 2. Patent Grants 2011-2020, resident & abroad / Statistical country profiles / World Intellectual Property Organization *185 3.Patents in Force 2020 / Statistical country profiles / World Intellectual Property Organization *109 4. QS World University Rankings 2022 *97 5. SCImago Country Rankings (1996-2020) / Country rankings / SCImago, (n.d.). SIR-SCImago Journal & Country Rank [Portal]. Retrieved 17 Nov 2021 *240 6. Internet users in 2018 / The World Factbook / Central Intelligence Agency *229 7. Internet users in 2018 (% Population) / The World Factbook / Central Intelligence Agency *229 8. Government expenditure on education, total (% of GDP), 2019 / United Nations Educational, Scientific, and Cultural Organization (UNESCO) Institute for Statistics. License: CCBY-4.0 / Data as of September 2021*177 9. Research and development expenditure (% of GDP), 2018 / UNESCO Institute for Statistics. License: CCBY-4.0 / Data *119 10. Scientific and technical journal articles, 2018 / National Science Foundation, Science and Engineering Indicators. License: CCBY-4.0 / Data *197 * Total number of countries participating in ranking | ||
图 8. 克罗地亚的教育和创新指数 |
克罗地亚在与教育和创新相关的各种国际排名中的大多数描述该国排名的指数都高于平均水平。 克罗地亚在 SCImago 国家排名、2021 年全球创新指数和科学技术期刊文章中排名最高。 克罗地亚在 2022 年 QS 世界大学排名和政府教育支出占 GDP 总额的百分比方面略低于平均水平。 总的来说,考虑到该国人口相对较少,克罗地亚在这方面的立场看起来更有说服力。
| Sources: 1. CO2 total emission by countries 2020 / European Commission / Joint Research Centre (JRC) / Emission Database for Global Atmospheric Research (EDGAR)*208 2. CO2 per capita emission 2020/European Commission/Joint Research Centre (JRC) / Emission Database for Global Atmospheric Research (EDGAR) *208 3. Forest area 2020 (% of land area) / The Global Forest Resources Assessment 2020 / Food and Agriculture Organization of the United Nations *234 4. Forest area change 2010-2020 (1000 ha/year) / The Global Forest Resources Assessment 2020 / Food and Agriculture Organization of the United Nations *234 5. The Environmental Performance Index (EPI) 2020 / Rankings / Yale Center for Environmental Law & Policy / Yale University *180 6. Annual freshwater withdrawals (m3 per capita), 2017 *179 Annual freshwater withdrawals, total (billion m3), 2017 – Food and Agriculture Organization, AQUASTAT data. /License: CC BY-4.0; Population – United Nations, Department of Economic and Social Affairs, Population Division (2019). World Population Prospects 2019, custom data acquired via website. Retrieved 15 November 2021 7. The National Footprint Accounts 2017 (Biocapacity Credit / Deficit) / Global Footprint Network *188 8. Methane emissions (kt of CO2 equivalent), 2018 / Data for up to 1990 are sourced from Carbon Dioxide Information Analysis Center, Environmental Sciences Division, Oak Ridge National Laboratory, Tennessee, United States. Data from 1990 are CAIT data: Climate Watch. 2020. GHG Emissions. Washington, DC: World Resources Institute. Available at: License : Attribution-NonCommercial 4.0 International (CC BY-NC 4.0) *191 9. The Climate Change Performance Index (CCPI) 2022 / Overall Results / Jan Burck, Thea Uhlich, Christoph Bals, Niklas Höhne, Leonardo Nascimento / Germanwatch, NewClimate Institute & Climate Action Network *60 * Total number of countries participating in ranking | ||
图 9. 克罗地亚环境指数 |
[1] List of sovereign states and dependencies by area / Wikipedia / en.wikipedia.org/wiki/List_of_sovereign_states_and_dependencies_by_area
[2] List of countries and dependencies by population density / Wikipedia / en.wikipedia.org/wiki/List_of_countries_and_dependencies_by_population_density
[3] Croatia / The world factbook / Library / Central Intelligence Agency / www.cia.gov
[4] GDP, PPP (constant 2011 international $) / World Bank, International Comparison Program database. License: CC BY-4.0 / Data / The World Bank / www.worldbank.org
[5] GDP per capita, PPP (current international $) / World Bank, International Comparison Program database. License: CC BY-4.0 / Data / The World Bank / www.worldbank.org
[6] International Energy Statistic / Geography / Croatia /U.S. Energy Information Administration, 2021 / www.eia.gov/beta/international/
[7] Solar resource data obtained from the Global Solar Atlas, owned by the World Bank Group and provided by Solargis / Global Solar Atlas / globalsolaratlas.info
[8] Wind Map / Global Wind Atlas 2.0, a free, web-based application developed, owned and operated by the Technical University of Denmark (DTU) in partnership with the World Bank Group, utilizing data provided by Vortex, with funding provided by the Energy Sector Management Assistance Program (ESMAP). For additional information: globalwindatlas.info
[9] Agricultural land (% of land area) /Food and Agriculture Organization, electronic files and web site. License: CC BY-4.0 / Data / The World Bank / www.worldbank.org
[10] Forest area (% of land area) /Food and Agriculture Organization, electronic files and web site. License: CC BY-4.0 / Data / The World Bank / www.worldbank.org
[11] World Bank What a Waste / Data / The World Bank / www.worldbank.org
[12] abarrelfull.wikidot.com
[13] theodora.com/pipelines/index.html
[14] en.wikipedia.org/wiki/List_of_oil_refineries
[15] en.wikipedia.org/wiki/Energy_in_Croatia
[16] balkangreenenergynews.com/norinco-completes-senj-wind-farm-croatia-biggest-so-far/
vlada.gov.hr/news/senj-wind-farm-opened-for-trial-run-the-project-will-contribute-to-croatia-s-green-transition/33504
[17] www.thewindpower.net/windfarm_en_30509_padjene.php
[18] balkangreenenergynews.com/58-mw-korlat-heps-first-wind-farm-officially-starts-operation/
[19] The Solar Power Plant Vis, the largest solar plant in Croatia, put into Service - OIE
[20] Strategija energetskog razvitka Republike Hrvatske/ narodne-novine.nn.hr/clanci/sluzbeni/2020_03_25_602.html
图表和曲线的来源在图像下方指定。
有关克罗地亚能源行业的更多信息,请参见此处