

塞尔维亚,正式名称塞尔维亚共和国,是巴尔干半岛中西部和潘诺尼亚平原的内陆国家。在20世纪的大部分时间里,塞尔维亚都是南斯拉夫的一部分。北与匈牙利接壤,东北与罗马尼亚接壤,东南与保加利亚接壤,南与北马其顿接壤,西与克罗地亚和波斯尼亚和黑塞哥维那接壤,西南与黑山接壤。此外,该国西南部还与科索沃接壤,科索沃于2008年2月宣布从塞尔维亚独立,但后者尚未承认,该共和国的地位仍存在争议。
据2023年统计,塞尔维亚领土面积居世界第117位,人口约650万。按人口密度计算,该国居世界第94位。塞尔维亚是议会制共和国,自2012年起成为欧盟候选国。该国分为117个直辖市和28个城市。首都和最大城市是贝尔格莱德,官方语言是塞尔维亚语[1,2,3]。
| Serbia / the Republic of Serbia | ||
|---|---|---|
| Capital: Belgrade | Density: 85.8/km2 | Currency: Serbian dinar (RSD) |
| Official languages: Serbian | Life expectancy at birth: 74.23 years | GDP (PPP): $164.8 billion (2023 est.) |
| National Day: 15 February | Area (land): 77,474 km2 (excl. Kosovo) | GDP - per capita (PPP): $23,534 (2023 est.) |
| Population: 6,693,375 (2023 est.) | Coastline: 0 km | Internet country code: .rs |
Source: [1,2,3,4,5]

Beograd - Hram Svetog Save, Envato Elements, 473PTB5GHN
塞尔维亚相对于其他国家的排名是根据一系列经济、能源、创新和教育指数以及反映环境状况的指标确定的。经济指标包括人均GDP、年均GDP增长率、高新技术出口等。能源指数列表包括石油、天然气和煤炭的探明储量、产耗比以及能源使用情况等。每个指数都有一个包含的成员国排名列表。由于每个指数的每个评级的国家数量不同,因此将感兴趣的国家的定位显示在一个特殊的图表上,其中纵轴是从0到1的统一相对刻度,而横轴表示各个指数以及与下面给出的描述相关的相应编号。
因此,在这样一个相对的“0-1”图中,该国家的位置按照其在原始评级列表中的位置成比例地用点来标记。如果该国在所选指标方面处于领先地位,则将在相关图表“0-1”的上部绿色区域中标记为接近 1,如果该国在评级列表中属于局外人,则将标记为接近 1图表下方红色区域“0-1”等。
塞尔维亚经济指数列表排名:
| Sources: 1. GDP (purchasing power parity), 2020 est. / The World Factbook/Library/Central Intelligence Agency *228 2. GDP - per capita (PPP), 2020 / The World Factbook/Library/Central Intelligence Agency *229 3. Inflation rate (consumer prices), 2019 est. / The World Factbook/Library/Central Intelligence Agency *228 4. Charges for the use of intellectual property, receipts (BoP, current US$), 2020 / International Monetary Fund, Balance of Payments Statistics Yearbook, and data files. / License: CC BY-4.0 *88 5. The Global Competitiveness Index 2019 / Rankings / Reports / World Economic Forum *141 6. High-technology exports (current US$) 2019-2020 / United Nations, Comtrade database through the WITS platform / License: CCBY-4.0 / Data *134 7. 2021 Index of Economic Freedom / International Economies / The Heritage Foundation *178 8. Reserves of foreign exchange and gold, 2017 est. / The World Factbook / Library / Central Intelligence Agency *195 9. Annual average GDP growth in %, for the last 10 years (2011-2020) / World Bank national accounts data, and OECD National Accounts data files / License: CC BY-4.0 *206 10. Public debt (% of GDP), 2017 est. / The World Factbook / Library / Central Intelligence Agency (from smallest to largest) *210 * Total number of countries participating in ranking 图 1. 塞尔维亚经济指数 |
在所提供的指数中,塞尔维亚的通货膨胀率(0.92)和经济自由指数(0.70)最高。塞尔维亚经济指标中最薄弱的部分是GDP年均增长率(0.39)和公共债务(0.33),均低于世界平均水平。由于无法获得有关高科技出口的数据,因此该图表指标为空。
塞尔维亚的原油和天然气储量较少,分别占世界总储量的0.005%和0.023%。煤炭储量更为重要,占世界储量的0.71%。据估计,塞尔维亚油页岩储量较大,但这种能源资源开发不足。
以吨油当量计算,根据2024年数据,按燃料类型划分的常规探明储量以煤炭为主,占99%,天然气占0.8%,石油占0.2%(图5)。
表1. 塞尔维亚化石能源资源
| Resource /Explanations | Crude oil* | Natural gas* | Coal* | Shale Gas | Tight Oil | Coalmine methane |
|---|---|---|---|---|---|---|
| Value | 0.08 (0.005%) | 1.7 (0.023%) | 8 282 (0.71%) | no date | no date | no date |
| Unit | million barrels | Tcf | million short tons | - | - | - |
| Year | 2021 | 2020 | 2021 | - | - | - |
| Source | [6] | [6] | [6] | [-] | [-] | [-] |
* 括号内提供了该国储量占世界总储量的比例
塞尔维亚的可再生资源矩阵没有显示出异常或极端值。该国拥有多瑙河、萨瓦河、蒂萨河等多条大河以及丰富的山区河流,为水电开发提供了理想的环境。尽管塞尔维亚仍有大量未利用的水电潜力,但水电已满足该国约30%的电力需求。
表2.塞尔维亚可再生能源资源
| Resource/ explanations | Solar Potential (GHI)* | Wind Potential (50 м)* | Hydro energy Potential** | Bio Potential (agricultural area) | Bio Potential (forest area) | Municipal Solid Waste |
|---|---|---|---|---|---|---|
| Value | 3.5-4.1 | 5.0-6.0 | 19 447 | 40.1 | 31.1 | 472 |
| Unit | kWh/m2/day | m/s | GWh/year | % of land area | % of land area | kg per capita |
| Year | 2020 | 2020 | 2013 | 2020 | 2020 | 2022 |
| Source | [7] | [8] | [9] | [10] | [11] | [12] |
*适用于该国大部分领土
**技术上可利用的能力
塞尔维亚在太阳能光伏和风能等可再生能源生产方面具有巨大潜力。太阳能GHI强度最高达到每天4.1kWh/m 2,分布在该国南部地区。东部地区,主要山区,50m处风速超过6.0m/s。
NOVI SAD RIMSKI SANCEVI, SERBIA
Latitiude: 45.33, Longitude: 19.85
Average speed: 2.33 m/s, Operational share: 35%
Average daily wind speed for 10 years of observations, m/s, 10 m above the ground
Source: based on NOAA U.S. Department of Commerce
Detailed information: Interactive map of wind resources
NOVI SAD RIMSKI SANCEVI, SERBIA
Latitiude: 45.33, Longitude: 19.85
Average daily sky coverage over 10 years of observations, %
CLR - clear, SCT - scattered from 1/8 TO 4/8, BKN - broken from 5/8 TO 7/8, OVC - overcast, OBS - obscured, POB - partial obscuration
Source: based on NOAA U.S. Department of Commerce
Detailed information: Interactive map of solar resources
农业用地和总面积森林面积较大,这意味着有足够的原料发展生物能源。
根据[6],2022年塞尔维亚一次能源总产量为0.32万亿英热单位,而消费量为0.593万亿英热单位。 因此,国内生产占一次能源消费的比重约为54%。 这使得塞尔维亚成为一个依赖能源进口的国家。
根据国家能源统计数据[13],2020年可供最终消费的能源以石油衍生品为主(32.8%),其次是电力(25.2%)、木材燃料(16.4%)、天然气(11.6%)、热力。 (7.88%)、煤炭及煤制品(5.85%)、沼气(0.18%)和地热能(0.05%)。
Source: U.S. Energy Information Administration (Mar 2024) / https://www.eia.gov
图 2. 塞尔维亚化石燃料的生产和消费(煤炭 - 左,天然气 - 中间,石油 - 右)
从上图可以看出,塞尔维亚对天然气和原油的消耗量远远超过了其低产量。因此,到2022年,石油消耗量将是国内产量的4.5倍,天然气需求量将是国内产能的7倍左右。如果我们看煤炭数据,煤炭消费略高于产量。
| Sources: U.S. Energy Information Administration (Mar 2024) / www.eia.gov | ||
图 3. 塞尔维亚的发电量 |
2022年,塞尔维亚全国发电量近68%来自化石燃料,主要是煤炭,约28%来自水力发电,还有一小部分来自风能和太阳能。塞尔维亚电力完全自给自足,并出口部分国内生产的电力。上图所示的 10 年来,该国的发电量和消耗电量大致保持在同一水平。
| Sources: 1. Crude oil proved reserves, 2021 / International Energy Statistic/Geography / U.S. Energy Information Administration (Nov 2021)*98 2. Natural gas proved reserves 2021 / International Energy Statistic / Geography / U.S. Energy Information Administration (Nov 2021) *99 3. Total recoverable coal reserves 2019 / International Energy Statistic / Geography / U.S. Energy Information Administration (Nov 2021) *81 4. Combination production-consumption for Crude oil 2018 / International Energy Statistic / Geography / U.S. Energy Information Administration (Nov 2021) *219 5. Combination production-consumption for Natural gas 2019 / International Energy Statistic / Geography / U.S. Energy Information Administration (Nov 2021) *123 6. Combination production-consumption for Coal 2019 / International Energy Statistic / Geography / U.S. Energy Information Administration (Nov 2021) *128 7. Electricity – from other renewable sources (% of total installed capacity), 2017 est. / The World Factbook / Library / Central Intelligence Agency *170 8. GDP per unit of energy use (PPP per unit of oil equivalent), 2020 *66 Primary energy consumption - BP Statistical Review of World Energy 2021/BP;GDP (purchasing power parity) - The World Factbook/Library/Central Intelligence Agency 9. Energy use (primary energy use of oil equivalent per capita) 2020 *127 Primary energy consumption – BP Statistical Review of World Energy 2021; Population - United Nations, Department of Economic and Social Affairs, Population Division (2019). World Population Prospects 2019, custom data acquired via website. Retrieved 15 November 2021*66 10. The Global Energy Architecture Performance Index Report (EAPI) 2017 / Rankings / Reports / World Economic Forum 11. Electric power consumption (kWh per capita), 2016 *217 Electricity Consumption - The World Factbook / Library / Central Intelligence Agency; Population - United Nations, Department of Economic and Social Affairs, Population Division (2019). World Population Prospects 2019, custom data acquired via website. Retrieved 15 November 2021 12. Combination of electricity production-consumption (kWh)/The World Factbook/Library/Central Intelligence Agency *216 * Total number of countries participating in ranking 图 4. 塞尔维亚能源指数 |
上图所示的能源指数表明,塞尔维亚是一个在能源领域面临某些挑战的国家。由于该国仅通过风能和太阳能生产少量电力,因此塞尔维亚的其他可再生能源电力指标(0.02)是所有指标中最差的。此外,由于塞尔维亚没有大量的化石燃料储量,其天然气和石油储量以及生产消费比均处于最低水平。这不适用于煤炭,其储量指标(0.83)是所提出的指标中最好的。
塞尔维亚化石燃料行业的主要基础设施目标如下图所示。原油和油气开采集中在该国的东南部。位于该国南部的韦莱比特油田是塞尔维亚最重要的油田。
塞尔维亚的煤炭开采主要在该国中部地区,科卢巴拉和科斯托拉茨是两个主要的褐煤矿床。科卢巴拉矿生产塞尔维亚约75%的褐煤,另外25%由科斯托拉茨煤盆地供应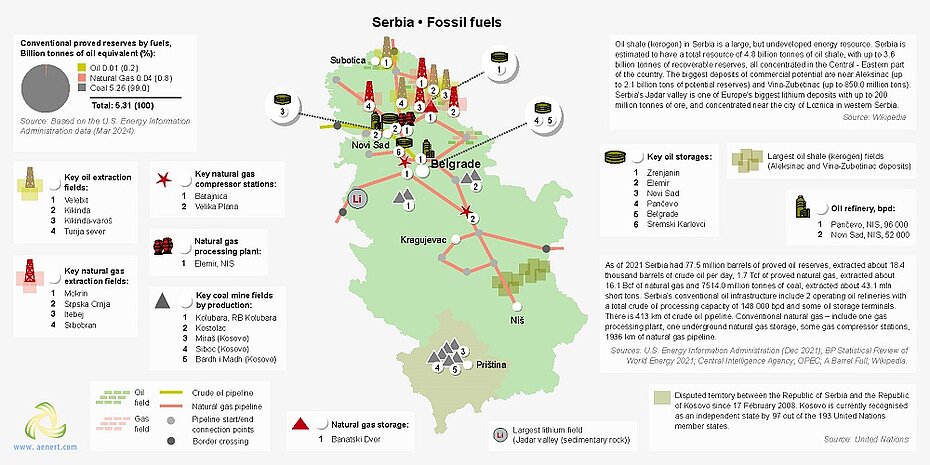
图5 塞尔维亚化石燃料行业基础设施
化石燃料工业不仅包括煤炭、石油和天然气的勘探和生产,还包括其成品加工。基础设施包括位于潘切沃和诺维萨德的两家炼油厂,以及位于埃勒米尔的天然气加工厂。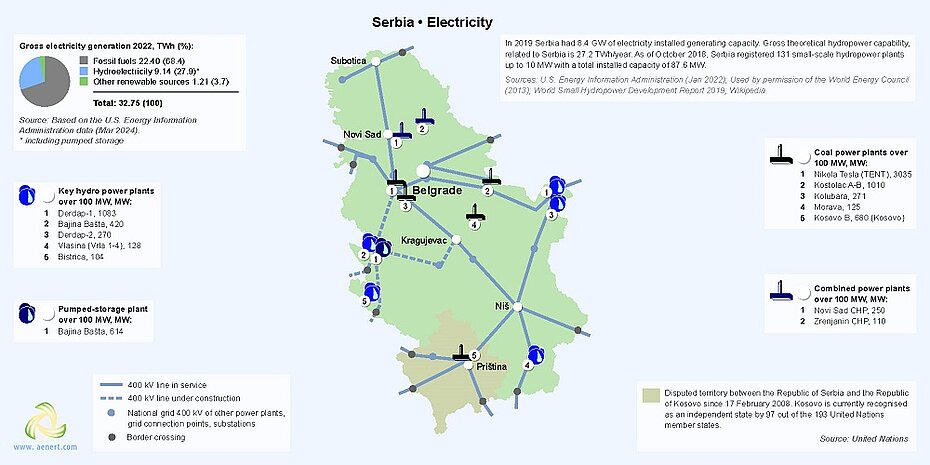
图 6. 塞尔维亚的发电量
煤炭是该国最大的电力来源。超过68%的电力来自火力发电厂使用的煤炭,其中主要有Kolubara、TPP Nikola Tesla和TPP Morava,这些火力发电厂均由Kolubara煤矿供应。该国另一个重要的TPP是科斯托拉茨,其供应的煤炭是在科斯托拉茨盆地开采的。
据Elektroprivreda Srbije统计[14],塞尔维亚拥有16座水电站,总装机容量为3,015兆瓦。电力由 Djerdap HPP 分支、Kladovska 和 Drinsko-Limsko HPP 分支以及 Baina Bašta 发电。Jerdap HPPs 分支的 28 台机组的总容量为 1,605 MW。德里纳河和林河上的 Drinsko-Lim 水电站支线内有 9 座水电站,总装机容量为 1,390 兆瓦
图 7. 塞尔维亚可再生能源
根据塞尔维亚能源局 2022 年年度报告,连接到输电系统的风力发电厂占比为 4.4%,装机容量为 373 MW。主要风电场位于塞尔维亚东北部。塞尔维亚太阳能行业仍处于相对早期阶段,2022年太阳能电站总装机容量为13兆瓦。该国还运营着许多生物质和沼气发电厂[15]。塞尔维亚计划大幅减少化石燃料(主要是煤炭)的使用,并转向高效和可再生能源。塞尔维亚共和国的综合国家能源和气候计划[16]设想,到2030年,可再生能源在最终能源消费总量中的份额应至少达到33%。此外,可再生能源在最终电力消耗总量中的份额应至少为 45.2%,在交通运输领域则应为 7%。
Sources: 1. The Global Innovation Index 2021, Rankings / Knowledge / World Intellectual Property Organization / Cornell University, INSEAD, and WIPO (2021): Energizing the World with Innovation. Ithaca, Fontainebleau, and Geneva *132 2. Patent Grants 2011-2020, resident & abroad / Statistical country profiles / World Intellectual Property Organization *185 3.Patents in Force 2020 / Statistical country profiles / World Intellectual Property Organization *109 4. QS World University Rankings 2022 *97 5. SCImago Country Rankings (1996-2020) / Country rankings / SCImago, (n.d.). SIR-SCImago Journal & Country Rank [Portal]. Retrieved 17 Nov 2021 *240 6. Internet users in 2018 / The World Factbook / Central Intelligence Agency *229 7. Internet users in 2018 (% Population) / The World Factbook / Central Intelligence Agency *229 8. Government expenditure on education, total (% of GDP), 2019 / United Nations Educational, Scientific, and Cultural Organization (UNESCO) Institute for Statistics. License: CCBY-4.0 / Data as of September 2021*177 9. Research and development expenditure (% of GDP), 2018 / UNESCO Institute for Statistics. License: CCBY-4.0 / Data *119 10. Scientific and technical journal articles, 2018 / National Science Foundation, Science and Engineering Indicators. License: CCBY-4.0 / Data *197 * Total number of countries participating in ranking | ||
图8. 塞尔维亚的教育和创新指数 |
描述塞尔维亚在与教育和创新相关的各种国际排名中的排名的十个指数中有七个高于世界平均水平。塞尔维亚的有效专利排名(0.48)和 QS 世界大学排名(0.37)均低于全球平均水平。
Belgrade. Tesla Museum
这些位置的部分原因是政府教育支出不足(0.44)。塞尔维亚在教育和创新方面的最强位置是 SCimago 国家排名 (0.78) 和科学技术期刊文章 (0.73)。
| Sources: 1. CO2 total emission by countries 2020 / European Commission / Joint Research Centre (JRC) / Emission Database for Global Atmospheric Research (EDGAR)*208 2. CO2 per capita emission 2020/European Commission/Joint Research Centre (JRC) / Emission Database for Global Atmospheric Research (EDGAR) *208 3. Forest area 2020 (% of land area) / The Global Forest Resources Assessment 2020 / Food and Agriculture Organization of the United Nations *234 4. Forest area change 2010-2020 (1000 ha/year) / The Global Forest Resources Assessment 2020 / Food and Agriculture Organization of the United Nations *234 5. The Environmental Performance Index (EPI) 2020 / Rankings / Yale Center for Environmental Law & Policy / Yale University *180 6. Annual freshwater withdrawals (m3 per capita), 2017 *179 Annual freshwater withdrawals, total (billion m3), 2017 – Food and Agriculture Organization, AQUASTAT data. /License: CC BY-4.0; Population – United Nations, Department of Economic and Social Affairs, Population Division (2019). World Population Prospects 2019, custom data acquired via website. Retrieved 15 November 2021 7. The National Footprint Accounts 2017 (Biocapacity Credit / Deficit) / Global Footprint Network *188 8. Methane emissions (kt of CO2 equivalent), 2018 / Data for up to 1990 are sourced from Carbon Dioxide Information Analysis Center, Environmental Sciences Division, Oak Ridge National Laboratory, Tennessee, United States. Data from 1990 are CAIT data: Climate Watch. 2020. GHG Emissions. Washington, DC: World Resources Institute. Available at: License : Attribution-NonCommercial 4.0 International (CC BY-NC 4.0) *191 9. The Climate Change Performance Index (CCPI) 2022 / Overall Results / Jan Burck, Thea Uhlich, Christoph Bals, Niklas Höhne, Leonardo Nascimento / Germanwatch, NewClimate Institute & Climate Action Network *60 * Total number of countries participating in ranking | ||
图 8. 塞尔维亚环境指数 |
由于塞尔维亚生产化石燃料,排放指标较高——二氧化碳排放总量(0.23)和人均排放量(0.15),以及甲烷排放量(0.43)。从图中可以看出,塞尔维亚的森林面积处于世界平均水平(0.50),且近年来森林数量呈稳步上升趋势(0.75)。该国的年度淡水消耗量(0.73)和环境绩效指数(EPI)(0.75)也是积极的环境特征。总体来看,我国环境状况亟待改善。
[1] List of sovereign states and dependencies by area / Wikipedia / en.wikipedia.org/wiki/List_of_sovereign_states_and_dependencies_by_area
[2] List of countries and dependencies by population density / Wikipedia / en.wikipedia.org/wiki/List_of_countries_and_dependencies_by_population_density
[3] Serbia / The world factbook / Library / Central Intelligence Agency / www.cia.gov
[4] GDP, PPP (constant 2011 international $) / World Bank, International Comparison Program database. License: CC BY-4.0 / Data / The World Bank / www.worldbank.org
[5] GDP per capita, PPP (current international $) / World Bank, International Comparison Program database. License: CC BY-4.0 / Data / The World Bank / www.worldbank.org
[6] International Energy Statistic / Geography / U.S. Energy Information Administration / www.eia.gov/beta/international/
[7] Solar resource data obtained from the Global Solar Atlas, owned by the World Bank Group and provided by Solargis / Global Solar Atlas / globalsolaratlas.info
[8] Wind Map / Global Wind Atlas 2.0, a free, web-based application developed, owned and operated by the Technical University of Denmark (DTU) in partnership with the World Bank Group, utilizing data provided by Vortex, with funding provided by the Energy Sector Management Assistance Program (ESMAP). For additional information: globalwindatlas.info
[9] World Energy Resources: Hydro World Energy Council / 2013 / Publications / World Energy Council / https://www.worldenergy.org/
[10] Agricultural land (% of land area) /Food and Agriculture Organization, electronic files and web site. License: CC BY-4.0 / Data / The World Bank / www.worldbank.org
[11] Forest area (% of land area) /Food and Agriculture Organization, electronic files and web site. License: CC BY-4.0 / Data / The World Bank / www.worldbank.org
[12] Municipal waste statistics Updated / Statistics Explained / Eurostat / https://ec.europa.eu
[13] Statistical Pocketbook of the Republic of Serbia (PDF) / Statistical Office of the Republic of Serbia / https://publikacije.stat.gov.rs/G2023/PdfE/G202317016.pdf
[14] Hydro power plants / Elektroprivreda Srbije / https://www.eps.rs/eng/Poslovanje-EE/Pages/Hidroelektrane.aspx
[15] 2022 Energy Agency Annual Report (PDF) / www.aers.rs/Files/Izvestaji/Godisnji/Eng/AERS%20Annual%20Report%202022.pdf
[16] Integrated National Energy and Climate Plan of the Republic of Serbia for the period 2030 with the projections up to 2050 (PDF)
图表和曲线的来源在图像下方指定。
有关塞尔维亚能源行业的更多信息,请参见此处