

伊拉克,伊拉克共和国官方,是亚洲地区对北图尔基亚、西里亚诺罗斯特、约旦、伊朗、阿拉伯沙特阿拉伯和科威特的限制。南伊拉克阿德马斯,我们将在佩尔西科湾地区完成 58 公里的海岸线,这是佩尔西科湾地区所有国家的任务。
2024 年伊拉克,这是 60 世纪的世界和 47 百万个人的故事。在人口稠密的终点站,国家占据 93 个国家和 201 个国家。伊拉克共和国联邦议会分为 18 个政府和首都巴格达。 官方语言为阿拉伯语和库尔德语[1,2,3]。
| 伊拉克共和国 / جمهورية العراق | ||
|---|---|---|
| Capital: Baghdad | Density: 82.7/km2 | Currency: Iraqi dinar (IQD) |
| Official languages: Arabic, Kurdish | Life expectancy at birth: 69.12 years | GDP (PPP): $508.973 billion (2023 est.) |
| National Day: 3 October | Area (land): 438,317 km2 | GDP - per capita (PPP): $11,742 (2023 est.) |
| Population: 46,729,000 (2024 est.) | Coastline: 58 km | Internet country code: .iq |
Source: [1,2,3,4,5]
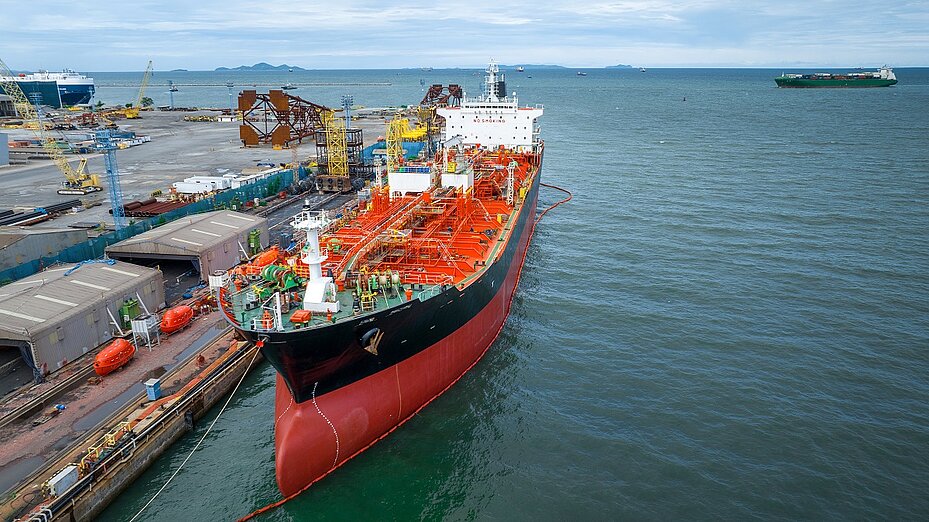
Oil Crude Tanker Ship. Envato. MP35VK9U6X
伊拉克相对于其他国家的排名是根据一系列广泛的经济、能源、创新和教育指数以及反映环境状况的指标来确定的。 经济指标包括人均GDP、年均GDP增长率、高科技出口等。 能源指标清单包括石油、天然气、煤炭探明储量、产耗比、能源利用等。 每个指数都有一份包含的成员国的排名列表。 由于每个指数的每个评级的国家数量不同,因此将感兴趣的国家的位置显示在一个特殊的图表上,其中纵轴是从0到1的统一相对刻度,而横轴表示不同的指数。 以及与下面给出的描述相关的相应编号。
因此,在这样一个相对的“0-1”图中,按照该国家在原始排名列表中的位置比例用点来标记该国家的位置。 。 如果该国家在所选指标方面处于领先地位,则将在相应图表“0-1”上绿色区域的上方标记为 1 附近,如果该国家在排名列表之外,则将标记为“0-1”图的红色下部区域等。 所有国家都使用单一的指数列表。 如果某个国家/地区不在任何指数的排名列表中,则相应的位置不会显示在图表中。
伊拉克经济指数排名:
| Sources: 1. GDP (purchasing power parity), 2020 est. / The World Factbook/Library/Central Intelligence Agency *228 2. GDP - per capita (PPP), 2020 / The World Factbook/Library/Central Intelligence Agency *229 3. Inflation rate (consumer prices), 2019 est. / The World Factbook/Library/Central Intelligence Agency *228 4. Charges for the use of intellectual property, receipts (BoP, current US$), 2020 / International Monetary Fund, Balance of Payments Statistics Yearbook, and data files. / License: CC BY-4.0 *88 5. The Global Competitiveness Index 2019 / Rankings / Reports / World Economic Forum *141 6. High-technology exports (current US$) 2019-2020 / United Nations, Comtrade database through the WITS platform / License: CCBY-4.0 / Data *134 7. 2021 Index of Economic Freedom / International Economies / The Heritage Foundation *178 8. Reserves of foreign exchange and gold, 2017 est. / The World Factbook / Library / Central Intelligence Agency *195 9. Annual average GDP growth in %, for the last 10 years (2011-2020) / World Bank national accounts data, and OECD National Accounts data files / License: CC BY-4.0 *206 10. Public debt (% of GDP), 2017 est. / The World Factbook / Library / Central Intelligence Agency (from smallest to largest) *210 * Total number of countries participating in ranking 图1. 伊拉克经济指数 |
伊拉克作为一个石油资源丰富的国家,拥有巨大的经济潜力,但其发展受到腐败、政治不稳定、私营部门不发达以及国内社会紧张和冲突等因素的阻碍。 在上图中的指数中,伊拉克的通货膨胀率(0.93)、GDP(0.79)以及外汇和黄金储备(0.70)的值最高。 伊拉克经济指标中最弱的部分是知识产权使用费(0.07)。 由于没有高科技出口数据,且该国未纳入全球竞争力指数和经济自由度指数,因此上图相应位置为空白。
伊拉克是已探明化石燃料储量的全球领先者之一。 该国拥有世界第五大原油探明储量,占世界总量的8.52%。 天然气储量位居世界第12位,占全球份额1.82%。 例如,将伊拉克的化石燃料资源与其他世界领先国家进行比较,其石油储量大约比委内瑞拉和沙特阿拉伯少2倍,而天然气储量则比俄罗斯少12倍多。 伊拉克人口约占世界人口的0.55%[6]。
以吨油当量计算,根据2024年数据,按燃料类型划分的常规探明储量为:原油85.5%,天然气14.5%(图5)。
表1 伊拉克化石能源资源
| Resource /Explanations | Crude oil* | Natural gas* | Coal | Tight Oil | Shale Gas |
|---|---|---|---|---|---|
| Value | 145.02 (8.52%) | 131.69 (1.82%) | - | - | - |
| Unit | billion barrels | Tcf | - | - | - |
| Year | 2021 | 2020 | - | - | - |
| Source | [6] | [6] | [-] | [-] | [-] |
* 括号内提供该国储量占世界总储量的比例
与大多数南方国家一样,伊拉克具有发展可再生能源特别是太阳能的有利条件。 在该国的许多地区,特别是在其西南部地区,太阳能GHI达到每天5.8-5.9千瓦时/平方米。
IRAQ, NAJAF
Latitude: 31.95, Longitude: 44.32
10 年观测期间的平均每日天空覆盖率,%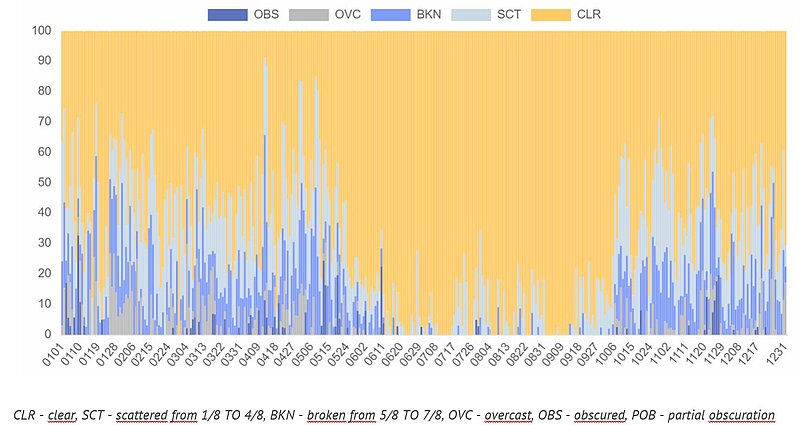
Source: based on NOAA U.S. Department of Commerce
Detailed information: Interactive map of solar resources
最有利于风能开发的气候条件是伊拉克南部地区以及迪亚拉省和瓦西特省之间的东部地区,这些地区在50米高度处风速可达6.5-7.0 m/s。
IRAQ. SAMAWA
Latitude: 31.27, Longitude: 45.27
Average speed: 3.68 m/s, Operational share: 65%
10年观测的平均日风速,m/s,距地面10 m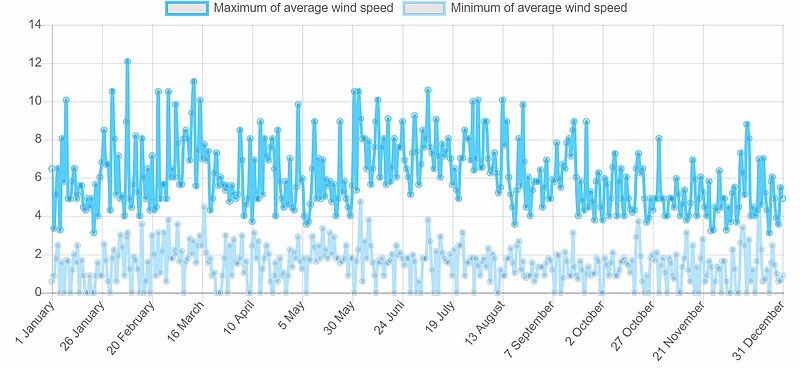
Source: based on NOAA U.S. Department of Commerce
Detailed information:Interactive map of wind resources
水电目前是伊拉克可再生能源发电中占比最大的能源,约占可再生电力的92%。 伊拉克有两条主要河流:幼发拉底河和底格里斯河,满足了该国大部分的用水需求。
表2 伊拉克可再生能源资源
| Resource/ explanations | Solar Potential (DNI)* | Wind Potential (50 м)* | Bio Potential (agricultural area) | Bio Potential (forest area) | Municipal Solid Waste |
|---|---|---|---|---|---|
| Value | 5.2 -5.8 | 5.0-6.5 | 21.3 | 1.9 | 1.03 |
| Unit | kWh/m2/day | m/s | % of land area | % of land area | kg/per capita/day |
| Year | 2020 | 2020 | 2020 | 2020 | 2020 |
| Source | [7] | [8] | [9] | [10] | [11] |
*适用于该国大部分领土
然而,水电行业面临着许多与基础设施破坏以及气候变化相关问题相关的挑战,水电非常容易受到这些挑战的影响。 由于资源不足和缺乏政府支持,该国生物能源的潜力有限。
总体而言,伊拉克的可再生能源份额与其巨大潜力相比微不足道,目前在绿色能源发展领域落后于该地区其他国家,且没有明确的可再生能源推广战略。
尽管伊拉克是主要原油生产国之一,但它正在努力满足国内能源需求。 根据[6],2022年伊拉克一次能源总产量为10.022万亿英热单位,而消费量为2.567万亿英热单位。 因此,伊拉克是一个能源生产过剩相对于国内消费所占比例非常高的国家。
根据《2022年世界能源统计回顾》[12],2021年伊拉克一次能源消耗量为2.12艾焦耳,其中石油占主导地位——69.8%,其次是天然气——29.2%和水力——1.5%[12]。
Source: U.S. Energy Information Administration (Mar 2024) / www.eia.gov
图 2. 伊拉格化石燃料的生产和消费(左 - 煤炭,中 - 天然气,右 - 石油)
如上图所示,过去十年来伊拉克的天然气和原油产量逐渐增加,原油产量几乎是国内消费量的5倍。 相比之下,天然气消耗量几乎是国内产量的两倍,迫使伊拉克从邻国(主要是伊朗)进口天然气。
Sources: U.S. Energy Information Administration (Mar 2024) / www.eia.gov | ||
| 图 3. 伊拉克的发电量 |
伊拉克的电力部门几乎完全依赖化石燃料,2022年化石燃料约占发电量的98%。从上图可以看出,过去10年能源产量增加了一倍多。 据[6]报道,伊拉克电力系统依赖进口,2022年约35%的电力是由伊朗生产的天然气和从伊朗进口的电力相结合产生的。 总体而言,该国经常出现电力短缺和无法满足需求的情况,特别是在夏季用电高峰期间。 这主要是由于输电基础设施不发达,导致配电损耗较高,平均占总供电量的50%以上。 此外,电力系统性能不佳与发电厂效率低下或损坏以及利用率低有关。
| Sources: 1. Crude oil proved reserves, 2021 / International Energy Statistic/Geography / U.S. Energy Information Administration (Nov 2021)*98 2. Natural gas proved reserves 2021 / International Energy Statistic / Geography / U.S. Energy Information Administration (Nov 2021) *99 3. Total recoverable coal reserves 2019 / International Energy Statistic / Geography / U.S. Energy Information Administration (Nov 2021) *81 4. Combination production-consumption for Crude oil 2018 / International Energy Statistic / Geography / U.S. Energy Information Administration (Nov 2021) *219 5. Combination production-consumption for Natural gas 2019 / International Energy Statistic / Geography / U.S. Energy Information Administration (Nov 2021) *123 6. Combination production-consumption for Coal 2019 / International Energy Statistic / Geography / U.S. Energy Information Administration (Nov 2021) *128 7. Electricity – from other renewable sources (% of total installed capacity), 2017 est. / The World Factbook / Library / Central Intelligence Agency *170 8. GDP per unit of energy use (PPP per unit of oil equivalent), 2020 *66 Primary energy consumption - BP Statistical Review of World Energy 2021/BP;GDP (purchasing power parity) - The World Factbook/Library/Central Intelligence Agency 9. Energy use (primary energy use of oil equivalent per capita) 2020 *127 Primary energy consumption – BP Statistical Review of World Energy 2021; Population - United Nations, Department of Economic and Social Affairs, Population Division (2019). World Population Prospects 2019, custom data acquired via website. Retrieved 15 November 2021*66 10. The Global Energy Architecture Performance Index Report (EAPI) 2017 / Rankings / Reports / World Economic Forum 11. Electric power consumption (kWh per capita), 2016 *217 Electricity Consumption - The World Factbook / Library / Central Intelligence Agency; Population - United Nations, Department of Economic and Social Affairs, Population Division (2019). World Population Prospects 2019, custom data acquired via website. Retrieved 15 November 2021 12. Combination of electricity production-consumption (kWh)/The World Factbook/Library/Central Intelligence Agency *216 * Total number of countries participating in ranking 图4 伊拉克能源指数 |
伊拉克是世界上化石燃料储量领先者之一的事实无疑反映在能源指数图表中,该国的原油(0.95)和天然气(0.88)储量表现强劲。 伊拉克的原油产量与消费比得分最高(0.99)。 由于该国几乎没有煤炭储备,除水力发电外,只有极少量的可再生能源发电,因此上图中这些位置仍然空白。
图5显示了伊拉克化石燃料行业最大基础设施项目分布的领土地图。如前所述,原油储量占所有已探明化石燃料储量的85.5%,天然气占14.5%。
据[6],伊拉克探明原油储量为1450亿桶,居世界第五位,占全球储量的8%。 伊拉克的主要油田都位于陆上,伊拉克的大部分石油产量来自伊拉克南部的超大型鲁迈拉油田。 这里开采的原油通过管道输送到当地炼油厂或出口设施,包括中东海湾的近海巴士拉石油码头。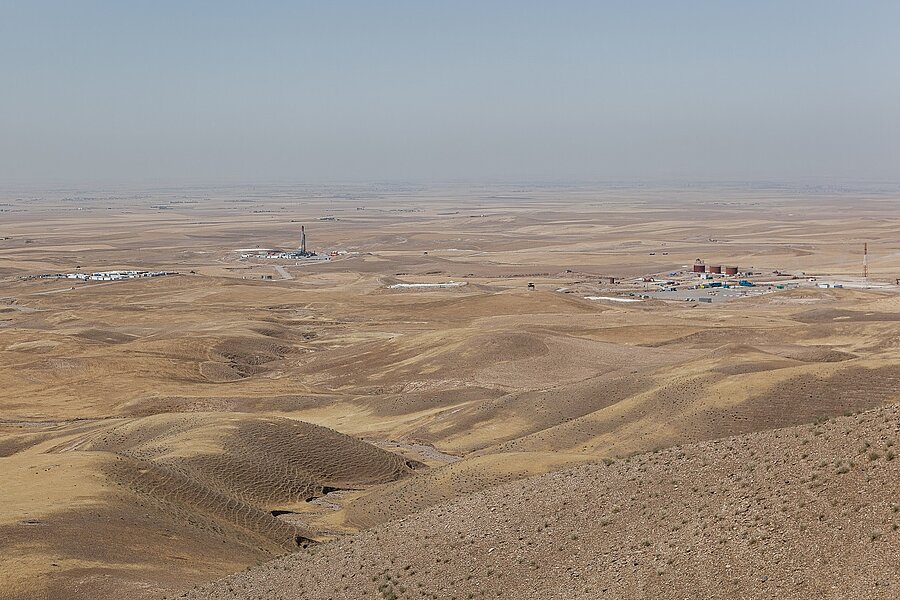
Oil & gas operations, Iraq. Envato. 2AZVMCEY65
该国的油田基础设施包括位于石油管道沿线的许多炼油厂和储存设施。 萨拉丁省的拜吉炼油厂是伊拉克最大的炼油厂,产量占该国石油总产量的三分之一,是国内消费的主要燃料来源之一。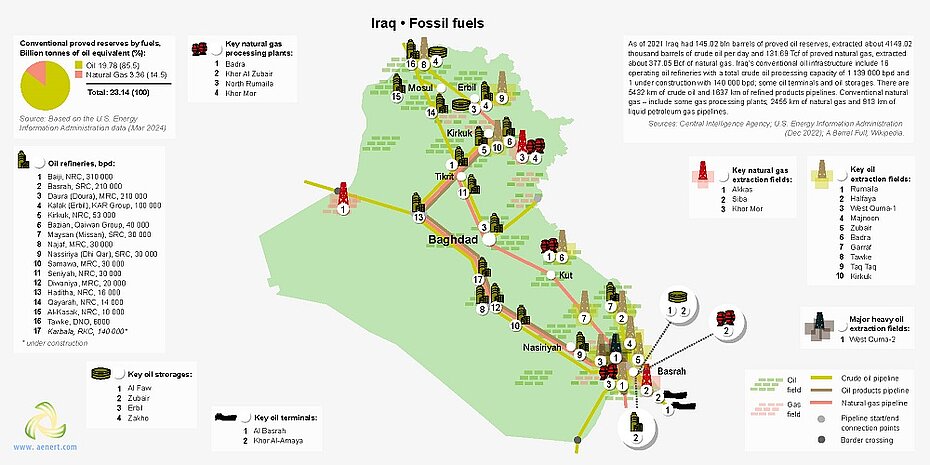
图5 伊拉克化石燃料行业基础设施
与原油类似,伊拉克已探明天然气储量的大部分位于该国南部的巴士拉省。 值得注意的是,伊拉克的大部分天然气储量与石油开采有关。 天然气处理、收集和加工基础设施不足,使伊拉克成为仅次于俄罗斯的第二大天然气燃烧国。 据世界银行估计,2022 年伊拉克每天燃烧约 180 亿立方米天然气,有可能为超过 300 万户家庭供电。 伊拉克与世界银行签署的零排放协议使伊拉克承诺采取一项战略,大幅减少天然气燃烧,并利用这种能源来振兴严重依赖原油的经济[13]。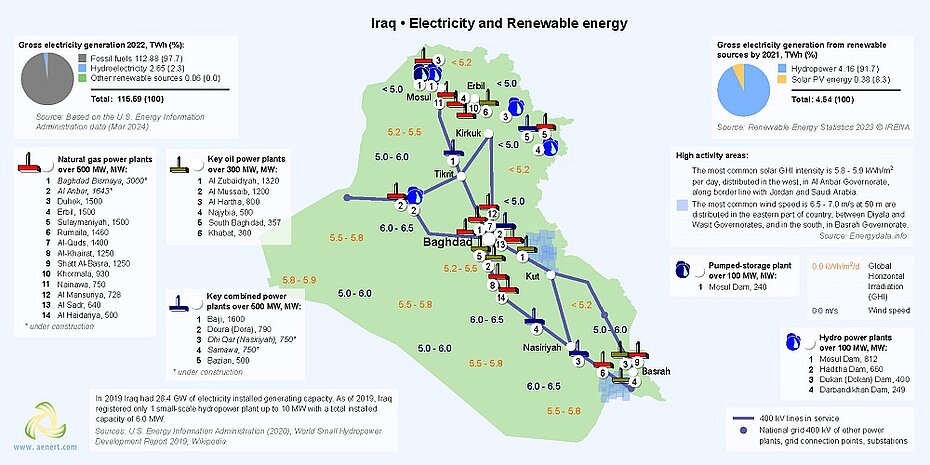
图 6. 伊拉克的电力生产和可再生能源
如前所述,伊拉克电力部门严重依赖化石燃料,2022年化石燃料发电量占发电量的97.7%。此外,该国天然气加工能力有限,严重依赖伊朗天然气和电力进口。 该国最大的发电设施Besmaya联合循环发电厂位于伊拉克首都巴格达以东25公里处,装机容量为3GW。
2022年水力发电厂发电量占全国电力的2,3%。摩苏尔大坝位于尼尼微省西部的底格里斯河沿岸,是该国主要的水力发电厂。 该大坝用于产生水力发电并为下游灌溉提供水。
如上所述,伊拉克拥有强大的可再生能源资源基础,其利用可以提高伊拉克的能源安全并减少温室气体排放。 可再生能源仅占发电量的0.05%左右,而整体基础设施薄弱使得可再生能源的整合存在问题,并对能源系统的稳定性带来额外的挑战。 该国需要采取全面的方法实现电力供应现代化,特别是电网容量和储能系统的扩展和现代化。
伊拉克承诺到2030年实现可持续发展,这需要可再生能源(主要是太阳能)占能源结构的20%。 然而,由于缺乏可再生能源监管法、政治不稳定以及迟迟未能做出必要的改变,这些目标的实现尚存疑问。 此外,紧张的安全局势和糟糕的经济状况也不利于吸引国际投资者[14]。
Sources: 1. The Global Innovation Index 2021, Rankings / Knowledge / World Intellectual Property Organization / Cornell University, INSEAD, and WIPO (2021): Energizing the World with Innovation. Ithaca, Fontainebleau, and Geneva *132 2. Patent Grants 2011-2020, resident & abroad / Statistical country profiles / World Intellectual Property Organization *185 3.Patents in Force 2020 / Statistical country profiles / World Intellectual Property Organization *109 4. QS World University Rankings 2022 *97 5. SCImago Country Rankings (1996-2020) / Country rankings / SCImago, (n.d.). SIR-SCImago Journal & Country Rank [Portal]. Retrieved 17 Nov 2021 *240 6. Internet users in 2018 / The World Factbook / Central Intelligence Agency *229 7. Internet users in 2018 (% Population) / The World Factbook / Central Intelligence Agency *229 8. Government expenditure on education, total (% of GDP), 2019 / United Nations Educational, Scientific, and Cultural Organization (UNESCO) Institute for Statistics. License: CCBY-4.0 / Data as of September 2021*177 9. Research and development expenditure (% of GDP), 2018 / UNESCO Institute for Statistics. License: CCBY-4.0 / Data *119 10. Scientific and technical journal articles, 2018 / National Science Foundation, Science and Engineering Indicators. License: CCBY-4.0 / Data *197 * Total number of countries participating in ranking | ||
| 图7. 伊拉克的教育和创新指数 |
与许多人口众多的国家一样,伊拉克在互联网用户绝对数量(0.83)方面表现良好,但如果考虑用户数量占总人口的比例,该国低于世界平均水平(0.38)。 还有一些积极因素,例如科技期刊文章数量 (0.76) 以及在 SCImago 国家排名中相对较高的位置 (0.75)。
Cuneiform writing of the ancient Sumerian or Assyrian civilization. Envato. DKX8FAG36L
图表中该国最薄弱的一点是政府研发支出(0.06)。 此外,由于缺乏有关伊拉克公共教育支出的信息以及其在全球创新指数中的缺席,这两个职位都空缺。
| Sources: 1. CO2 total emission by countries 2020 / European Commission / Joint Research Centre (JRC) / Emission Database for Global Atmospheric Research (EDGAR)*208 2. CO2 per capita emission 2020/European Commission/Joint Research Centre (JRC) / Emission Database for Global Atmospheric Research (EDGAR) *208 3. Forest area 2020 (% of land area) / The Global Forest Resources Assessment 2020 / Food and Agriculture Organization of the United Nations *234 4. Forest area change 2010-2020 (1000 ha/year) / The Global Forest Resources Assessment 2020 / Food and Agriculture Organization of the United Nations *234 5. The Environmental Performance Index (EPI) 2020 / Rankings / Yale Center for Environmental Law & Policy / Yale University *180 6. Annual freshwater withdrawals (m3 per capita), 2017 *179 Annual freshwater withdrawals, total (billion m3), 2017 – Food and Agriculture Organization, AQUASTAT data. /License: CC BY-4.0; Population – United Nations, Department of Economic and Social Affairs, Population Division (2019). World Population Prospects 2019, custom data acquired via website. Retrieved 15 November 2021 7. The National Footprint Accounts 2017 (Biocapacity Credit / Deficit) / Global Footprint Network *188 8. Methane emissions (kt of CO2 equivalent), 2018 / Data for up to 1990 are sourced from Carbon Dioxide Information Analysis Center, Environmental Sciences Division, Oak Ridge National Laboratory, Tennessee, United States. Data from 1990 are CAIT data: Climate Watch. 2020. GHG Emissions. Washington, DC: World Resources Institute. Available at: License : Attribution-NonCommercial 4.0 International (CC BY-NC 4.0) *191 9. The Climate Change Performance Index (CCPI) 2022 / Overall Results / Jan Burck, Thea Uhlich, Christoph Bals, Niklas Höhne, Leonardo Nascimento / Germanwatch, NewClimate Institute & Climate Action Network *60 * Total number of countries participating in ranking | ||
| 图 8. 伊拉克环境指数 |
描述伊拉克在生态和环境保护相关国际排名中的大部分指数都低于平均水平。 该国的环境问题包括森林面积低(0.12)、二氧化碳排放总量(0.14)和人均排放量(0.32)高。 该国未纳入 2022 年气候变化绩效指数 (CCPI),因此图表中的这一位置仍然空缺。 该国的积极环境特征之一是其每年淡水消耗量(0.90),与其他国家相比较高。 总体而言,伊拉克的环境状况需要显着改善。
[1] List of countries and dependencies by area/ Wikipedia / https://en.wikipedia.org/wiki/List_of_sovereign_states_and_dependencies_by_area
[2] List_of_countries_and_territories_by_population_density/ Wikipedia / https://en.wikipedia.org/wiki/List_of_countries_and_territories_by_population_density
[3] Iraq / The world factbook / Library / Central Intelligence Agency / https://www.cia.gov/library/publications/the-world-factbook/geos/qa.html
[4] GDP, PPP (constant 2011 international $) / World Bank, International Comparison Program database. License: CC BY-4.0 / Data / The World Bank / http://www.worldbank.org/
[5] GDP per capita, PPP (current international $)/ World Bank, International Comparison Program database. License: CC BY-4.0 / Data / The World Bank / http://www.worldbank.org/
[6] International Energy Statistic / Geography /U.S. Energy Information Administration (Sep 2023) / http://www.eia.gov
[7] Solar resource data obtained from the Global Solar Atlas, owned by the World Bank Group and provided by Solargis / Global Solar Atlas / http://globalsolaratlas.info/
[8] Wind Map / Global Wind Atlas 2.0, a free, web-based application developed, owned and operated by the Technical University of Denmark (DTU) in partnership with the World Bank Group, utilizing data provided by Vortex, with funding provided by the Energy Sector Management Assistance Program (ESMAP). For additional information: https://globalwindatlas.info
[9] Agricultural land (% of land area) /Food and Agriculture Organization, electronic files and web site. License: CC BY-4.0 / Data / The World Bank / http://www.worldbank.org/
[10] Forest area (% of land area) /Food and Agriculture Organization, electronic files and web site. License: CC BY-4.0 / Data / The World Bank / http://www.worldbank.org/
[11] World Bank What a Waste / Data / The World Bank / http://www.worldbank.org/
[12] BP Statistical Review of World Energy 2019 (PDF) / BP / https://www.bp.com
[13] Global Gas Flaring Tracker Report / PDF / https://thedocs.worldbank.org/en/doc/5d5c5c8b0f451b472e858ceb97624a18-0400072023/original/2023-Global-Gas-Flaring-Tracker-Report.pdf
[14] The Future of Renewable Energy in the Iraqi Economy under Fossil Energy: Forward-Looking Study / PDF / http://webology.org/data-cms/articles/20220123081317amWEB19198.pdf
图表和曲线的来源在图像下方指定。
有关伊拉克能源行业的更多信息,请参见此处