

Contents
General State of the Economy
The Philippines, officially the Republic of the Philippines, is a country in Southeast Asia. As an archipelago consisting of more than 7,000 islands surrounded by the Pacific Ocean, the South China Sea, the Sulu Sea, and the Celebes Sea, the Philippines shares no land borders with any country. The total length of the country's coastline is 36,289 km.
According to 2023 statistics, the Philippines, which in terms of size is 74th in the world, is home to around 114 million people. In terms of population density the country is 23rd in the world out of 199 countries considered. The administrative map of the country is divided into 81 provinces and 38 chartered cities with Manila as its capital and Quezon City as the country’s most-populous city. The political form of government is a presidential republic, and the official languages are Filipino and English [1,2,3].
| Republic of the Philippines | ||
|---|---|---|
| Capital: Manila | Density: 336/km2 | Currency: Philippine peso (₱) (PHP) |
| Official languages: Filipino, English | Life expectancy at birth: 69.4 years | GDP (purchasing power parity): $1.384 trillion (2024 est.) |
| National Day: 12 June | Area (land): 298,170 km2 | GDP - per capita (PPP): $12,127 (2024 est.) |
| Population: 114,163,719 (2024 est.) | Coastline: 36,289 km | Internet country code: .ph |
Source: [1,2,3,4,5]

Tropical beach in El Nido, Palawan, Philippines. Envato. CQGD2BURKM
The ranking positions of the Philippines relative to other countries have been determined for an extensive list of economic, energy, innovative and educational indices, as well as for metrics reflecting the state of the environment. The economic indices include, for example, GDP per capita, annual average GDP growth, high-technology exports, and others. The list of energy indices includes proven reserves of oil, gas and coal, production-consumption ratio combined, and energy use, etc. Each of the indices has a ranked list of included member countries. Since the number of countries in each rating is different for each index, the positioning of the country of interest is displayed on a special chart, where the vertical axis is a uniform relative scale from 0 to 1, whereas the horizontal axis denominates the various indices and respective numbers relating to the descriptions given underneath.
Thus, in such a relative “0-1” diagram, the country’s position is marked with a dot in proportion to its location in the original rating list. If the country is among the leaders regarding the selected indicator, it will be marked close to 1 in the upper green zone on the relevant chart “0-1”, if the country is an outsider in the rating list, then it will be marked in the lower red zone of the chart “0-1”, etc. A single list of indices is used for all countries. If a country is not in the ranking list for any index, then the corresponding position on the charts is not displayed.
Ranking position of the Philippines for list of economic indices:
| Sources: 1. GDP (purchasing power parity), 2020 est. / The World Factbook/Library/Central Intelligence Agency *228 2. GDP - per capita (PPP), 2020 / The World Factbook/Library/Central Intelligence Agency *229 3. Inflation rate (consumer prices), 2019 est. / The World Factbook/Library/Central Intelligence Agency *228 4. Charges for the use of intellectual property, receipts (BoP, current US$), 2020 / International Monetary Fund, Balance of Payments Statistics Yearbook, and data files. / License: CC BY-4.0 *88 5. The Global Competitiveness Index 2019 / Rankings / Reports / World Economic Forum *141 6. High-technology exports (current US$) 2019-2020 / United Nations, Comtrade database through the WITS platform / License: CCBY-4.0 / Data *134 7. 2021 Index of Economic Freedom / International Economies / The Heritage Foundation *178 8. Reserves of foreign exchange and gold, 2017 est. / The World Factbook / Library / Central Intelligence Agency *195 9. Annual average GDP growth in %, for the last 10 years (2011-2020) / World Bank national accounts data, and OECD National Accounts data files / License: CC BY-4.0 *206 10. Public debt (% of GDP), 2017 est. / The World Factbook / Library / Central Intelligence Agency (from smallest to largest) *210 * Total number of countries participating in ranking Figure 1. Economic Indices of the Philippines |
For seven of the ten indices presented in the chart above, the Philippines' positioning is above the world average. Of the indices presented, the country has the highest values for Gross Domestic Product based on purchasing power parity (0.88), High technology exports (0.86), Reserves of foreign exchange and gold (0.85), as well as the Annual average GDP growth in % (0.85). The weakest spots within the Philippine economics are GDP per capita (0.34), Charges for the use of intellectual property (0.38) and the Inflation rate (0.45).
Energy Resources
The Philippines has its own reserves of fossil fuels in the form of coal, natural gas and crude oil, but they are significantly lower than those of the world leaders. The share of coal is 0.03% of the world’s total, natural gas – 0.05%, and oil – 0.008% [6].
In terms of tons of oil equivalent, according to the 2024 data, conventional proved reserves by fuel type were: 70.1% – coal, 24.6% – natural gas, and 5.3% – oil (Fig.5).
Table 1. Fossil energy resources of the Philippines
| Resource /Explanations | Crude oil* | Natural gas* | Coal* | Tight Oil** | Shale Gas** |
|---|---|---|---|---|---|
| Value | 0.1 (0.01%) | 3.5 (0.05%) | 398 (0.03%) | no date | no date |
| Unit | million barrels | Tcf | million short tons | - | - |
| Year | 2021 | 2020 | 2021 | - | - |
| Source | [6] | [6] | [6] | [-] | [-] |
*share of the country’s reserves in world total is provided in brackets
**unproved technically recoverable
The most common sources of renewable energy in the Philippines are geothermal and hydropower, contributing together about 82% to all renewable electricity produced in 2021. Due to its location, the country has great opportunities to utilize the full range of renewable energy sources. This is especially true for wind energy, particularly offshore wind energy, whose potential in the Philippines is enormous due to its extensive archipelagic coastline. In the high activity areas distributed over the country the wind speed reaches 8.0 m/s at 50 m. In addition, thanks to the Pacific Ocean, the country has great potential to harness ocean energy through the application of wave energy converters.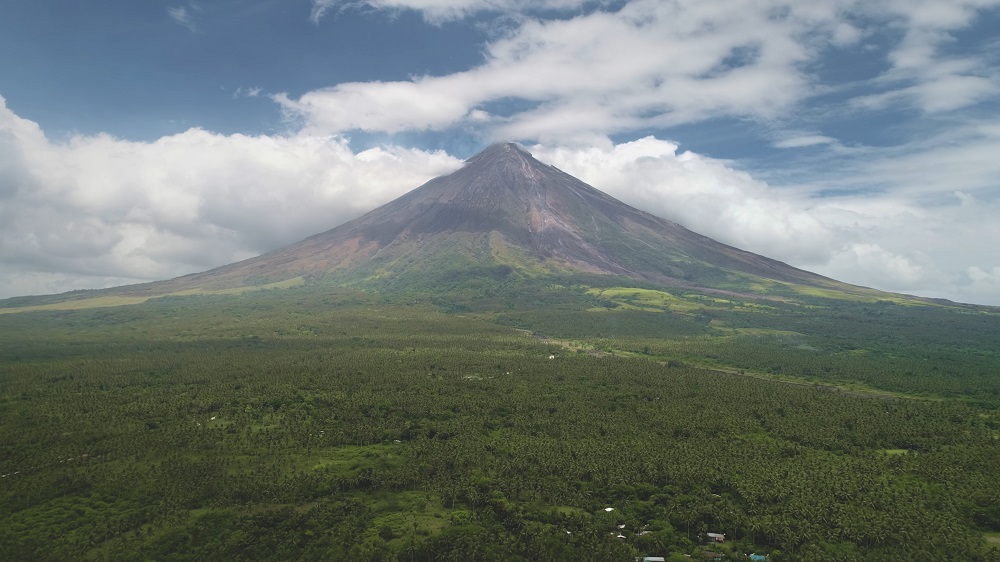
Closeup Philippines volcano. Envato. 4N3BG6Z7V8
The Philippines has several areas with high solar energy potential, with the highest DNI solar intensity of 5.2-5.6 kWh/m2 per day recorded in the northwestern part of the country, on the island of Luzon, and in the southwestern part of the country, on the island of Mindanao.
Table 2. Renewable energy resources of the Philippines
| Resource/ explanations | Solar Potential (GHI)* | Wind Potential (50 м)* | Bio Potential (agricultural area) | Bio Potential (forest area) | Municipal Solid Waste |
|---|---|---|---|---|---|
| Value | 4.9-5.2 | 5.0-8.0 | 42.5 | 24.1 | 0.39 |
| Unit | kWh/m2/day | m/s | % of land area | % of land area | kg/per capita/day |
| Year | 2020 | 2020 | 2020 | 2020 | 2018 |
| Source | [8] | [9] | [10] | [11] | [12] |
*for the majority of the territory of the country
The diverse ecosystems of the Philippines, including fairly extensive agricultural and forestry lands, form a worthy resource base for the development of a number of bioenergy technologies, particularly biogas and bioethanol production.
PHILIPPINES, CATANDUANES RADAR
Latitude: 13.98 Longitude: 124.32
Average speed: 4.04 m/s Operational share: 70%
Average daily wind speed for 10 years of observations, m/s, 10 m above ground
Source: based on NOAA U.S. Department of Commerce
PHILIPPINES, ORMOC
Latitude: 11.07, Longitude: 124.57
Average daily sky coverage over 10 years of observations, %
CLR - clear, SCT - scattered from 1/8 TO 4/8, BKN - broken from 5/8 TO 7/8, OVC - overcast, OBS - obscured, POB - partial obscuration
Source: based on NOAA U.S. Department of Commerce
Energy Balance
According to [6], in 2022 in the Philippines, the total production of primary energy was 0.469 quadrillion Btu, while consumption was at the level of 1.798 quadrillion Btu. Thus, the share of domestic production in primary energy consumption was 26.1%. This makes the Philippines a country highly dependent on energy imports.
According to the Statistical Review of World Energy 2022, primary energy consumption in the Philippines in 2021 amounted to 1.96 exajoules and was dominated by oil – 41.8%, followed by coal – 40.3%, renewables – 7.6%, natural gas – 6.1%, and hydroelectricity – 4.6% [7].
Fossil fuel production in the Philippines lags far behind the demand: in 2022, coal consumption was almost as high as production and oil consumption about 30 times higher.
Source: U.S. Energy Information Administration (Mar 2024) / www.eia.gov
Figure 2. The Production and Consumption of fossil fuels in the Philippines (left — coal, in the center — gas, right — oil)
Total electricity generation in the Philippines has grown by about 65% over the past ten years. In 2022, approximately 78% of electricity was produced by thermal power plants. About 70% of total electricity generation from fossil fuels comes from coal.
Sources: U.S. Energy Information Administration (Mar 2024) / www.eia.gov | ||
| Figure 3. Electricity Generation in the Philippines |
Renewables also contribute to the overall balance of electricity generation, reaching a share of about 22% in 2022, whereby 8% came from hydroelectric power plants. By comparison, in 2010 the amount of electricity generated from renewables was about 50% less.
The volume of electricity generation in the Philippines exceeds the volume of consumption. However, it should be taken into account that the distribution losses exceed 9 billion kWh per year [3].
| Sources: 1. Crude oil proved reserves, 2021 / International Energy Statistic/Geography / U.S. Energy Information Administration (Nov 2021)*98 2. Natural gas proved reserves 2021 / International Energy Statistic / Geography / U.S. Energy Information Administration (Nov 2021) *99 3. Total recoverable coal reserves 2019 / International Energy Statistic / Geography / U.S. Energy Information Administration (Nov 2021) *81 4. Combination production-consumption for Crude oil 2018 / International Energy Statistic / Geography / U.S. Energy Information Administration (Nov 2021) *219 5. Combination production-consumption for Natural gas 2019 / International Energy Statistic / Geography / U.S. Energy Information Administration (Nov 2021) *123 6. Combination production-consumption for Coal 2019 / International Energy Statistic / Geography / U.S. Energy Information Administration (Nov 2021) *128 7. Electricity – from other renewable sources (% of total installed capacity), 2017 est. / The World Factbook / Library / Central Intelligence Agency *170 8. GDP per unit of energy use (PPP per unit of oil equivalent), 2020 *66 Primary energy consumption - BP Statistical Review of World Energy 2021/BP;GDP (purchasing power parity) - The World Factbook/Library/Central Intelligence Agency 9. Energy use (primary energy use of oil equivalent per capita) 2020 *127 Primary energy consumption – BP Statistical Review of World Energy 2021; Population - United Nations, Department of Economic and Social Affairs, Population Division (2019). World Population Prospects 2019, custom data acquired via website. Retrieved 15 November 2021*66 10. The Global Energy Architecture Performance Index Report (EAPI) 2017 / Rankings / Reports / World Economic Forum 11. Electric power consumption (kWh per capita), 2016 *217 Electricity Consumption - The World Factbook / Library / Central Intelligence Agency; Population - United Nations, Department of Economic and Social Affairs, Population Division (2019). World Population Prospects 2019, custom data acquired via website. Retrieved 15 November 2021 12. Combination of electricity production-consumption (kWh)/The World Factbook/Library/Central Intelligence Agency *216 * Total number of countries participating in ranking Figure 4. Energy indices of the Philippines |
The energy indices shown in the graph above reveal the Philippines as a country dealing with high energy demands. The generation to consumption ratio for coal (0.07) and crude oil (0.1) is very low because the country's energy needs are much higher than its domestic capacity. This is also the case for the primary energy use of oil equivalent per capita, which is the lowest indicator (0.05) of those presented. The highest indicator for the Philippines depicted in the ranking is GDP per unit of energy use (0.94). In addition, the country's performance is relatively good in Combination of electricity production-consumption (0.82) and Electricity – from other renewable sources as % of total installed capacity (0.69).
Energy Infrastructure
A territorial map showing distribution of the largest infrastructure projects of the fossil fuel sector in the Philippines is displayed in Figure 5. As previously mentioned, coal reserves account for 70.1% of all proven reserves of fossil fuels, natural gas – for 24.6%, and oil – for 5.3%.
The Philippines has a number of coal districts distributed throughout the country. The main coal fields under development are located on the Semirara Island with Panian coalfield as the largest of three coalfields on the island. In addition, relatively decent resources are extracted in the provinces of Cebu, Zamboanga Sibugay and Albay, as can be seen from the map below.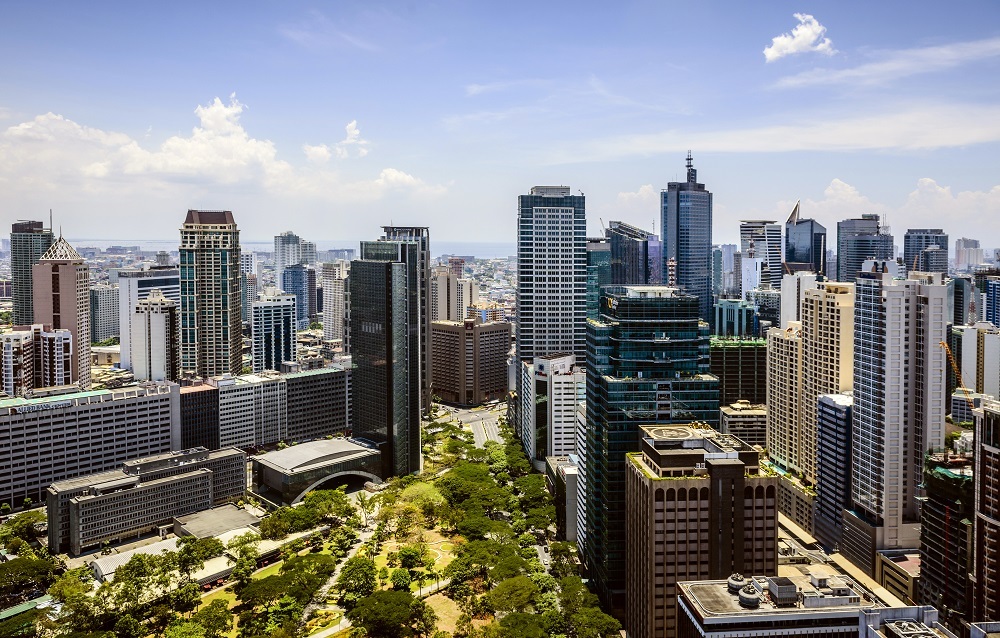
Manila. Envato. UWF63DJTZ8
The majority of oil and gas exploration and drilling activities in the country take place off the west coast of the island of Palawan. From here, a natural gas pipeline also runs to the Batangas LNG plant on Luzon Island.
Figure 5. Basic infrastructure facilities of the fossil fuel sector in the Philippines
As already mentioned, the electricity generation mix in the Philippines is dominated by fossil fuels, particularly coal. The two largest islands in the country, Luzon and Mindanao, have the most fossil fuel power plants.
Figure 6. Electricity production in the Philippines
As of 2022, hydropower in the Philippines accounts for 8% of electricity generation. In general, small river-based hydropower plants are distributed throughout the country. However, there are a few large facilities concentrated mainly on the island of Luzon south of Manila.
The Philippines is one of the world's top geothermal energy producers because of its location along the area of Pacific volcanoes. Geothermal energy, generated in the country from various types of geothermal power plants, accounts for more than 45% of the total renewable electricity. The 458-MW Makiling-Banahaw geothermal power station, located in Laguna and Batangas provinces, is one of the world’s largest geothermal power projects in the world.
Despite the fact that the Philippines is geographically located in a region with a large amount of sunshine per year, the solar sector is relatively underdeveloped and large-scale solar power plants have only recently begun to appear in the country. Tarlac solar PV Park located in Central Luzon is one of the largest solar PV power project in the Philippines. in the Philippines")
Figure 7. Renewable energy in the Philippines: geothermal, hydrogen, solar and wind resources
The Philippine government is implementing a number of measures to reduce dependence on fossil fuels and meet the growing demand for energy. Under the Electricity Development Plan 2020-2040, 50% of electricity will be generated from renewable energy sources by 2040, with offshore wind sources set to play an important role in the energy mix. To realize this plan, the government is taking significant steps, including the development of the country's largest wind farm with a capacity of 160MW in Pagudpud, on the north coast of the Luzon Island [13].
Figure 8. Renewable energy in the Philippines: Bioenergy
The Philippines has rich biomass resources, including crop residues, forest residues, animal waste, municipal solid waste and agricultural waste. Although many of these resources are rather underdeveloped, the biomass industry in the country is growing rapidly and shows great promise in providing renewable baseload energy in the Philippines. The map above shows bioenergy infrastructure in the country including biodiesel, biomass and bioethanol plants.
Education and Innovation
The following chart shows the Philippines’ positions in terms of education and innovation:
Sources: 1. The Global Innovation Index 2021, Rankings / Knowledge / World Intellectual Property Organization / Cornell University, INSEAD, and WIPO (2021): Energizing the World with Innovation. Ithaca, Fontainebleau, and Geneva *132 2. Patent Grants 2011-2020, resident & abroad / Statistical country profiles / World Intellectual Property Organization *185 3.Patents in Force 2020 / Statistical country profiles / World Intellectual Property Organization *109 4. QS World University Rankings 2022 *97 5. SCImago Country Rankings (1996-2020) / Country rankings / SCImago, (n.d.). SIR-SCImago Journal & Country Rank [Portal]. Retrieved 17 Nov 2021 *240 6. Internet users in 2018 / The World Factbook / Central Intelligence Agency *229 7. Internet users in 2018 (% Population) / The World Factbook / Central Intelligence Agency *229 8. Government expenditure on education, total (% of GDP), 2019 / United Nations Educational, Scientific, and Cultural Organization (UNESCO) Institute for Statistics. License: CCBY-4.0 / Data as of September 2021*177 9. Research and development expenditure (% of GDP), 2018 / UNESCO Institute for Statistics. License: CCBY-4.0 / Data *119 10. Scientific and technical journal articles, 2018 / National Science Foundation, Science and Engineering Indicators. License: CCBY-4.0 / Data *197 * Total number of countries participating in ranking | ||
| Figure 9. The indices of education and innovation in the Philippines |
Because of its large population, the Philippines is one of the world leaders in the absolute number of Internet users (0.95), but if you look at the number of users in proportion to the entire population, the country is on par with the global average (0.50). Besides, the Philippines' best indicators relate to the SCImago Country Rankings (0.73), and the Scientific and technical journal articles (0.68). The nation's lowest performance in this category relates to state expenditure on Research and development (0.17) and on Education as % of GDP (0.26).
Ecology and Environment Protection
Indicators related to environmental issues are presented in the following diagram:
| Sources: 1. CO2 total emission by countries 2020 / European Commission / Joint Research Centre (JRC) / Emission Database for Global Atmospheric Research (EDGAR)*208 2. CO2 per capita emission 2020/European Commission/Joint Research Centre (JRC) / Emission Database for Global Atmospheric Research (EDGAR) *208 3. Forest area 2020 (% of land area) / The Global Forest Resources Assessment 2020 / Food and Agriculture Organization of the United Nations *234 4. Forest area change 2010-2020 (1000 ha/year) / The Global Forest Resources Assessment 2020 / Food and Agriculture Organization of the United Nations *234 5. The Environmental Performance Index (EPI) 2020 / Rankings / Yale Center for Environmental Law & Policy / Yale University *180 6. Annual freshwater withdrawals (m3 per capita), 2017 *179 Annual freshwater withdrawals, total (billion m3), 2017 – Food and Agriculture Organization, AQUASTAT data. /License: CC BY-4.0; Population – United Nations, Department of Economic and Social Affairs, Population Division (2019). World Population Prospects 2019, custom data acquired via website. Retrieved 15 November 2021 7. The National Footprint Accounts 2017 (Biocapacity Credit / Deficit) / Global Footprint Network *188 8. Methane emissions (kt of CO2 equivalent), 2018 / Data for up to 1990 are sourced from Carbon Dioxide Information Analysis Center, Environmental Sciences Division, Oak Ridge National Laboratory, Tennessee, United States. Data from 1990 are CAIT data: Climate Watch. 2020. GHG Emissions. Washington, DC: World Resources Institute. Available at: License : Attribution-NonCommercial 4.0 International (CC BY-NC 4.0) *191 9. The Climate Change Performance Index (CCPI) 2022 / Overall Results / Jan Burck, Thea Uhlich, Christoph Bals, Niklas Höhne, Leonardo Nascimento / Germanwatch, NewClimate Institute & Climate Action Network *60 * Total number of countries participating in ranking | ||
| Figure 10. Environmental Indices of the Philippines |
The Philippines belongs to the group of countries with the large amount of carbon dioxide (0.16) and methane emissions (0.11). In the Philippines, as can be seen from the diagram, the area of forests is lower than the world average (0.43), but their number has shown a steady increasing trend in recent years (0.95). Among the country's positive environmental characteristics is its annual freshwater withdrawal (0.86), which is relatively high, compared to other countries. In general, the environmental situation in the Philippines requires significant improvement.
References
[1] List of sovereign states and dependencies by area / Wikipedia / en.wikipedia.org/wiki/List_of_sovereign_states_and_dependencies_by_area
[2] List of countries and dependencies by population density / Wikipedia / en.wikipedia.org/wiki/List_of_countries_and_dependencies_by_population_density
[3] Philippines / The world factbook / Library / Central Intelligence Agency / www.cia.gov
[4] GDP, PPP (constant 2011 international $) / World Bank, International Comparison Program database. License: CC BY-4.0 / Data / The World Bank / www.worldbank.org
[5] GDP per capita, PPP (current international $) / World Bank, International Comparison Program database. License: CC BY-4.0 / Data / The World Bank / www.worldbank.org
[6] International Energy Statistic / Geography / U.S. Energy Information Administration / www.eia.gov/beta/international/analysis.cfm
[7] BP Statistical Review of World Energy 2020 - 2022 (PDF) / BP / www.bp.com
[8] Solar resource data obtained from the Global Solar Atlas, owned by the World Bank Group and provided by Solargis / Global Solar Atlas / globalsolaratlas.info
[9] Wind Map / Global Wind Atlas 2.0, a free, web-based application developed, owned and operated by the Technical University of Denmark (DTU) in partnership with the World Bank Group, utilizing data provided by Vortex, with funding provided by the Energy Sector Management Assistance Program (ESMAP). For additional information: https://globalwindatlas.info
[10] Agricultural land (% of land area) / Food and Agriculture Organization, electronic files and web site. License: CC BY-4.0 / Data / The World Bank / www.worldbank.org
[11] Forest area (% of land area) / Food and Agriculture Organization, electronic files and web site. License: CC BY-4.0 / Data / The World Bank / www.worldbank.org
[12] What a Waste 2012 (PDF) / Resources / The World Bank / www.worldbank.org
[13] POWER DEVELOPMENT PLAN 2020-2040 / Department Of ENERGY / www.doe.gov.ph/sites/default/files/pdf/electric_power/pdp-2020-2040.pdf
The sources of charts and curves are specified under the images.
For more information about the energy industry in Philippines see here