

亚美尼亚,正式名称为亚美尼亚共和国,是一个位于高加索地区的内陆国家,西边是土耳其,北边是格鲁吉亚,东边是阿塞拜疆,东南边是伊朗。塞凡湖位于埃里温以北约70公里处,是高加索地区最大的淡水高地湖泊,占亚美尼亚全境的六分之一。
据2023年统计,亚美尼亚领土面积排名世界第142位,人口约300万。按人口密度计算,该国居世界第123位。亚美尼亚实行议会民主制,分为11个省。首都和最大城市是埃里温,官方语言是亚美尼亚语[1,2,3]。
| Armenia/Republic of Armenia | ||
|---|---|---|
| Capital: Yerevan | Density: 101.5/km2 | Currency: Dram (֏) (AMD) |
| Official languages: Armenian | Life expectancy at birth: 72.17 years | GDP (PPP): $57.740 billion (2023 est.) |
| National Day: 21 September | Area (land): 29,743 km2 | GDP - per capita (PPP): $19,489 (2023 est.) |
| Population: 3,165,000 (2024 est.) | Coastline: 0 km | Internet country code: .am |
Source: [1,2,3,4,5]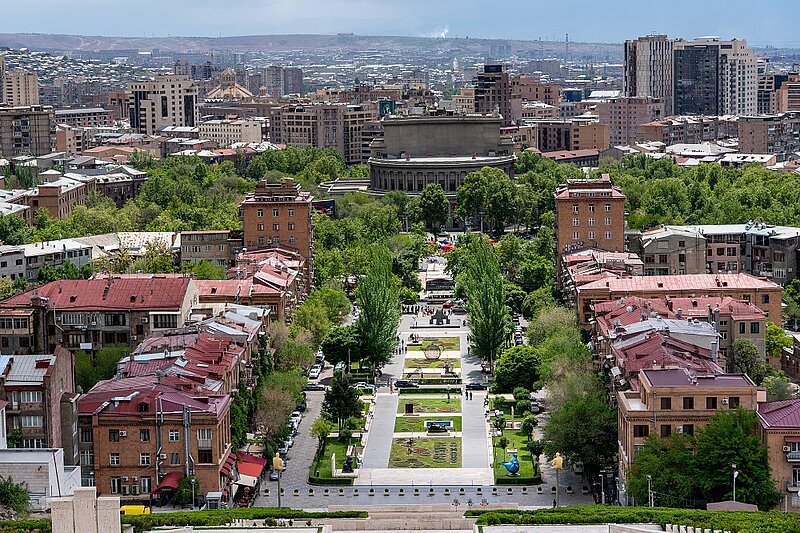
View of Yerevan from above. Envato Elements. LT4ZJFRMSV
亚美尼亚相对于其他国家的排名是根据一系列广泛的经济、能源、创新和教育指数以及反映环境状况的指标确定的。经济指标包括人均GDP、年均GDP增长率、高新技术出口等。能源指数列表包括石油、天然气和煤炭的探明储量、产耗比以及能源使用情况等。每个指数都有一个包含的成员国排名列表。由于每个指数的每个评级的国家数量不同,因此将感兴趣的国家的定位显示在一个特殊的图表上,其中纵轴是从0到1的统一相对刻度,而横轴表示各个指数以及与下面给出的描述相关的相应编号。
因此,在这样一个相对的“0-1”图中,该国家的位置按照其在原始评级列表中的位置成比例地用点来标记。如果该国在所选指标方面处于领先地位,则将在相关图表“0-1”的上部绿色区域中标记为接近 1,如果该国在评级列表中属于局外人,则将标记为接近 1图表下方红色区域“0-1”等
亚美尼亚经济指数排名:
| Sources: 1. GDP (purchasing power parity), 2020 est. / The World Factbook/Library/Central Intelligence Agency *228 2. GDP - per capita (PPP), 2020 / The World Factbook/Library/Central Intelligence Agency *229 3. Inflation rate (consumer prices), 2019 est. / The World Factbook/Library/Central Intelligence Agency *228 4. Charges for the use of intellectual property, receipts (BoP, current US$), 2020 / International Monetary Fund, Balance of Payments Statistics Yearbook, and data files. / License: CC BY-4.0 *88 5. The Global Competitiveness Index 2019 / Rankings / Reports / World Economic Forum *141 6. High-technology exports (current US$) 2019-2020 / United Nations, Comtrade database through the WITS platform / License: CCBY-4.0 / Data *134 7. 2021 Index of Economic Freedom / International Economies / The Heritage Foundation *178 8. Reserves of foreign exchange and gold, 2017 est. / The World Factbook / Library / Central Intelligence Agency *195 9. Annual average GDP growth in %, for the last 10 years (2011-2020) / World Bank national accounts data, and OECD National Accounts data files / License: CC BY-4.0 *206 10. Public debt (% of GDP), 2017 est. / The World Factbook / Library / Central Intelligence Agency (from smallest to largest) *210 * Total number of countries participating in ranking 图 1. 亚美尼亚的经济指数 |
如上图所示,该国一半的经济指标低于世界平均水平。排名中描绘的最高指标是 2021 年经济自由指数 (0.82) 和年平均 GDP 增长率 (0.73)。该国经济指标中最薄弱的部分是高科技出口(0.31)以及外汇和黄金储备(0.39)。总体而言,亚美尼亚的经济不仅依赖于出口前景、外国投资和私人转移,而且首先严重依赖俄罗斯
亚美尼亚没有探明的原油和天然气储量,所有化石燃料都需要进口,其中天然气占亚美尼亚能源进口的最大份额,其次是石油产品。
尽管该国煤炭储量为 1.63 亿短吨[6],占世界储量的 0.15%,但其开采的经济可行性尚未确定。这也适用于现有的油页岩矿床,这些油页岩矿床也尚未被开采。
表1. 亚美尼亚化石能源资源
| Resource /Explanations | Crude oil* | Natural gas* | Coal* | Oil shale (kerogen) | Shale Gas |
|---|---|---|---|---|---|
| Value | 0 | 0 | 163 (0.15%) | 0.31 | - |
| Unit | - | - | million short tons | billion barrels | - |
| Year | - | - | 2021 | 2008 | - |
| Source | [-] | [-] | [6] | [7] | [-] |
* 括号内提供了该国储量占世界总储量的比例
通过将各种可再生能源纳入该国的能源系统,政府计划减少亚美尼亚对天然气进口和核能的依赖。尽管风能和太阳能潜力巨大,但它们才刚刚进入亚美尼亚的能源供应系统。西部地区GHI强度达到4.4~4.6kWh/m 2每天。
SEVAN OZERO. ARMENIA
Latitüde: 40.57 Longitude: 45
Average daily sky coverage over 10 years of observations, %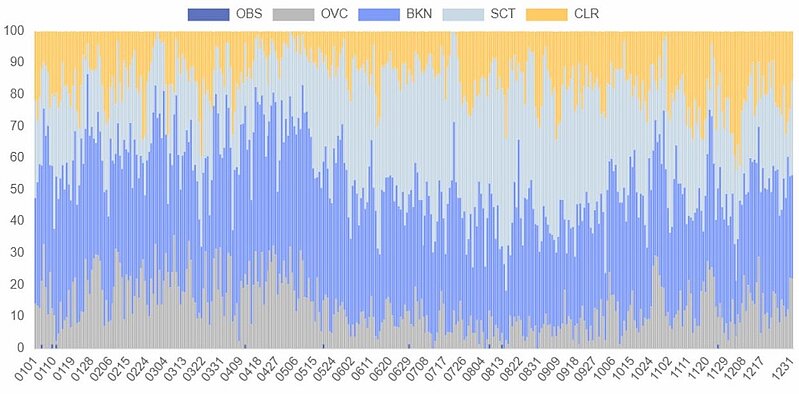
CLR - clear, SCT - scattered from 1/8 TO 4/8, BKN - broken from 5/8 TO 7/8, OVC - overcast, OBS - obscured, POB - partial obscuration
Source: based on NOAA U.S. Department of Commerce
Detailed information: Interactive map of solar resources
SEVAN OZERO. ARMENIA
Latitüde: 40.57 Longitude: 45
Average speed: 1.85 m/s Operational share: 29%
Average daily wind speed for 10 years of observations, m/s, 10 m above the ground
Source: based on NOAA U.S. Department of Commerce
Detailed information: Interactive map of wind resources
亚美尼亚高山、高原的地理位置为风能的利用创造了有利的条件。高活动区的风速在 50 m 高度处超过 7.0 m/s,并且在全国范围内普遍存在,特别是在 Aragatsotn、Gegharkunik 和 Syunik 地区。
表2. 亚美尼亚的可再生能源资源
| Resource/ explanations | Solar Potential (GHI)* | Wind Potential (50 м)* | Bio Potential (agricultural area) | Bio Potential (forest area) | Municipal Solid Waste |
|---|---|---|---|---|---|
| Value | 4.4 -4.6 | 4.0-7.0 | 58.9 | 11.5 | 0.47 |
| Unit | kWh/m2/day | m/s | % of land area | % of land area | kg/per capita/day |
| Year | 2020 | 2020 | 2020 | 2020 | 2018 |
| Source | [8] | [9] | [10] | [11] | [12] |
*该国大部分领土
由于亚美尼亚森林覆盖率不高,生物能源发展潜力主要在于农业生物质。考虑到亚美尼亚作为山地国家,河流众多,小水电潜力相当可观。水力发电已经成为亚美尼亚电力系统的稳定组成部分,提供该国约30%的电力。
根据[6],2022年亚美尼亚一次能源总产量为0.039万亿英热单位,而消费量为0.169万亿英热单位。 因此,国内生产在一次能源消费中的份额约为23%。 这使得亚美尼亚成为一个严重依赖能源进口的国家。
根据国际能源署的审查,亚美尼亚的能源结构以天然气为主(2020年占能源供应总量的59.6%),亚美尼亚国内能源生产主要来自核能和水力资源。
Source: U.S. Energy Information Administration (Mar 2024) / www.eia.gov
2. 亚美尼亚化石燃料的生产和消费(左 — 煤炭,中 — 天然气,右 — 石油)
2000年至2022年间,化石燃料消耗量增加了一倍多,其中天然气需求增加109%,原油需求增加91%,煤炭需求增加700%以上。如上所述,所有化石燃料都是进口的。
Sources: U.S. Energy Information Administration (Mar 2024) / www.eia.gov | ||
图 3. 亚美尼亚的发电量 |
2011年至2021年间,该国电力生产水平大致持平,而消费量却增长了30%。亚美尼亚出口部分生产的电力,其中大部分换取伊朗的天然气。
如果我们看看发电的资源,尽管近年来出现了一些转向可再生能源的趋势,但发电仍然以化石燃料为主。亚美尼亚的核电发电量几乎与水力发电量相同。根据美国能源情报署的数据,总发电量以化石燃料为主(43.4%),其次是水力发电(22.8%)、核能(30.0%)和其他可再生能源(3.8%)。
| Sources: 1. Crude oil proved reserves, 2021 / International Energy Statistic/Geography / U.S. Energy Information Administration (Nov 2021)*98 2. Natural gas proved reserves 2021 / International Energy Statistic / Geography / U.S. Energy Information Administration (Nov 2021) *99 3. Total recoverable coal reserves 2019 / International Energy Statistic / Geography / U.S. Energy Information Administration (Nov 2021) *81 4. Combination production-consumption for Crude oil 2018 / International Energy Statistic / Geography / U.S. Energy Information Administration (Nov 2021) *219 5. Combination production-consumption for Natural gas 2019 / International Energy Statistic / Geography / U.S. Energy Information Administration (Nov 2021) *123 6. Combination production-consumption for Coal 2019 / International Energy Statistic / Geography / U.S. Energy Information Administration (Nov 2021) *128 7. Electricity – from other renewable sources (% of total installed capacity), 2017 est. / The World Factbook / Library / Central Intelligence Agency *170 8. GDP per unit of energy use (PPP per unit of oil equivalent), 2020 *66 Primary energy consumption - BP Statistical Review of World Energy 2021/BP;GDP (purchasing power parity) - The World Factbook/Library/Central Intelligence Agency 9. Energy use (primary energy use of oil equivalent per capita) 2020 *127 Primary energy consumption – BP Statistical Review of World Energy 2021; Population - United Nations, Department of Economic and Social Affairs, Population Division (2019). World Population Prospects 2019, custom data acquired via website. Retrieved 15 November 2021*66 10. The Global Energy Architecture Performance Index Report (EAPI) 2017 / Rankings / Reports / World Economic Forum 11. Electric power consumption (kWh per capita), 2016 *217 Electricity Consumption - The World Factbook / Library / Central Intelligence Agency; Population - United Nations, Department of Economic and Social Affairs, Population Division (2019). World Population Prospects 2019, custom data acquired via website. Retrieved 15 November 2021 12. Combination of electricity production-consumption (kWh)/The World Factbook/Library/Central Intelligence Agency *216 * Total number of countries participating in ranking 图 4. 亚美尼亚的能源指数 |
上图所示的能源指数表明亚美尼亚是一个能源需求较高的国家。由于亚美尼亚没有大量化石燃料储量,因此该国在原油和天然气方面的头寸在上图中仍为空白。图表中反映的最强指标是煤炭生产-消费组合(0.76)和电力生产-消费组合(0.61)。此外,亚美尼亚单位能源消耗GDP的表现也相对较好(0.55)。
亚美尼亚没有大量原油、天然气和煤炭储量。该国目前没有化石燃料生产[13]。由于亚美尼亚完全依赖从其他国家进口,且天然气占其能源消费总量的很大一部分,因此天然气管道系统堪称亚美尼亚化石燃料行业的主要基础设施部分。大部分天然气是通过格鲁吉亚的管道从俄罗斯进口的。一小部分还来自伊朗,根据易货协议,亚美尼亚向伊朗出口电力。
图5 亚美尼亚化石燃料行业基础设施
亚美尼亚能源基础设施的一个重要战略目标是位于赫拉兹丹河左岸、靠近埃里温的阿博维扬地下储气站。该储气设施旨在平衡天然气消费的季节性不规律,并在供应限制的情况下向消费者提供天然气。
亚美尼亚天然气发电厂位于该国中部地区,其中 Hrazdan TPP 是最大的发电设施。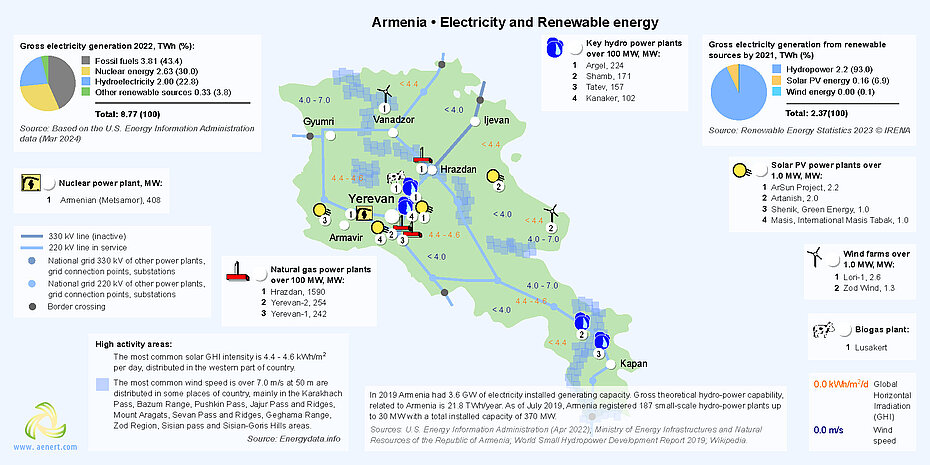
图 6. 亚美尼亚的电力生产和可再生能源
如前所述,2022年水电占总发电量的比重为22.8%。 从可再生能源发电来看,水力发电处于领先地位(93%),其次是太阳能发电(6.9%)和风力发电(0.1%)。 因此,水力发电,包括主要基于赫拉兹丹河和沃罗坦河的小水力发电,是亚美尼亚电力系统的战略组成部分。 阿尔杰尔水电站是亚美尼亚最大的运营水力发电厂,位于叶格瓦尔德地区,是塞凡-赫拉兹丹梯级的一部分,塞凡-赫拉兹丹梯级是位于塞凡湖和埃里温之间的赫拉兹丹河及其支流上的水力发电厂综合体。
许多可再生能源设施已经在该国投入运营。 最大的并网太阳能发电厂之一是位于该国中部科泰克省的2.2MW ArSun光伏电站。
最大限度地利用能源效率潜力,大力发展该国的可再生能源部门,是亚美尼亚 2021 年能源战略的关键优先事项之一。 政府预计太阳能光伏发电容量到2024年将增至100兆瓦,到2030年将增至1,000兆瓦,这将使其在总发电量中的份额提高至15%。 到2036年,包括水电在内的所有可再生能源的总份额应增加到66%。 为了实现这一雄心勃勃的目标,除了太阳能之外,还必须投产191兆瓦的水力发电厂(小型和大型)和500兆瓦的风力发电能力[14]。
Sources: 1. The Global Innovation Index 2021, Rankings / Knowledge / World Intellectual Property Organization / Cornell University, INSEAD, and WIPO (2021): Energizing the World with Innovation. Ithaca, Fontainebleau, and Geneva *132 2. Patent Grants 2011-2020, resident & abroad / Statistical country profiles / World Intellectual Property Organization *185 3.Patents in Force 2020 / Statistical country profiles / World Intellectual Property Organization *109 4. QS World University Rankings 2022 *97 5. SCImago Country Rankings (1996-2020) / Country rankings / SCImago, (n.d.). SIR-SCImago Journal & Country Rank [Portal]. Retrieved 17 Nov 2021 *240 6. Internet users in 2018 / The World Factbook / Central Intelligence Agency *229 7. Internet users in 2018 (% Population) / The World Factbook / Central Intelligence Agency *229 8. Government expenditure on education, total (% of GDP), 2019 / United Nations Educational, Scientific, and Cultural Organization (UNESCO) Institute for Statistics. License: CCBY-4.0 / Data as of September 2021*177 9. Research and development expenditure (% of GDP), 2018 / UNESCO Institute for Statistics. License: CCBY-4.0 / Data *119 10. Scientific and technical journal articles, 2018 / National Science Foundation, Science and Engineering Indicators. License: CCBY-4.0 / Data *197 * Total number of countries participating in ranking | ||
图7. 亚美尼亚的教育和创新指数 |
亚美尼亚在与教育和创新相关的各种国际排名中的排名十分之六低于世界平均水平。亚美尼亚在 QS 世界大学排名 (0.15) 和有效专利排名 (0.16) 中排名最低。这些弱势的部分原因是政府在教育(0.16)和研发(0.29)方面的支出不足。亚美尼亚在教育和创新方面的最强位置是 SCimago 国家排名 (0.63) 和 2011-2020 年专利授权 (0.61)。
| Sources: 1. CO2 total emission by countries 2020 / European Commission / Joint Research Centre (JRC) / Emission Database for Global Atmospheric Research (EDGAR)*208 2. CO2 per capita emission 2020/European Commission/Joint Research Centre (JRC) / Emission Database for Global Atmospheric Research (EDGAR) *208 3. Forest area 2020 (% of land area) / The Global Forest Resources Assessment 2020 / Food and Agriculture Organization of the United Nations *234 4. Forest area change 2010-2020 (1000 ha/year) / The Global Forest Resources Assessment 2020 / Food and Agriculture Organization of the United Nations *234 5. The Environmental Performance Index (EPI) 2020 / Rankings / Yale Center for Environmental Law & Policy / Yale University *180 6. Annual freshwater withdrawals (m3 per capita), 2017 *179 Annual freshwater withdrawals, total (billion m3), 2017 – Food and Agriculture Organization, AQUASTAT data. /License: CC BY-4.0; Population – United Nations, Department of Economic and Social Affairs, Population Division (2019). World Population Prospects 2019, custom data acquired via website. Retrieved 15 November 2021 7. The National Footprint Accounts 2017 (Biocapacity Credit / Deficit) / Global Footprint Network *188 8. Methane emissions (kt of CO2 equivalent), 2018 / Data for up to 1990 are sourced from Carbon Dioxide Information Analysis Center, Environmental Sciences Division, Oak Ridge National Laboratory, Tennessee, United States. Data from 1990 are CAIT data: Climate Watch. 2020. GHG Emissions. Washington, DC: World Resources Institute. Available at: License : Attribution-NonCommercial 4.0 International (CC BY-NC 4.0) *191 9. The Climate Change Performance Index (CCPI) 2022 / Overall Results / Jan Burck, Thea Uhlich, Christoph Bals, Niklas Höhne, Leonardo Nascimento / Germanwatch, NewClimate Institute & Climate Action Network *60 * Total number of countries participating in ranking | ||
图 8. 亚美尼亚的环境指数 |
亚美尼亚拥有丰富的生物多样性,但作为一个山地国家,属于森林数量贫乏的国家。就上图所示的环境问题而言,森林面积(0.29)及其变化(0.34)是最弱的指标之一。森林面积相对较少反映在该国在国家足迹账户(0.40)中低于平均水平,该账户除其他外还计算了生物生产性土地的数量。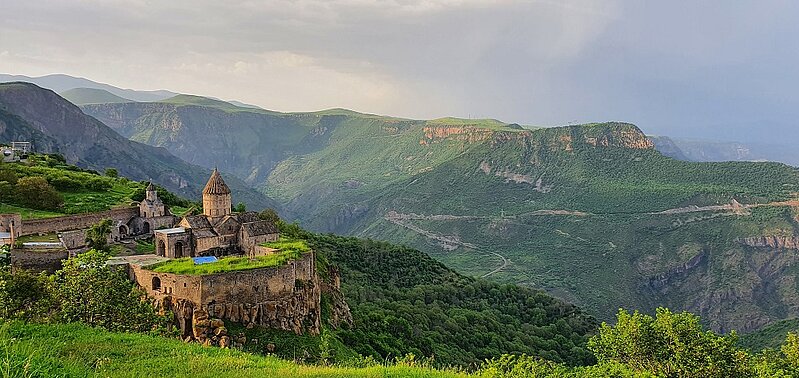
Aerial shot of the Tatev monastery in Tatev, Armenia. Envato Elements. UYHXMRSEPZ
亚美尼亚未纳入2022年气候变化绩效指数。与其他国家相比,亚美尼亚每年的淡水抽取量相当高(0.89)。总体而言,该国的环境状况看起来相当不错,主要是因为该国不生产化石燃料,排放率相对较低。
[1] List of sovereign states and dependencies by area / Wikipedia / en.wikipedia.org/wiki/List_of_sovereign_states_and_dependencies_by_area
[2] List of countries and dependencies by population density / Wikipedia / en.wikipedia.org/wiki/List_of_countries_and_dependencies_by_population_density
[3] Armenia / The world factbook / Library / Central Intelligence Agency / www.cia.gov
[4] GDP, PPP (constant 2011 international $) / World Bank, International Comparison Program database. License: CC BY-4.0 / Data / The World Bank / www.worldbank.org
[5] GDP per capita, PPP (current international $) / World Bank, International Comparison Program database. License: CC BY-4.0 / Data / The World Bank / www.worldbank.org
[6] International Energy Statistic / Geography / U.S. Energy Information Administration / www.eia.gov/beta/international/
[7] 2010 Survey of Energy Resources (PDF) / 2010 / Uploads / World Energy Council / https://www.worldenergy.org/
[8] Solar resource data obtained from the Global Solar Atlas, owned by the World Bank Group and provided by Solargis / Global Solar Atlas / globalsolaratlas.info
[9] Wind Map / Global Wind Atlas 2.0, a free, web-based application developed, owned and operated by the Technical University of Denmark (DTU) in partnership with the World Bank Group, utilizing data provided by Vortex, with funding provided by the Energy Sector Management Assistance Program (ESMAP). For additional information: globalwindatlas.info
[10] Agricultural land (% of land area) /Food and Agriculture Organization, electronic files and web site. License: CC BY-4.0 / Data / The World Bank / www.worldbank.org
[11] Forest area (% of land area) /Food and Agriculture Organization, electronic files and web site. License: CC BY-4.0 / Data / The World Bank / www.worldbank.org
[12] What a Waste 2.0 (PDF) / Resources / The World Bank / www.worldbank.org
[13] BP Statistical Review of World Energy 2020-2022 (PDF) / BP / www.bp.com
[14] Armenia 2022. Energy Policy Review / PDF / https://iea.blob.core.windows.net/assets/8328cc7c-e65e-4df1-a96f-514fdd0ac31e/Armenia2022EnergyPolicyReview.pdf
图表和曲线的来源在图像下方指定。
有关亚美尼亚能源行业的更多信息,请参见此处