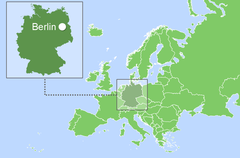

德国,正式名称为德意志联邦共和国,是中欧的一个国家。它的首都是柏林。该国与法国、卢森堡、比利时和荷兰(西边)、丹麦(北边)、奥地利和瑞士(南边)以及波兰和捷克共和国(东边)接壤。该国可通往波罗的海和北海。
| Germany/ the Federal Republic of Germany | ||
|---|---|---|
| Capital: Berlin | Density: 236/km2 | Currency: Euro (€) (EUR) |
| Official languages: German | Life expectancy at birth: 80.94 years | GDP (PPP): $5.537 trillion (2023 est.) |
| National Day: 03 October | Area: 357,600 km2 | GDP - per capita (PPP): $66,037 (2023 est.) |
| Population: 84,482,267 (Q2 2023 est.) | Coastline: 2,389 km | Internet country code: .de |
Source: [1,2,3,4,5]
德国是世界上第 69位大国,根据 2022 年的统计数据,拥有约 8430 万人口。就人口密度而言,该国在 248 个国家中排名世界第 61位[1,2,3]。该国海岸线总长度为2,389公里[3]。政府的政治形式是联邦议会共和制。官方语言是德语。全国分为16个行政州[3]。
| Sources: 1. GDP (purchasing power parity), 2020 est. / The World Factbook/Library/Central Intelligence Agency *228 2. GDP - per capita (PPP), 2020 / The World Factbook/Library/Central Intelligence Agency *229 3. Inflation rate (consumer prices), 2019 est. / The World Factbook/Library/Central Intelligence Agency *228 4. Charges for the use of intellectual property, receipts (BoP, current US$), 2020 / International Monetary Fund, Balance of Payments Statistics Yearbook, and data files. / License: CC BY-4.0 *88 5. The Global Competitiveness Index 2019 / Rankings / Reports / World Economic Forum *141 6. High-technology exports (current US$) 2019-2020 / United Nations, Comtrade database through the WITS platform / License: CCBY-4.0 / Data *134 7. 2021 Index of Economic Freedom / International Economies / The Heritage Foundation *178 8. Reserves of foreign exchange and gold, 2017 est. / The World Factbook / Library / Central Intelligence Agency *195 9. Annual average GDP growth in %, for the last 10 years (2011-2020) / World Bank national accounts data, and OECD National Accounts data files / License: CC BY-4.0 *206 10. Public debt (% of GDP), 2017 est. / The World Factbook / Library / Central Intelligence Agency (from smallest to largest) *210 * Total number of countries participating in ranking 图 1. 德国经济指数 |
德国是欧盟工业品和高科技产品的主要出口国之一,这使其成为欧洲最大的经济体和世界第五大经济体,如图1所示。几乎所有经济指标(不包括平均GDP增长和公共债务),该国的排名都高于世界平均水平,位于图表的前四分之一(即跻身于世界排名前25%的国家之列)。
从 20 世纪 90 年代初期开始,除非 2008 年略有下降,否则该国的购买力平价 GDP 持续增长,无论是总体还是人均 [4,5]。按购买力平价计算的GDP从2017年的4.199万亿美元增加到2020年的4.238美元( 世界第五位)[3] 。该国按购买力平价计算的 GDP 较低(世界排名第26 位),呈现出负面动态:从 2018 年的 53,500 美元下降到 2020 年的 50,900 美元[3]。
德国的通胀水平从2017年的1.5%变为2019年的1.4%[3]。
根据世界经济论坛编制的《2020 年全球竞争力报告》,德国在 141 个参与国家中排名第七,位于欧盟的瑞士和荷兰之后。这一评级反映了该国利用自身资源实现可持续发展的有效性。除了多项经济指标外,该指数还考虑了教育、健康、创新水平等变量。在2019-2020年高新技术产品出口国家名单中,该国仅次于中国,来自 134 个国家/地区。
根据以商业自由、不受政府干预、财产保护和免受腐败为基础的经济自由指数,该国在 2021 年在 178 个参与国家中排名第 29位。
就黄金储备和外汇储备而言,德国在该地区排名第13位,落后于俄罗斯和瑞士。
按过去 10 年(2011-2020 年)平均 GDP 增长率计算,2020 年该国在 206 个国家中排名第 154 位, 落后于瑞士,但领先于荷兰。就公共债务而言,按德国在 2017 年考虑的 210 个国家中排名第 62 位。
包括莱茵集团(RWE)和意昂集团(E.ON)等大公司在内的大量德国能源公司被纳入标普全球普氏能源资讯2021年最大能源公司250强公司评级。德国多家知名能源产品供应商也跻身2021年世界500强,其中包括西门子能源、意昂集团、西门子、巴斯夫、蒂森克虏伯等。罗伯特·博斯.
德国煤炭储量丰富,在这一指标上位居前 25% 的国家之列(图 4)。德国的煤炭储量根据其类型的不同而存在很大差异。因此,根据[6],2019年德国硬煤资源量估计为82,965 Mt,占世界总量的0.5%,而无烟煤和烟煤储量估计仅为12 Mt。德国原生煤炭储量由褐煤组成,根据该国的资源量(36,500 公吨,占世界资源量的 0.8%,居世界第 11 位)和储量(36,100 公吨,占世界储量的 11.4%,居世界第 3位 )均位居世界领先地位。 在世界上)。其他化石资源储量并不大(表1)。
表1. 德国化石能源资源
| Resource/ Explanations | Crude oil* | Natural gas* | Coal* | Shale Gas** | Tight Oil** | Coal mine methane | Oil Shale |
|---|---|---|---|---|---|---|---|
| Value | 115.2(0.01%) | 1(0.01%) | 39 572(3.41%) | 17 | 0.7 | 10.9-72.3 | 2 |
| Unit | million barrels | Tcf | million short tons | Tcf | billion barrels | Bcm | million barrels |
| Year | 2021 | 2020 | 2021 | 2013 | 2013 | 2018 | 2008 |
| Source | [8] | [8] | [8] | [10] | [10] | [7,9] | [11] |
*括号内提供了该国储量占世界总储量的份额
* *未经证实的技术可采储量
按石油和天然气探明储量计算,该国分别 居世界第65位 和第64位[3]。根据2021年数据,以吨油当量计算,煤炭探明储量为99.8%,石油储量为0.1%,天然气为0.1%(图5)。2014-2015年非常规化石资源矩阵看起来有些不同——页岩气占48.8%,干酪根油占33.6%,致密油占10.4%,煤矿瓦斯利用潜力占7.2%(图5)。
根据[3],2018年初,德国石油储量估计为1.296亿桶,根据[6],2019年原油储量为28Mt。2018年初,德国探明天然气储量,根据[3],2019年达到39.5 bcm,根据[6],达到25 bcm。值得注意的是,德国的石油和天然气消耗量大大超过了现有的生产水平。
据英国石油公司[7]估计,2020 年煤炭探明总储量为 359 亿吨,根据美国能源信息管理局[8],2015 年探明煤炭储量为 399.17 亿短吨,与 BGR 2017 年的数据相对应。根据Advanced Energy Technologies公司的计算,根据[9]的甲烷排放量和[7]的煤炭储量的方法,甲烷利用潜力约为10.9-72.3 Bcm。
德国还拥有大量非常规碳氢化合物储量:页岩气 – 17 Tcf、致密油 – 7 亿桶和干酪根油 – 20 亿桶 [10,11]。
德国拥有多种可再生资源用于能源生产。表2列出了一些基本指标的选择。
表2. 德国的可再生能源资源
| Resource/ Explanations | Solar Potential (GHI)* | Wind Potential (50 м)* | Hydro energy Potential** | Bio Potential (agricultural area) | Bio Potential (forest area) | Geothermal Potenial | Municipal Solid Waste |
|---|---|---|---|---|---|---|---|
| Value | 2.8-3.0 | 6.0-7.0 | 20 | 48 | 31.8 | 164 | 628 |
| Unit | kWh/m2/day | m/s | GWh/year | % of land area | % of land area | MWe | kg per person |
| Year | 2018 | 2018 | 2008 | 2018 | 2018 | 2008 | 2020 |
| Source | [12] | [13] | [15] | [16] | [17] | [15] | [18] |
* 适用于该国大部分领土
** 总理论能力
全国大部分地区的全球水平辐射水平为2.8-3.0 kWh/m 2 /天[12]。在该国南部的巴伐利亚州、巴登-符腾堡州和黑森州,这一数字可增加至 3.2 kWh/m 2 /天 [12]。风资源分布情况为:全国大部分地区风速为6.0~7.0 m/s[13];北海沿岸以及该国西北部、东北部波罗的海地区,50米高度处风速超过7.0m/s。北海地区,包括毗邻德国的部分,是世界上风力资源最丰富的地区之一。该地区不少地点,根据长期气象资料显示,即使在海拔10m处,年平均风速也超过7m/s,且风速在运行范围内的总时间风力发电机(3-25 m/s)达到90%。
该国经济可开发的水电容量为 20 TWh/年 [14]。
该国的地热潜力较低,2008 年估计为 164 兆瓦 [15]。尽管如此,德国仍在积极开发地热能。考虑到地热层温度相对较低,采用有机朗肯循环(ORC)二元系统,可以有效利用现有资源。
根据2018年的数据,德国48%的领土被农业用地占据,而在过去的半个世纪中,农业用地的面积一直在稳步减少[16]。2018 年,森林面积略有增加,占该国领土面积的 31.8%,而 1990 年为 32.4% [17]。
德国的城市垃圾产生量(每人628公斤)相当于欧洲高度发达国家的水平(例如瑞士——每人706公斤)[18]。一方面,城市垃圾是回收或能源生产的宝贵原料,在德国得到积极利用,但另一方面,长期分解的物质会严重污染环境。
根据BP《2022年世界能源统计年鉴》,2021年德国一次能源消费总量为12.64艾焦耳,其中约33%为石油,23.4%为天然气,16.8%为煤炭,18%为可再生能源,4.9% – 核能,1.4% – 水力发电 [7]。
2020年期间石油产量几乎保持不变,不超过22.2万桶/日的水平;2020 年为 20.1 万桶/天 [19]。自2007年以来,该国石油消费量呈现下降趋势(图2),尽管2017年略有增长,达到2,45万桶/日的水平,2020年下降至2,149桶/日[19]。2020年原油进口量为166.3万桶/日[3]。
德国天然气产量自2001年以来逐渐下降,2015年达到308 Bcf的水平,是2001年水平的一半,2020年达到179 Bcf [19]。
2001年至2014年间,德国天然气消费量也有所下降,波动较小,未超过3,338 Bcf的水平。从2016年开始,天然气消耗量再次开始上升,2019年达到3,380 Bcf,2020年达到3,091 Bcf [19]。
Source: U.S. Energy Information Administration (Sep 2023) / www.eia.gov
2. 德国化石燃料的生产和消费(煤炭 – 左,天然气 – 中间,石油 – 右)
根据 BP [7], 2021年全国天然气产量45亿立方米,消费量905亿立方米;BGR 发布了 2020 年类似数据。
德国是欧洲最大的天然气消费国;根据[6],2019年该国进口天然气139 bcm [3]; 2019年出口量为724亿立方米。该
国煤炭产量自2001年以来下降,略有波动,不超过2.33亿短吨;2020年为1.93亿短吨。煤炭消费量不超过2.76亿短吨,2020年为1.51亿短吨[19]。
根据 BP 2020 年的报告,煤炭产量为 0.98 艾焦耳,而消耗量估计为 1.84 艾焦耳[7]。根据德国联邦地质局(BGR)的数据,2020 年该国进口了约 3200 万吨煤炭,主要来自俄罗斯、美国和澳大利亚[20]。
近年来,德国一直积极利用可再生能源发电(图3)。
据美国能源信息署统计,2020年,美国发电量为545.20太瓦时,其中化石燃料占40.7%,可再生能源占44%,核能占11.2%,水电占4.1%(图6)。
据德国统计机构统计,2021年发电量约为5180亿千瓦时,其中化石燃料(包括核能)占57.6%;而可再生能源,其中水电占42.4%[21]。
Sources: U.S. Energy Information Administration (Sep 2023) / www.eia.gov | ||
图 3. 德国的发电量 |
2018年1月1日,德国发生了一件重要的历史事件——95%的电力消耗来自可再生能源,主要来自风能和太阳能。预计2018年德国通过可再生能源提供的电网电力将首次超过煤炭。2021年,可再生能源在发电中的占比下降,煤炭成为2021年德国发电最主要的能源,较2020年呈现24.9%的高增长。2021年煤电占德国发电量的30.2%根据德国统计机构的数据,向电网供应的总电量(2020 年为 24.8%)。德国在能源指数对比图中的位置如图4所示。
| Sources: 1. Crude oil proved reserves, 2021 / International Energy Statistic/Geography / U.S. Energy Information Administration (Nov 2021)*98 2. Natural gas proved reserves 2021 / International Energy Statistic / Geography / U.S. Energy Information Administration (Nov 2021) *99 3. Total recoverable coal reserves 2019 / International Energy Statistic / Geography / U.S. Energy Information Administration (Nov 2021) *81 4. Combination production-consumption for Crude oil 2018 / International Energy Statistic / Geography / U.S. Energy Information Administration (Nov 2021) *219 5. Combination production-consumption for Natural gas 2019 / International Energy Statistic / Geography / U.S. Energy Information Administration (Nov 2021) *123 6. Combination production-consumption for Coal 2019 / International Energy Statistic / Geography / U.S. Energy Information Administration (Nov 2021) *128 7. Electricity – from other renewable sources (% of total installed capacity), 2017 est. / The World Factbook / Library / Central Intelligence Agency *170 8. GDP per unit of energy use (PPP per unit of oil equivalent), 2020 *66 Primary energy consumption - BP Statistical Review of World Energy 2021/BP;GDP (purchasing power parity) - The World Factbook/Library/Central Intelligence Agency 9. Energy use (primary energy use of oil equivalent per capita) 2020 *127 Primary energy consumption – BP Statistical Review of World Energy 2021; Population - United Nations, Department of Economic and Social Affairs, Population Division (2019). World Population Prospects 2019, custom data acquired via website. Retrieved 15 November 2021*66 10. The Global Energy Architecture Performance Index Report (EAPI) 2017 / Rankings / Reports / World Economic Forum 11. Electric power consumption (kWh per capita), 2016 *217 Electricity Consumption - The World Factbook / Library / Central Intelligence Agency; Population - United Nations, Department of Economic and Social Affairs, Population Division (2019). World Population Prospects 2019, custom data acquired via website. Retrieved 15 November 2021 12. Combination of electricity production-consumption (kWh)/The World Factbook/Library/Central Intelligence Agency *216 * Total number of countries participating in ranking 图 4. 德国能源指数 |
从化石燃料的生产/消费比率(从高到低)以及所有主要资源成分(石油、天然气和煤炭)来看,德国在各国中均垫底。与此同时,就煤炭储量而言,该国的地位看起来很强大——跻身世界前25%。
在显示可再生能源发电水平(不包括水力发电)的国家名单中,2017 年德国在213 个入选国家中排名第三,仅次于丹麦。
在基于经济增长水平、环境安全、能源获取和能源独立程度的2017年能源架构绩效指数中,德国排名第19位。值得注意的是,在过去 8 年里,该国的排名上升了 4 次。
德国在 2020 年单位能源消耗 GDP 等指标上位居前四分之一——第 15位;同样,在人均能源使用量等指标上,该国排名第23位。
按人均用电量计算,该国位居 世界第39位。 根据电力生产-消费指标综合排名,德国在 216 个国家中排名第七。
图 5 显示了德国化石燃料行业最大基础设施项目分布的领土地图。
如前所述,煤炭储量占常规探明储量的99.8%(图5)。
图5. 德国化石燃料行业基础设施
德国最后一个活跃的煤矿 Ruhr Prosper-Haniel 位于该国西部,产量约为 250 万吨 [22]。 2018 年 12 月该矿的关闭标志着德国煤炭开采的结束[74]。
最大的油田是 Mittelplate,2017 年每天生产约 2,700 吨石油[23]。 德国炼油厂装机容量是欧洲最大的炼油厂之一,2016 年达到 2,188,000 桶/天 [24]。 壳牌德国莱茵兰 Godorf & Wesseling 拥有的最大炼油厂位于科隆,装机容量为 340,000 桶/天 [25]。
德国主要石油码头之一是 HES Wilhelmshaven,拥有 130 万立方米的油库。 罗斯托克是最大的石油产品仓库,容量为70万立方米[26,27]。 原油和石油产品的运输通过管道进行,长度分别为2826公里和4479公里(图5)。
最大的天然气矿床位于该国中部地区,该国北部有天然气水合物赋存(图5)。 德国天然气系统由40多个储气库和30多个气体压缩机站组成[28,29]。 天然气通过总长度为 26,985 公里的管道网络在国内运输(图 5)。
20世纪初,德国在各种煤炭燃料的开发和生产方面处于领先地位。 尽管这一方向如今并不流行,但德国仍然拥有多家合成燃料企业,特别是卡尔斯鲁厄二甲醚(DME)工厂,每年可利用废物生产约 608 吨生物质,以及韦瑟林甲醇制汽油工厂 (MTG)[30,31]。
图6显示了德国最大的发电基础设施分布的领土地图。
图 6. 德国的发电量
根据欧盟委员会对欧盟28国能源统计数据,2020年德国化石燃料发电占比约为40.27%(图6)。
该国拥有大量碳氢化合物发电站,其中包括 2 座石油电站、11 座天然气电站、13 座煤炭电站、7 座核电站和 6 座容量超过 400 MW 的联合电站(图 6)。
德国最大的发电厂有: Emsland (Lingen) 天然气发电厂,容量为 1,837 MW,Ingolstadt 石油发电厂,容量为 772 MW [32,33],Neurath 燃煤发电厂,容量为 4,400 MW,Gersteinwerk 容量为2,278 MW的联合电厂和容量为2,572 MW的Gundremmingen(B和C机组)核电厂[34,35,36,37]。 德国水电占发电量的4.1%,以抽水蓄能电站和大小水电站为代表(图6)。
最大的泵站是 Goldisthal,装机容量为 1060 MW。 主要水力发电厂是伊菲茨海姆莱茵 (Iffezheim Rhein),装机容量为 148 MW [38,39]。 2016年德国有小水电站7000多座,总装机容量1730.8兆瓦[40]。
图7显示了德国用于生产可再生能源的主要基础设施。 如上所述,德国可再生能源占发电量的 44%。 因此,2020 年不包括水力发电的可再生能源发电总量为 240.10 太瓦时(图 7)。 在风力活动频繁的地区,有超过20个海上和陆上风电场,每个风电场的容量都超过100兆瓦。 2021年德国风电总装机容量约为57.5吉瓦[41]。
图 7. 德国的可再生能源:太阳能、风能、地热能和氢能
最大的陆上风电场是Stößen-Teuchern,装机容量为177.1 MW [42],最大的海上风电场是Borkum Riffgrund 1-2,总装机容量为762 MW [43,44]。 大多数最大的风电场都位于德国北部的近海地区。 就总装机容量而言,德国截至2021年底位居世界第三(64,542兆瓦),仅次于中国和美国[45]。
德国拥有最大的风力涡轮机制造公司,包括Enercon、Nordex SE、Senvion、Vensys、Vestas、GE Renewable Energy、Eno Energy Group 和Siemens Wind Power(图7)。
如前所述,该国部分地区的全球水平太阳辐射水平可达3.2 kWh/m2,这足以用于光伏发电和热能生产[12]。 因此,存在大量太阳能设施,包括光伏电站和太阳能区域供热电站。 德国的许多研究机构正在积极探索聚光太阳能的各种方案。 还有一种实验性 CSP 塔式 - Jülich (1.5 MW) [46]。 德国约20%的可再生能源电力是由光伏电站生产的。 该类型最大的电站是 Meuro,容量为 166 MW [47]。 太阳能还用于区域供热,例如森夫滕贝格太阳能供热厂,提供约 5.8 兆瓦的太阳能[48]。 截至2021年底,德国光伏发电装机容量超过59.2吉瓦(位居世界第五,仅次于中国、美国、日本和印度)。 2021年新增产能5.3吉瓦[49]。 在德国,特别是在该国南部,拥有用于开发地热技术的自然资源。 尽管地热资源指标较低,但地热能开发却蓬勃发展。 为此,正在使用二进制技术,包括 Calina cicle。 巴伐利亚州有 9 个地热站,还有一个正在建设中。 最大的电站之一是 Dürrnhaar,容量为 7 MW [50]。
2010年,德国地热能装机容量仅为6.6兆瓦,但到2015年已增至27兆瓦,2020年增至350兆瓦。该国制定了发展地热能的国家计划,包括对项目的财政支持、 以及优惠关税[51,75]。
德国积极开发氢作为汽车能源。 截至2019年3月,全国约有57个正在运营的加氢站(图7)。 还有几家生产氢气的工厂,其中最大的一家位于因戈尔施塔特,由林德管理,装机容量为 97,917 标准立方米/小时 [52]。 该国还有多个电解、电制气等工厂,其中最大的是 ITM Power PLC/Shell Rheinland Refinery,装机容量为 10 MW [53]。 多个地下储氢设施正在建设中。 氢气通过总长 377 公里的三条管道网络运输(图 7)。
图 8 显示了德国主要的能源生产生物能源设施。
生物能源是德国快速发展的领域,2019年生物质发电量约为50.22太瓦时(20.7%)(图7)。
该国拥有生物质和城市垃圾加工厂; 沼气、生物柴油、生物乙醇、颗粒和垃圾填埋气生产(图8)。 图 8. 德国的可再生能源:生物能源
在德国,利用生物质生产能源以及生物燃料的工厂正在变得越来越普遍。 Zellstoff Stendal 是最大的 Arneburg 生物质发电厂的运营商,装机容量为 135 MW [54]。 德国生物质燃料生产领域的主要企业:法兰克福、嘉吉,具备年产30万吨生物柴油的能力[55]。
德国是世界领先的沼气生产国之一,仅次于中国,截至2015年底,德国沼气产能占欧洲总产能的62%。 截至2015年底,农业领域共有沼气厂8000余座,污水处理厂约1400座,垃圾填埋气处理厂400座,分布在全国各地[56,57]。
巴伐利亚州约有 2,360 个沼气厂; 最大的发电厂之一是位于维廷的发电厂,装机容量为 8.5 兆瓦 [58]。 2016年德国沼气厂总装机容量约为5,104兆瓦,约占全球总装机容量的32%[59]。 德国积极从事生物乙醇生产,由 Crop Energies 管理的 Zeitz 是欧洲最大的生物乙醇生产公司之一,每年生产 400,000 立方米的生物燃料[60]。 第二代纤维素生物乙醇是在该国最大的设施——Sunliquid 项目(Straubing)生物乙醇发电厂生产的,该发电厂的装机容量为 1000 吨/年 [61]。
其他著名设施包括:Rüdersdorf Zement 生物垃圾发电厂生物质气化,装机容量为 100 MW [62]; Wismar,每年生产约 256,000 吨颗粒[63]; 最大的快速热解厂 Lüneburg,装机容量为 150 kg/h [64]。
利用城市垃圾发电的领先者是科隆的一家企业,每年能够处理约76万吨垃圾[65]。 在德国,垃圾填埋气也用于发电; 北莱茵威斯特伐利亚地区在此类电站的装机容量方面处于领先地位 - 55.3 MW(图 8)。 奥伯豪森的 Btl-FT 试点工厂每年能够加工约 3 吨生物燃料和 2 吨液态碳氢化合物(柴油型碳氢化合物)[66]。
根据多项欧洲协议,德国有义务将二氧化碳排放量减少40%。 德国能源转型(能源计划)2017-2022年主要旨在减少核能和化石能源在发电中的份额[67]。 为了实现这一目标,核电站将退役。 2017年底,贡德雷明根核电站B区停止运行,2019年底,菲利普斯堡2号核电站也被关闭。 格罗恩德核电站、贡德雷明根 C 核电站和博克多夫核电站将于 2021 年底关闭。 原计划到 2022 年底关闭伊萨尔 2 号、埃姆斯兰和内卡韦斯特海姆 2 号三座小型核电站,但乌克兰战争在德国引发了关于延长剩余核电站运营的辩论。 值得注意的是,2020年核电提供了约13%的电力[67,68,76]。
安吉拉·默克尔政府推出了新的电力法,其中包括需求低迷时的特殊价格信号,并支持地下输电线的建设[68]。 从长远来看,该国的目标是到2030年将温室气体排放量比1990年的水平减少55%,并将可再生能源在电力生产中的份额提高到50%[68]。 德国将 8 个总装机容量为 2.7 吉瓦的褐煤电站移至“冷容量储备”制度,该制度可在电力短缺时重新启动[68]。
2017年,在发电量约占全国三分之一的北莱茵威斯特伐利亚地区,决定将Prosper-Haniel煤矿改造为200兆瓦抽水蓄能电站,为40万户家庭供电。 未来其他煤站可能会开展类似的活动[69]。
2016年,全国新建沼气厂205座,总容量45兆瓦。 2017年计划新增车站143个投入运营。 由于旧电站的现代化改造,还将新增 239 兆瓦。 还应该补充的是,沼气厂减少二氧化碳排放总量2000万吨。 2020年,德国与法国和瑞典一起成为生物热利用量排名前三位的欧盟国家之一[49,70]。
2017年1月,西门子及其合作伙伴宣布建设全球最大的氢电解设施。 美因茨工厂产生的氢气可用于燃料电池动力车辆、工业用途或作为能量存储介质[71]。
反映德国相对于其他国家在教育和创新领域的地位的一组指数如图9所示。根据德国居民在国内外获得的专利数量,该国排名第五 世界第一,欧洲第一。同样,按有效专利数量计算,该国排名 世界第五,这表明该国具有良好的创新条件。
德国在 2021 年全球创新指数纳入考虑的 132 个国家中排名第 10位 (见图)。就政府教育支出占国内生产总值的百分比而言,该国的结果接近世界平均水平—— 在 177 个国家中排名第 66位。尽管如此,仍有 46 所德国大学被列入 QS 世界领先大学排名。还应该指出的是,该国的GDP很高,因此,从绝对值来看,政府在教育方面的支出是巨大的。就研发公共支出占GDP的百分比而言,德国排名第九,落后于瑞典、芬兰、丹麦和瑞士。德国在专业科技期刊的出版物数量和专利活动方面处于领先地位。德国在 Scimago 排名中在 240 个参与国家中排名第4 ,在《科学技术期刊》活动中 在 197 个国家中排名第4。就互联网用户数量而言,该国也是该地区的领先者之一。
德国大学,如柏林自由大学、拜罗伊特大学、卡尔斯鲁厄理工学院、蒂宾根大学、慕尼黑工业大学和柏林洪堡大学等,培养包括环境地球在内的各个能源领域的专家研究、地质科学和环境水文学、环境系统和可持续性 - 监测、建模和管理等。
合成燃料生产专利领域的知名德国公司包括 Uhde GmbH、Lurqi GmbH、Linde AG、Thyssenkrupp Uhde Gmbh、BASF、SE 。该领域的研究和开发由卡尔斯鲁厄理工学院 (KIT)、弗莱贝格工业大学、德国地质研究中心 GFZ 进行。在非常规石油领域,西门子股份公司、Wintershall Holding GmbH、巴斯夫、SE、蒂森克虏伯 Fördertechnik Gmbh 在专利活动方面排名突出。亚琛工业大学、Deutsches GeoForshungsZentrum GFZ 都积极从事这一领域的研究。
| Sources: 1. The Global Innovation Index 2021, Rankings / Knowledge / World Intellectual Property Organization / Cornell University, INSEAD, and WIPO (2021): Energizing the World with Innovation. Ithaca, Fontainebleau, and Geneva *132 2. Patent Grants 2011-2020, resident & abroad / Statistical country profiles / World Intellectual Property Organization *185 3.Patents in Force 2020 / Statistical country profiles / World Intellectual Property Organization *109 4. QS World University Rankings 2022 *97 5. SCImago Country Rankings (1996-2020) / Country rankings / SCImago, (n.d.). SIR-SCImago Journal & Country Rank [Portal]. Retrieved 17 Nov 2021 *240 6. Internet users in 2018 / The World Factbook / Central Intelligence Agency *229 7. Internet users in 2018 (% Population) / The World Factbook / Central Intelligence Agency *229 8. Government expenditure on education, total (% of GDP), 2019 / United Nations Educational, Scientific, and Cultural Organization (UNESCO) Institute for Statistics. License: CCBY-4.0 / Data as of September 2021*177 9. Research and development expenditure (% of GDP), 2018 / UNESCO Institute for Statistics. License: CCBY-4.0 / Data *119 10. Scientific and technical journal articles, 2018 / National Science Foundation, Science and Engineering Indicators. License: CCBY-4.0 / Data *197 * Total number of countries participating in ranking 图 9. 德国教育和创新指数 |
在天然气水合物领域,德国GeoForshungsZentrum GFZ、卡尔斯鲁厄理工学院(KIT)均拥有重要专利;不莱梅大学、亥姆霍兹基尔海洋研究中心 (GEOMAR)、德国地理研究中心 GFZ 和莱布尼茨海洋科学研究所 (IMF-GEOMAR) 正在该领域开展著名研究。德国公司为其发明申请专利的另一个领域是煤层气,其中领先者是西门子公司和林德公司;亚琛工业大学和克劳斯塔尔工业大学正在开展这一领域的研究。
在伴生气领域,值得一提的是巴斯夫、SE、蒂森克虏伯有限公司、林德公司。该领域的领先研究机构包括亚琛工业大学和弗莱贝格工业大学。
在低渗透油藏油气开采领域,巴斯夫、SE、Ashland-Sudchemie-Kemfest GmbH、Wintershall Holding GmbH 以及以下研究机构积极从事研究:Deutsches GeoForshungsZentrum GFZ、亚琛工业大学、克劳斯塔尔工业大学。
生物能源领域领先的专利持有者包括Energy Technologies GmbH & Co.KG、DGE GmbH、Linde AG、BASF、SE、Unde GmbH。卡尔斯鲁厄理工学院(KIT)、亚琛工业大学正在开展这一领域的研究。
许多德国公司在可再生能源生产领域申请了技术解决方案专利。太阳能领域:Siemens AG、Deutsches Zentrum für Luft- und Raumfahrt (DLR)、Fraunhofer-Gesellschaft zur Förderung der Angewandten Forschung eV、Schott AG。该领域的领先研究机构包括德国航空航天中心 (DLR)、弗劳恩霍夫太阳能系统研究所 (ISE)、德国航空航天中心 (DLR) 技术热力学研究所、德国航空航天中心 (DLR)。
西门子股份公司、Wobben Properties GmbH、Repower Systems AG、Senvion SA NORDEX ENERGY GMBH 在风电领域拥有最多的专利;该领域的研究由奥尔登堡卡尔·冯·奥西茨基大学、弗劳恩霍夫风能和能源系统技术研究所、慕尼黑工业大学和斯图加特大学正在进行。
图 10 中的环境指数图暗示了德国模糊的环境状况。
首先,该国的总体CO 2 排放量和人均排放量相对较高。2020 年,煤炭开采和加工产生的 CO 2 排放量为 199 公吨,高于波兰等国的 161 公吨[73]。
| Sources: 1. CO2 total emission by countries 2020 / European Commission / Joint Research Centre (JRC) / Emission Database for Global Atmospheric Research (EDGAR)*208 2. CO2 per capita emission 2020/European Commission/Joint Research Centre (JRC) / Emission Database for Global Atmospheric Research (EDGAR) *208 3. Forest area 2020 (% of land area) / The Global Forest Resources Assessment 2020 / Food and Agriculture Organization of the United Nations *234 4. Forest area change 2010-2020 (1000 ha/year) / The Global Forest Resources Assessment 2020 / Food and Agriculture Organization of the United Nations *234 5. The Environmental Performance Index (EPI) 2020 / Rankings / Yale Center for Environmental Law & Policy / Yale University *180 6. Annual freshwater withdrawals (m3 per capita), 2017 *179 Annual freshwater withdrawals, total (billion m3), 2017 – Food and Agriculture Organization, AQUASTAT data. /License: CC BY-4.0; Population – United Nations, Department of Economic and Social Affairs, Population Division (2019). World Population Prospects 2019, custom data acquired via website. Retrieved 15 November 2021 7. The National Footprint Accounts 2017 (Biocapacity Credit / Deficit) / Global Footprint Network *188 8. Methane emissions (kt of CO2 equivalent), 2018 / Data for up to 1990 are sourced from Carbon Dioxide Information Analysis Center, Environmental Sciences Division, Oak Ridge National Laboratory, Tennessee, United States. Data from 1990 are CAIT data: Climate Watch. 2020. GHG Emissions. Washington, DC: World Resources Institute. Available at: License : Attribution-NonCommercial 4.0 International (CC BY-NC 4.0) *191 9. The Climate Change Performance Index (CCPI) 2022 / Overall Results / Jan Burck, Thea Uhlich, Christoph Bals, Niklas Höhne, Leonardo Nascimento / Germanwatch, NewClimate Institute & Climate Action Network *60 * Total number of countries participating in ranking 图10. 德国环境指数 |
平均而言,减轻此类排放后果的成本使德国花费超过 40.96 亿欧元(健康成本、污染成本)。相比之下,在波兰,这一数字为 45.19 亿欧元[72]。还需要注意的是,德国的甲烷排放量相对较高。根据 2022 年气候变化绩效指数 (CCPI) ,德国在 61 个国家中排名第 10,其排放量占全球与能源相关的 CO 2排放量的 90% 以上。 其排放量被归类为“中等”。
该评级的编制者强调,该国是世界上最大的褐煤消费国,温室气体排放量很高。
就森林面积占全国的百分比而言,2020年德国位居世界第111位;然而,2010年至2020年期间出现了重新造林的趋势,根据该指标,该国 在世界上排名第57位。
2020 年环境绩效指数排名 (EPI) 对德国的高度评价使这一情况更加明朗,该排名主要侧重于评估各国政府的环境绩效。该国在 180 个国家中排名第10 ,落后于丹麦、英国、挪威和法国。
然而,根据环境脆弱性指数,该指数基于长期观察和 50 项指标,包括变化的气候特征或水资源质量、废物量、石油泄漏和其他有害物质等。德国为 190在 234 个国家中排名第 3 ,并被描述为“高度脆弱”。生态足迹图集评级加剧了总体负面情况,根据该评级,德国是众多生态债务国之一。
[1] List of sovereign states and dependencies by area / Wikipedia / en.wikipedia.org/wiki/List_of_sovereign_states_and_dependencies_by_area
[2] List of countries and dependencies by population density / Wikipedia / en.wikipedia.org/wiki/List_of_countries_and_dependencies_by_population_density
[3] Germany / The world factbook / Library / Central Intelligence Agency / www.cia.gov
[4] GDP, PPP (constant 2011 international $) / World Bank, International Comparison Program database. License: CC BY-4.0 / Data / The World Bank / www.worldbank.org
[5] GDP per capita, PPP (current international $)/ World Bank, International Comparison Program database. License: CC BY-4.0 / Data / The World Bank / www.worldbank.org
[6] BGR Energy Study 2019 / www.bgr.bund.de
[7] BP Statistical Review of World Energy 2022 (PDF) / BP / www.bp.com
[8] International Energy Statistic / Geography / U.S. Energy Information Administration / www.eia.gov/beta/international/
[9] 2006 IPCC Guidelines for National Greenhouse Gas Inventories, Volume 2, Energy, Fugitive Emissions (PDF) / The Intergovernmental Panel on Climate Change (IPCC) / www.ipcc-nggip.iges.or.jp
[10] World Shale Resource Assessments (PDF)/ U.S. Energy Information Administration (11/28/2018 )/ www.eia.gov
[11] 2010 Survey of Energy Resources (PDF) / World Energy Council / www.worldenergy.org
[12] Solar resource data obtained from the Global Solar Atlas, owned by the World Bank Group and provided by Solargis / Global Solar Athlas / globalsolaratlas.info
[13] Wind Map / Global Wind Atlas 2.0, a free, web-based application developed, owned and operated by the Technical University of Denmark (DTU) in partnership with the World Bank Group, utilizing data provided by Vortex, with funding provided by the Energy Sector Management Assistance Program (ESMAP). For additional information: globalwindatlas.info
[14] Hydro (PDF) / World Energy Council / www.worldenergy.org
[15] 2016 Annual U.S. & Global Geothermal Power Production Report (PDF) / Geothermal Energy Association / geo-energy.org
[16] Agricultural land (% of land area) / Food and Agriculture Organization, electronic files and web site. Li-cense: CC BY-4.0 / Data / The World Bank / www.worldbank.org
[17] Forest area (% of land area) /Food and Agriculture Organization, electronic files and web site. License: CC BY-4.0 / Data / The World Bank / www.worldbank.org
[18] Municipal waste statistics Updated / Full list / Statistics Explained / Eurostat / ec.europa.eu
[19] International Energy Statistic / Geography / U.S. Energy Information Administration (Dec 2021) / www.eia.gov/beta/international/
[20] Hard Coal Imports / Statistishes Bundesamt / www.destatis.de
[21] Gross electricity production in 2017/ Statistishes Bundesamt / www.destatis.de
[22] Bergwerk / Prosper-Haniel / RAG / www.rag.de
[23] Mittelplate Redevelopment / Offshore technology / www.offshore-technology.com
[24] OPEC Annual Statistical Bulletin 2017 (PDF) / Organization of the Petroleum Exporting Countries (OPEC) / www.opec.org/opec_web/en/
[25] Rheinland Werk Godorf Cologne Refinery / A Barrel Full / abarrelfull.wikidot.com
[26] HES Wilhelmshaven terminal started LPG storage operations / HES international / www.hesinternational.eu
[27] Oils and fuels / Services / EUROPORTS Germany / www.portofrostock.de
[28] Compressor stations / Market Area Cooperation / 2011 Assessment of the Long-Term Transmission Capa-city Requirements / GRTgaz Deutschland / www.grtgaz-deutschland.de
[29] Germany Natural Gas Storage (50 existing gas storage) / Gas Infrastructure Europe (GIE) / www.gie.eu
[30] Karlsruhe, KIT Demo DME Plant / Bioenergy 2020 / demoplants.bioenergy2020.eu
[31] Bio/synthetic gasoline / Bio-hydrocarbons for gasoline / Gasification Syngas / The Technology Collabo-ration Programme on Advanced Motor Fuels (AMF TCP) functions within a framework created by the Internati-onal Energy Agency (IEA) / www.iea-amf.org
[32] Emsland Power Plant / RWE Power AG / www.group.rwe
[33] Ingolstadt Oil Power Plant / Industry About / www.industryabout.com
[34] Neurath Power Station / Wikipedia / en.wikipedia.org/wiki/Neurath_Power_Station
[35] Gersteinwerk Coal Power Plant / Industry About / www.industryabout.com
[36] Gersteinwerk Gas Power Plant / Industry About / www.industryabout.com
[37] Gundremmingen Nuclear Power Plant / Wikipedia / en.wikipedia.org/wiki/Gundremmingen_Nuclear_Power_Plant
[38] Goldisthal Pumped Storage Power Station / DOE Global Energy Storage Database / www.energystorageexchange.org
[39] Rheinkraftwerk Iffezheim / Wikipedia / de.wikipedia.org/wiki/Rheinkraftwerk_Iffezheim
[40] World Small Hydropower Development Report 2016 – Germany (PDF)/ Small Hydropower World / www.smallhydroworld.org
[41] Global Wind Report 2022 (PDF) / Wikipedia GWEC / https://gwec.net/
[42] Windpark Stößen-Teuchern / Wikipedia / de.wikipedia.org/wiki/Windpark_St%C3%B6%C3%9Fen-Teuchern
[43] Borkum Riffgrund 1 / 4c Offshore / www.4coffshore.com
[44] Borkum Riffgrund 2 / 4c Offshore / www.4coffshore.com
[45] Wind Power Capacity Reaches 539 GW, 52,6 GW added in 2017 / World Wind Energy Association / wwindea.org
[46] Jülich CSP Power Tower with storage type plant / National Renewable Energy Laboratory: Concentrating Solar Power Research / www.nrel.gov
[47] Best Solar Project: GP Joule and saferay's Solarpark Meuro in Germany / Power Engineering / www.power-eng.com/index.html
[48] Senftenberg SDH plant / Solar Thermal World / www.solarthermalworld.org
[49] Renewables 2022 Global Status Report (PDF) / REN 21 / www.ren21.net
[50] Tiefe Geothermieprojekte in Deutschland (PDF) / GtV Bundesverband Geothermie / www.geothermie.de
[51] Geothermal Power Generation in the World 2010 - 2014 Update Report (PDF)/ Ruggero Bertani / Stand-ford University / pangea.stanford.edu
[52] Merchant Hydrogen Production Capacities in Europe / Hydrogen Tools / h2tools.org
[53] REFHYNE / refhyne.eu
[54] Vortrag zelltoff Stendal / Energie metropole Leipzig / energiemetropole-leipzig.de
[55] Biodiesel 2016/2017: Sachstandsbericht und Perspektive – Auszug aus dem UFOP-Jahresbericht (PDF) / Deutschland / UFOP / www.ufop.de
[56] EBA Biomethane & Biogas Report 2015 / European Biogas Association / european-biogas.eu
[57] IEA Bioenergy Task 37: Country Reports Summary 2015 / The European Commission's science and know-ledge service / ec.europa.eu/jrc/en/publication/iea-bioenergy-task-37-country-reports-summary-2015
[58] 8.5 megawatt biogas plant in Germany now operational / Bioenergy insight / www.bioenergy-news.com
[59] Renewable Capacity Statistics 2017(PDF) / IRENA / www.irena.org
[60] Zeitz / Сrop Energies / www.cropenergies.com/de/Home/
[61] Bioethanolwerke in Deutchland jahreskapazitat in Tonnen / Bundesverband der deutschen Bioethanol-wirtschaft e.V. / www.bdbe.de
[62] Waste gasification overview; two-stage incineration and "true" gasification (PDF)/ Lars Waldheim / IEA Bioenergy Task 33 Workshop Alkmaar, The Netherlands / 2018-05-08 / IEA Bioenergy Task / www.ieatask33.org
[63] Wismar / Germany / German Pellets / www.german-pellets.de
[64] Germany / Pyrolysis Demoplant Data-base / IEA Bioenergy Task 34: Direct Thermochemical Liquefaction / demoplants21.bioenergy2020.eu
[65] Köln incineration plant / Industry About / www.industryabout.com
[66] Demoplants Bioenergy / demoplants.bioenergy2020.eu
[67] Energiewende im Überblick / Die Bundesregierung / www.bundesregierung.de/breg-de
[68] The future of Germany’s Energiewende / Energy Transition / energytransition.org
[69] Coal mine to be transformed into 200 MW pumped hydro plant / Hydro World.com / www.hydroworld.com/index.html
[70] Biogas industry saving 20 million tonnes of CO2 emissions / Bioenergy Insight / www.bioenergy-news.com
[71] Revisited-World Largest Hydrogen Electrolysis Facility / FuelCellsWorks / fuelcellsworks.com
[72] Coal is a climate problem (PDF) / European Coal Map / www.coalmap.eu
[73] Carbon dioxide emissions from coal use / Statista / www.statista.com
[74] Bergwerk Prosper-Haniel / Wikipedia / de.wikipedia.org
[75] 2020 Germany Country Report (PDF) / May 2021 / IEA Geothermal / www.iea.org/reports/geothermal-power
[76] Bund rückt von striktem Nein zu AKW-Laufzeit-Verlängerung ab / 18 July 2022 / WirtschaftsWoche/ www.wiwo.de
图表和曲线的来源在图像下方指定。
有关德国能源行业的更多信息,请参见此处