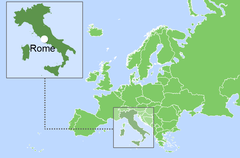
意大利,正式名称为意大利共和国,是南欧的一个国家。它的首都是罗马。该国与法国(西北部)、瑞士和奥地利(北部)、斯洛文尼亚(东北部)接壤,并且与梵蒂冈和圣马力诺有内部边界。意大利可以通往地中海及其周边海域——利古里亚海、第勒尼安海、爱奥尼亚海和亚得里亚海。意大利是世界上第 71大国家,截至 2018 年,人口约为 6100 万。就人口密度而言,该国在 248 个国家中排名世界第 72位[1,2,3]。该国海岸线总长度为7600公里[3]。意大利是议会制共和国,官方语言是意大利语。全国行政地图分为15个地区[3]。
| Italy / Italian Republic | ||
|---|---|---|
| Capital: Rome | Density: 201.3/km2 | Currency: Euro (€) (EUR) |
| Official languages: Italian | Life expectancy at birth: 82.34 years | GDP (PPP): $3.193 trillion (2023 est.) |
| National Day: 2 June | Area: 301,340 km2 | GDP - per capita (PPP): $54,258 (2023 est.) |
| Population: 58,853,482 (2022 est.) | Coastline: 7,900 km | Internet country code: .it |
Source: [1,2,3,4,5]
| Sources: 1. GDP (purchasing power parity), 2020 est. / The World Factbook/Library/Central Intelligence Agency *228 2. GDP - per capita (PPP), 2020 / The World Factbook/Library/Central Intelligence Agency *229 3. Inflation rate (consumer prices), 2019 est. / The World Factbook/Library/Central Intelligence Agency *228 4. Charges for the use of intellectual property, receipts (BoP, current US$), 2020 / International Monetary Fund, Balance of Payments Statistics Yearbook, and data files. / License: CC BY-4.0 *88 5. The Global Competitiveness Index 2019 / Rankings / Reports / World Economic Forum *141 6. High-technology exports (current US$) 2019-2020 / United Nations, Comtrade database through the WITS platform / License: CCBY-4.0 / Data *134 7. 2021 Index of Economic Freedom / International Economies / The Heritage Foundation *178 8. Reserves of foreign exchange and gold, 2017 est. / The World Factbook / Library / Central Intelligence Agency *195 9. Annual average GDP growth in %, for the last 10 years (2011-2020) / World Bank national accounts data, and OECD National Accounts data files / License: CC BY-4.0 *206 10. Public debt (% of GDP), 2017 est. / The World Factbook / Library / Central Intelligence Agency (from smallest to largest) *210 * Total number of countries participating in ranking 图 1. 意大利经济指数 |
从 1990 年代初到 2008 年,该国按购买力平价计算的 GDP 经历了稳定增长,随后有所下降,但自 2013 年以来表现出稳定增长,并于 2019 年达到 2.67 万亿美元(全球第 12位)[3,4 ]。2020 年,意大利的人均 GDP 位列第 45 位,并且也一直表现出积极的动态:从 2015 年的 37,200 美元增至 2020 年的 39,000 美元[3] 。
2016年意大利的通胀处于负值区域,但到2019年从-0.1%变为0.6%[3]。2020年知识产权使用费用为4.2万亿美元(全球第13位)。
根据世界经济论坛发布的《2019 年全球竞争力报告》,意大利在 141 个参与国家中排名第 30位。该评级衡量国家利用自身资源实现可持续发展的有效性。除了多项经济指标外,该指数还考虑了教育、健康、创新水平等变量。在2019-2020年高科技产品出口国家名单中,意大利排名第18位。 134个国家,领先于世界平均水平。根据以商业自由、不受政府干预、财产保护和免于腐败为基础的经济自由指数,2021 年意大利在 178 个参与国家中排名第 68位。就2017年的黄金储备和外汇储备而言,意大利位居世界第17位,与法国和英国并列。根据过去10年(2011-2020年)平均GDP增长率指标,2017年该国在206个国家中排名第189位,落后于葡萄牙。就公共债务占国内生产总值的百分比而言,意大利在 2017 年考虑的 210 个国家中排名第5
意大利实际上没有重要的化石资源,特别是与最大的生产国相比(表 1)。按石油和天然气探明储量计算,该国分别居世界第45位和第65位[3]。以吨油当量计算,根据2018年数据,石油探明储量为56.1%,天然气为34.1%,煤炭为9.8%(图5)。非常规化石资源的矩阵看起来有些不同;干酪根油占99.6%,油砂和超稠油占0.4%(图5)。据[3,6],截至2017年末-2020年,意大利探明石油储量为487.8-6亿桶。根据意大利经济发展部的数据[7],2017年底石油储量估计为5309.9万吨。
表1. 意大利化石能源资源
| Resource / Explanations | Crude oil* | Natural gas* | Coal* | Natural Bitumen** | Tight Oil** | Oil Shale*** |
|---|---|---|---|---|---|---|
| Value | 498(0.03%) | 1.7(0.02%) | 19(0.002%) | 210 | 90 | 73 000 |
| Unit | million barrels | Tcf | million short tons | million barrels | million barrels | million barrels |
| Year | 2021 | 2020 | 2021 | 2008 | 2008 | 2008 |
| Source | [8] | [8] | [8] | [10] | [10] | [10] |
*括号内提供了该国储量占世界总储量的份额
* *储量
***现有资源
截至 2018 年 1 月 1日,意大利已探明的天然气储量估计为 38.11 Bcm [3]。2017年,意大利经济发展部[7]估计该国天然气储量为7824.4万标准立方米。据 BP 称,到 2020 年底天然气储量估计为 1.5 Tcf [6]。值得注意的是,意大利的石油和天然气消耗量超出现有生产水平许多倍。根据美国能源情报署的数据,2019 年煤炭探明总储量估计为 1900 万短吨 [8]。撒丁岛的 Carbosulcis 煤矿拥有约 25 亿吨煤炭,是欧洲最大的煤矿之一 [9]。
意大利还拥有大量干酪根油储量——730亿桶;沥青油——2.1亿桶;截至 2008 年,超重油为 9000 万桶 [10]。意大利由于其地理位置,拥有多种可再生资源用于能源生产。表2列出了此类资源的基本指标选择。
表2. 意大利可再生能源资源
| Resource/ Explanations | Solar Potential (GHI)* | Wind Potential (50 м)* | Hydro energy Potential** | Bio Potential (agricultural area) | Bio Potential (forest area) | Geothermal Potenial | Municipal Solid Waste |
|---|---|---|---|---|---|---|---|
| Value | 3.5-4.4 | <5 | 47 500 | 41.7 | 32.1 | 2 000 | 499 |
| Unit | kWh/m2/day | m/s | GWh/year | % of land area | % of land area | MWe | kg per capita |
| Year | 2018 | 2018 | 2013 | 2018 | 2020 | 2013 | 2018 |
| Source | [11] | [12] | [13] | [14] | [15] | [16] | [17] |
* 国家大部分领土
** 经济可开发能力
全国大部分地区太阳直接辐射水平可达3.5-4.4千瓦时/平方米/天[11]。在该国南部、罗马地区和撒丁岛,这一数字可能升至 5.0 kWh/m²/天,并在西西里岛西南部达到最大值 5.0-5.3 kWh/m²/天 [11]。风资源分布情况:全国大部分地区风速不超过5.0m/s;中部地区可达6.0-7.0 m/s;在该国的南部和北部,它在 50 米的高度达到最大值 7.0-7.5 m/s, sec [12]。意大利水电的经济可开发能力很高,2013 年估计为 47500 吉瓦/年[13]。
2018年,意大利41.7%的领土被农业用地占据[14],这一数字在过去半个世纪中一直在稳步下降。然而,森林面积也增加到 32.1% [15]。2013年该国的地热潜力估计为2000兆瓦[16]。
2018年,意大利人均城市垃圾产生量为499公斤,低于法国(人均527公斤)和德国(人均615公斤)[17]。这种资源是回收或生产能源的宝贵原材料,其技术在意大利已达到很高的发展水平。
根据BP《2021年世界能源统计年鉴》,2020年意大利一次能源消费总量为5.86艾焦耳(全球557.1艾焦耳),其中约36.3%来自石油,41.6%来自天然气,11.4%来自可再生能源, 3.5%来自煤炭,7%来自水电[6]。
使用[3,6]中的数据,我们计算出 2020 年意大利每单位一次能源使用的 GDP 为 16.6 美元,同时考虑到 2011 年每单位能源消耗的购买力平价价格(相当于一公斤石油当量所含的能量/美元) PPP每公斤油当量),显着高于GDP能源效率世界平均水平。2001年至2020年期间石油产量几乎保持不变,不超过20万桶/日的水平。2020 年,这一数字为 14.4 万桶/天 [18]。
Source: U.S. Energy Information Administration (Sep 2023) / www.eia.gov
2. 意大利化石燃料的生产和消费(煤炭 – 左,天然气 – 中间,石油 – 右)
自 2001 年以来的石油消费量该国的产量呈下降趋势(图2),2020年达到105万桶/日的水平[18]。英国石油公司 (BP) 审查显示,2020 年意大利石油产量下降 – 11.2 万桶/日,消费量为 107.9 万桶/日 [6]。根据《Rapporto Annuale 2018》[19],2017 年石油产量估计为 414 万吨。
根据[3],2017年意大利石油进口总量为134.1万桶/日,出口量为13,790桶/日。意大利天然气消费量从2010年到2019年下降,2019年达到2624 Bcf,产量也在下降,2019年达到170 Bcf [18]。根据BP《2021年世界能源统计年鉴》[6],2020年全国天然气消费量为677亿立方米,产量为39亿立方米。根据[19],2017年天然气产量为55.6亿标准米3。意大利是欧洲第二大天然气进口国,仅次于德国,也是第三大天然气消费国;2019 年进口量为 2.5 Tcf,约占总消费量的 92%。
意大利最大的天然气出口国是俄罗斯,占2020年进口量的28.5%。天然气还通过阿尔及利亚和利比亚的管道供应到该国。液化天然气占天然气进口总量的12.1%,主要来自卡塔尔[6,20]。据[3]统计,2017年意大利进口天然气696.6亿立方米,出口2.718亿立方米。近年来,该国煤炭消费量大幅下降,2020年达到850万短吨[18]。
据BP统计,2020年煤炭消费量为0.21[6]。
意大利电力生产中化石燃料的比例下降,可再生能源的比例上升(图 3)。
Sources: U.S. Energy Information Administration (Sep 2023) / www.eia.gov | ||
图 3. 意大利的发电量 |
根据美国能源信息署的数据,2020 年意大利发电量为 272 太瓦时,其中化石燃料占 56%,可再生能源占 26.5%,水力发电占 17.6%(图 7)。
意大利在能源指数对比图中的位置如图4所示。
在所有主要资源成分——石油、天然气和煤炭。
| Sources: 1. Crude oil proved reserves, 2021 / International Energy Statistic/Geography / U.S. Energy Information Administration (Nov 2021)*98 2. Natural gas proved reserves 2021 / International Energy Statistic / Geography / U.S. Energy Information Administration (Nov 2021) *99 3. Total recoverable coal reserves 2019 / International Energy Statistic / Geography / U.S. Energy Information Administration (Nov 2021) *81 4. Combination production-consumption for Crude oil 2018 / International Energy Statistic / Geography / U.S. Energy Information Administration (Nov 2021) *219 5. Combination production-consumption for Natural gas 2019 / International Energy Statistic / Geography / U.S. Energy Information Administration (Nov 2021) *123 6. Combination production-consumption for Coal 2019 / International Energy Statistic / Geography / U.S. Energy Information Administration (Nov 2021) *128 7. Electricity – from other renewable sources (% of total installed capacity), 2017 est. / The World Factbook / Library / Central Intelligence Agency *170 8. GDP per unit of energy use (PPP per unit of oil equivalent), 2020 *66 Primary energy consumption - BP Statistical Review of World Energy 2021/BP;GDP (purchasing power parity) - The World Factbook/Library/Central Intelligence Agency 9. Energy use (primary energy use of oil equivalent per capita) 2020 *127 Primary energy consumption – BP Statistical Review of World Energy 2021; Population - United Nations, Department of Economic and Social Affairs, Population Division (2019). World Population Prospects 2019, custom data acquired via website. Retrieved 15 November 2021*66 10. The Global Energy Architecture Performance Index Report (EAPI) 2017 / Rankings / Reports / World Economic Forum 11. Electric power consumption (kWh per capita), 2016 *217 Electricity Consumption - The World Factbook / Library / Central Intelligence Agency; Population - United Nations, Department of Economic and Social Affairs, Population Division (2019). World Population Prospects 2019, custom data acquired via website. Retrieved 15 November 2021 12. Combination of electricity production-consumption (kWh)/The World Factbook/Library/Central Intelligence Agency *216 * Total number of countries participating in ranking 图 4. 意大利能源指数 |
然而,就石油储量而言,该国的定位看起来相当有希望。
在 2017 年按可再生能源发电水平(不包括水力发电)列出的国家排名中,意大利在 170 个入选国家中排名第 13 位,落后于比利时,但领先于西班牙。在2017年能源架构绩效指数中,意大利排名第29位,该指数主要基于该国的经济增长水平、环境安全和能源独立性(包括能源获取情况);值得注意的是,在过去 8 年里,该国失去了 4 个排名位置。对于 2017 年单位能源消耗 GDP 等指标,意大利位居图表前四分之一——第 10位;按人均能源使用量计算,该国在 127 个国家中排名第 9位。按人均用电量计算,该国位居世界第59位。然而,就电力生产与消费综合指标而言,意大利在216个国家中排名垫底。
图5显示了意大利化石燃料行业最大基础设施项目分布的领土地图。在化石能源资源的总潜力中,石油发挥着主导作用——56.1%。天然气占34.1%,煤炭占9.8%,但化石资源总量较小(图5)。意大利的天然气田主要是海上油田。Corsini Mare Est 是主要气田之一,2010 年生产了 1.61 亿立方英尺天然气 [21]。意大利天然气基础设施包括 12 个天然气加工厂和 12 个天然气储存设施。天然气通过总长度为 20,223 公里的管道网络在国内运输(图 5)。
天然气进口通过三个液化天然气接收站进行,其中最大的是亚得里亚海液化天然气接收站(莱万特港),装机容量为8 bcm/年,约占全国消费量的10%[22]。2001年,ENI建立了Sannazzaro试点GTL工厂,装机容量为20桶/天,能够生产液化天然气[23]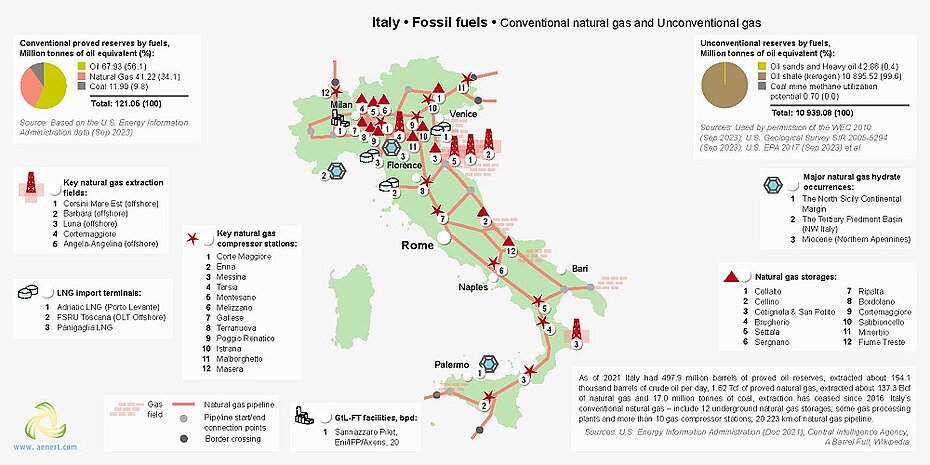
图5 意大利常规和非常规天然气基础设施
在该国北部以及南部的巴勒莫地区,在科学研究过程中,已经积累了天然气水合物(图5)。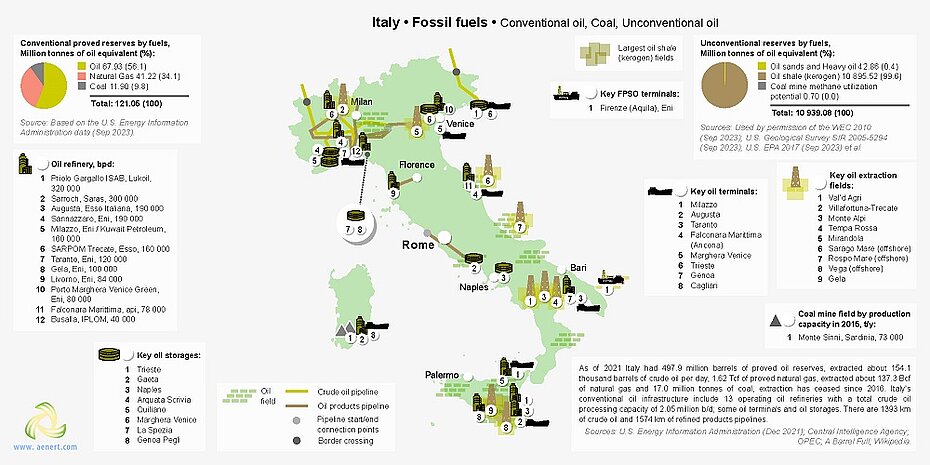
图6意大利常规石油、煤炭和非常规石油基础设施
Val'd Agri 是领先的油田之一,2014 年的开采量为 85,000 桶/天 [24]。
2016年意大利炼油厂装机容量为205万桶/日,在欧洲仅次于德国[20,25]。最大的炼油厂Española Priolo Gargallo ISAB,装机容量为32万桶/天[25](图6)。石油及油品进口通过8个石油码头进行;最大的石油产品储存位于的里雅斯特 TAL SIOT (2 030 000 m 3 ) [26]。原油和石油产品的运输通过管网进行,总长度分别为1393公里和1574公里(图6)。
在该国南部,油田开发通过FPSO进行,生产能力为12,000桶/天,罐容量为700,000桶[27]。
意大利的干酪根油储量位居世界前十位,但由于缺乏有竞争力的技术,该国对该资源的开发进展缓慢。
主要煤田位于撒丁岛的 Monte Sinni。2015年这里的开采量为73,000吨,但到2018年已减少至30,000吨[28]。意大利最大发电基础设施对象地域分布图如图7所示。
2017年意大利发电中化石燃料占比为56%(图7)。
该国拥有大量碳氢化合物发电站,其中包括装机容量超过100兆瓦的发电厂;其中石油电厂 5 座、天然气电厂 11 座、石油电厂 11 座、联合式电厂 3 座(图 7)。意大利最大的发电厂有: Turbigo 燃气发电厂,总装机容量为 1,755 MW[29];Porto Tolle 石油发电厂,容量为 2,640 MW[30];煤炭动力的 Brindisi Sud (Federico II),装机容量为 2,640 MW;和 Alessandro Volta (Montalto di Castro) 联合电厂,装机容量为 3 600 MW [31,32]。意大利水电占发电量的17.3%,以抽水蓄能电站和大小水电站为代表(图7)。最大的泵站是 Entracque (Rovina/Chiotas/Luigi Einaudi),装机容量为 1318 MW [33];主要水力发电厂是San Giacomo,装机容量为448 MW [34]。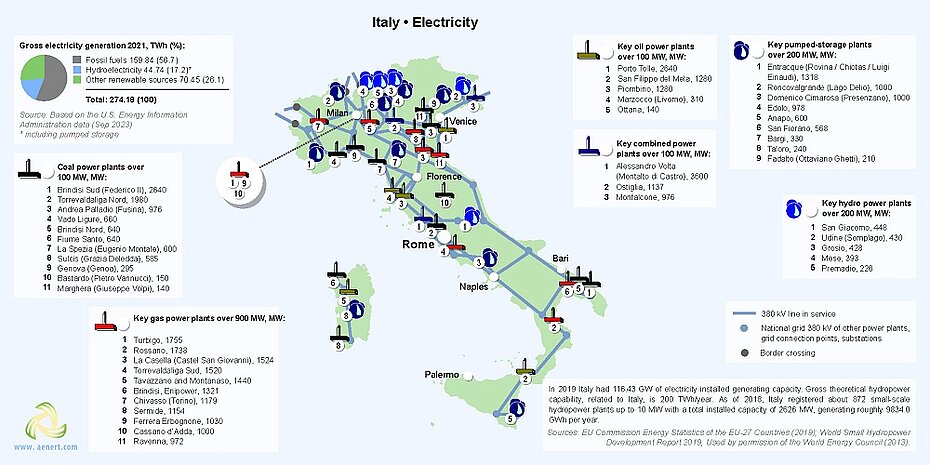
图 7. 意大利的发电量
2017年意大利有3000座小水电站,总装机容量为3173兆瓦(图7)。据意大利统计局统计,2015年大型水电站(10兆瓦以上)发电量为346.729亿千瓦;中型电站(1-10 MW)发电量为 83.082 亿千瓦,1 个小型电站(0-1 MW)发电量为 25.562 亿千瓦[35]。
图8显示了意大利用于生产可再生能源的主要基础设施。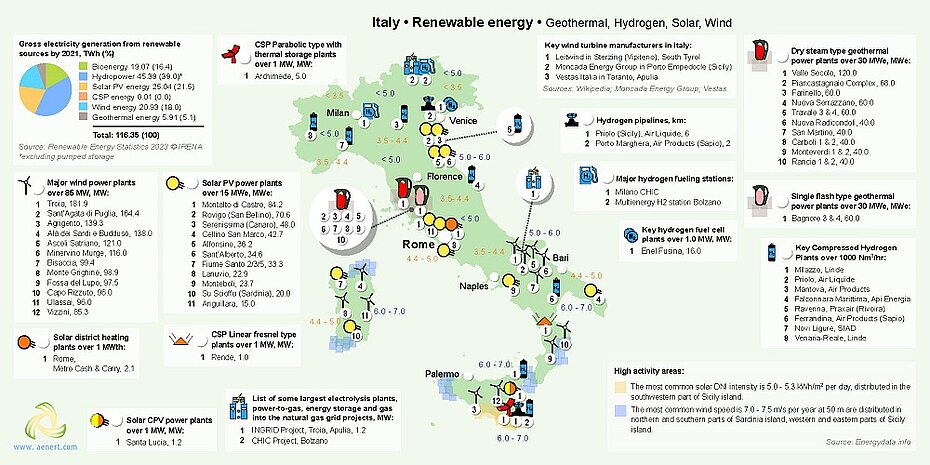
图 8. 意大利的可再生能源:太阳能、风能、地热能和氢能
如上所述,意大利可再生能源占发电量的26.7%(图7)。因此,2020年不包括水电的可再生能源发电总量为72.45太瓦时(图8)。据IRENA统计(图8),2019年水电在可再生能源发电总量中所占份额占主导地位,达40%。太阳能电站占20.5%,生物能占16.9%,风能占17.4%,地热能占5.2%[35](图8)。在风力活动频繁的地区,有十多个风电场,每个风电场的容量都超过 85 兆瓦。2020年,风力发电机组数量约为2000台,总装机容量为10800MW[6,36]。最大的是 Troia 风电场,装机容量为 181.9 MW [37]。意大利三大风力发电机生产商是Vestas Italia、Moncada Energy Group 和Leitwind(图8)。如上所述,我国部分地区太阳直接辐射水平可达5.3 kWh/m 2,是适合能源生产的资源[11]。因此,大量太阳能设施(包括光伏设施和带有太阳能聚光器的热能设施)都位于该领土上。著名的设施包括: 一个抛物线型 CSP 站 – 阿基米德 (5 MW) [38];仁德光热发电线性菲涅尔型电站(1 MW);和 CPV 太阳能发电厂 – 圣卢西亚,容量为 1.2 MW [39,40]。意大利约9%的电力由光伏电站产生。该类型最大的电站是 Montalto di Castro,装机容量为 84.2 MW [41]。太阳能还用于空间供暖,例如罗马 Metro 现购自运商店安装的太阳能装置,容量为 2.1 MWth [42]。值得注意的是,意大利是全球光伏发电占总发电量比例指标最高的国家之一。根据[43]的数据计算,这一比例肯定超过8%,比刚刚超过1%的世界平均水平高出好几倍。
意大利正在积极开发氢作为汽车能源。截至2017年11月,全国已有2座加氢站投入运营(图8)。该国还有几家生产氢气的工厂,其中最大的一家由 Milazzo 管理,装机容量为 54,166 Nm³/hr [44],以及两座氢燃料电池发电厂;Enel 旗下的 Fusina 拥有最大的容量 – 16 MW [45]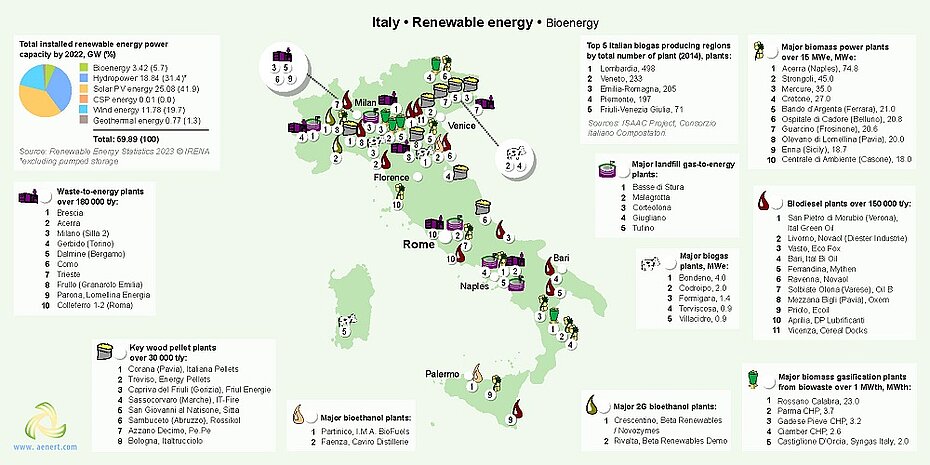
图 9. 意大利的可再生能源:生物能源
如前所述,意大利的地热潜力估计为 2,000 兆瓦 [16]。该国中部地区有许多干蒸汽型地热发电厂(最大的是 Valle Secolo (120 MW))和单闪发型地热发电厂(最大的是 Bagnore 3 和 4 站综合体(60兆瓦))[46,47]。它们被发现于托斯卡纳,1913 年,地热能发电就是在那里诞生的。如今,在意大利,超过 6% 的可再生能源电力是使用该技术产生的。
图 9 显示了意大利用于能源生产的主要生物能源设施。
生物能源在意大利正在积极发展,2018-2020年装机容量约为3.5吉瓦(6.4%),2019年约19.5太瓦时(17%)的可再生能源电力来自生物质(图8,9)。该国拥有生物质和城市垃圾加工厂;沼气、生物柴油、生物乙醇、颗粒和垃圾填埋气生产(图9)。
该国拥有生物质和城市垃圾加工厂;沼气、生物柴油、生物乙醇、颗粒和垃圾填埋气生产(图9)。Fri-El Green Power SpA 运营着最大的生物质发电厂 Acerra(那不勒斯),装机容量为 74.8 MW [48]。意大利生物质燃料领域的主要生产企业是San Pietro di Morubio,年产生物柴油36万吨[49]。意大利积极从事生物乙醇的生产;由 IMA BioFuels 管理的 Partinico 产量为 172,000 吨/年 [50]。第二代纤维素生物乙醇在最大的工厂 Crescentino 生产,该工厂的装机容量为 7500 万升 [51]。仅在伦巴第大区就有约 500 个沼气厂,其中最大的是 Bondeno,装机容量为 4 MW [52](图 9)。其他著名企业包括:Rossano Calabra 生物质气化厂,容量为 23 MWe [53];Corana (Pavia) 每年生产约 60,000 吨颗粒[54]。布雷西亚工厂是利用城市垃圾发电的领先者,每年可处理 80 万吨[55]。Basse di Stura 垃圾填埋气发电厂利用垃圾填埋气发电约 8.4 MW [56]。意大利2017年国家能源战略目标是到2030年减少最终能源消耗1000万吨石油当量;到2030年,可再生能源占能源消费总量的比重达到28%,发电量的比重达到55%。另一个重要领域是开发和引进环保燃料以及逐步淘汰使用可再生能源。到 2025 年,煤炭将用于发电 [57]。过去几年,德国风力涡轮机制造商Senvion在意大利市场非常活跃,2016年该公司获得了安装30台涡轮机的合同,总容量为60兆瓦,并于2017年管理建设地中海第一个海上风电场,容量为 30 MW [58,59]。
2017年7月,蒙特洛完成了第一座城市垃圾生物甲烷加工厂的建设[60]。2017 年,托斯卡纳地区利用地热能发电量创下纪录,比 2016 年增加了 51 GWh [61]。
图 10 反映了意大利相对于其他国家在教育和创新领域的地位的一组指数。在2021 年全球创新指数国家排名中,意大利在 132 个国家中排名第 29位(参见图表)。根据意大利国民在国内外获得的专利数量,该国在世界上排名第十,在欧洲排名第六。同样,从专利数量来看,该国位居世界第八,这表明该国具有良好的创新条件。
就政府教育支出占国内生产总值的百分比而言,该国的结果接近世界平均水平——在入选的 177 个国家中排名第 94位。尽管如此,仍有30所意大利大学被纳入世界领先大学评级——“QS大学评级”。还值得注意的是,该国GDP较高,因此,从绝对值来看,政府的教育支出水平相当可观。就研发公共支出占GDP的百分比而言,意大利排名第27位,落后于一些欧洲国家,但领先于西班牙、波兰、希腊。考虑到科技期刊和专利活动专家的出版物数量,意大利处于非常有利的位置。该国在 Scimago 排名中在 240 个参与国家中排名第 8 ,在科学和期刊活动中在 197 个国家中排名第8。就互联网用户数量而言,该国也是该地区的领先者之一。
| Sources: 1. The Global Innovation Index 2021, Rankings / Knowledge / World Intellectual Property Organization / Cornell University, INSEAD, and WIPO (2021): Energizing the World with Innovation. Ithaca, Fontainebleau, and Geneva *132 2. Patent Grants 2011-2020, resident & abroad / Statistical country profiles / World Intellectual Property Organization *185 3.Patents in Force 2020 / Statistical country profiles / World Intellectual Property Organization *109 4. QS World University Rankings 2022 *97 5. SCImago Country Rankings (1996-2020) / Country rankings / SCImago, (n.d.). SIR-SCImago Journal & Country Rank [Portal]. Retrieved 17 Nov 2021 *240 6. Internet users in 2018 / The World Factbook / Central Intelligence Agency *229 7. Internet users in 2018 (% Population) / The World Factbook / Central Intelligence Agency *229 8. Government expenditure on education, total (% of GDP), 2019 / United Nations Educational, Scientific, and Cultural Organization (UNESCO) Institute for Statistics. License: CCBY-4.0 / Data as of September 2021*177 9. Research and development expenditure (% of GDP), 2018 / UNESCO Institute for Statistics. License: CCBY-4.0 / Data *119 10. Scientific and technical journal articles, 2018 / National Science Foundation, Science and Engineering Indicators. License: CCBY-4.0 / Data *197 * Total number of countries participating in ranking 图 10. 意大利教育和创新指数 |
意大利大学,如特伦托大学、比萨高等师范大学、罗马大学“La Sapienza”、米兰理工大学和博洛尼亚大学等,培养能源工程、环境和土地等各个能源领域的专家在合成
燃料生产领域,意大利公司中专利申请方面处于领先地位的是 Eni SpA、Agip Petroli SpA、Enitecnologie SpA 该领域的研发由米兰理工大学、米兰大学、Universita 进行degli Studi di Messina,CNR-ITAE“Nicola Giordano”。国家海洋和地理实验研究所、罗马大学“La Sapienza”和国家地理和火山研究所 (INGV) 发表了天然气水合物领域的科学论文。在低渗透油藏油气开采领域,埃尼公司在专利方面处于绝对领先地位;埃尼公司和都灵理工大学正在开展这一领域的研究。非常规石油领域领先的专利持有者有 Eni SpA、Enitecnologie SpA、Snamprogetti SpA、Agip Petroli SpA Eni SpA。米兰理工大学正在开展这一领域的研究。在伴生气领域——Eni SpA、米兰理工大学 Enitecnologie SpA 积极从事该领域的研究。
生物能源领域领先的专利持有者是 Eni SpA 和 Agt Srl。佩鲁贾大学、帕多瓦大学、博洛尼亚大学和米兰大学正在开展这一领域的研究。许多意大利公司在可再生能源生产领域申请了技术解决方案专利。在太阳能领域,包括 Magaldi Industrie, SRL、ENEA-意大利国家新技术、能源和可持续经济发展局、Eni SpA、Nuovo Pignone SpA。该领域的领先研究机构包括 ENEA-意大利国家新技术局、米兰理工大学、罗马大学“La Sapienza”。Enel Green Power SPA、SISv.El.Spa在风电领域专利数量位居榜首;米兰理工大学和博洛尼亚大学正在开展这一领域的研究。
图 11 中的环境指数在一定程度上反映了该国的生态状况,就意大利而言,其生态状况相当负面。首先,该国的总体CO 2排放量和人均排放量均较高。2020年,煤炭开采和加工过程中CO 2排放量为297百万吨[63]。平均而言,消除此类排放后果的成本使意大利花费超过 5.28 亿欧元(健康成本、污染成本)[62]。
| Sources: 1. CO2 total emission by countries 2020 / European Commission / Joint Research Centre (JRC) / Emission Database for Global Atmospheric Research (EDGAR)*208 2. CO2 per capita emission 2020/European Commission/Joint Research Centre (JRC) / Emission Database for Global Atmospheric Research (EDGAR) *208 3. Forest area 2020 (% of land area) / The Global Forest Resources Assessment 2020 / Food and Agriculture Organization of the United Nations *234 4. Forest area change 2010-2020 (1000 ha/year) / The Global Forest Resources Assessment 2020 / Food and Agriculture Organization of the United Nations *234 5. The Environmental Performance Index (EPI) 2020 / Rankings / Yale Center for Environmental Law & Policy / Yale University *180 6. Annual freshwater withdrawals (m3 per capita), 2017 *179 Annual freshwater withdrawals, total (billion m3), 2017 – Food and Agriculture Organization, AQUASTAT data. /License: CC BY-4.0; Population – United Nations, Department of Economic and Social Affairs, Population Division (2019). World Population Prospects 2019, custom data acquired via website. Retrieved 15 November 2021 7. The National Footprint Accounts 2017 (Biocapacity Credit / Deficit) / Global Footprint Network *188 8. Methane emissions (kt of CO2 equivalent), 2018 / Data for up to 1990 are sourced from Carbon Dioxide Information Analysis Center, Environmental Sciences Division, Oak Ridge National Laboratory, Tennessee, United States. Data from 1990 are CAIT data: Climate Watch. 2020. GHG Emissions. Washington, DC: World Resources Institute. Available at: License : Attribution-NonCommercial 4.0 International (CC BY-NC 4.0) *191 9. The Climate Change Performance Index (CCPI) 2022 / Overall Results / Jan Burck, Thea Uhlich, Christoph Bals, Niklas Höhne, Leonardo Nascimento / Germanwatch, NewClimate Institute & Climate Action Network *60 * Total number of countries participating in ranking 图11. 意大利环境指数 |
还应该指出的是,意大利的甲烷排放量相对较高。 在 2022 年气候变化绩效指数 (CCPI) 中,意大利在 61 个国家中排名第 25 位,其排放量占全球与能源相关的二氧化碳排放量的 90% 以上,其排放量被归类为“中度”。 ”。 就森林面积占全国的百分比而言,2020年意大利位居世界第112位; 然而,2010-2020 年的变化趋势看起来非常积极; 按照这个指标,该国在世界上排名第九。
2020 年环境绩效指数排名 (EPI) 中对意大利的高度评价使这一情况更加明朗,该排名主要侧重于评估各国政府的环境绩效。 该国在 180 个国家中排名第 20 位,落后于许多欧洲国家,但领先于美国。 生态足迹图集评级加剧了总体负面情况,根据该评级,意大利是众多生态债务国之一。
[1] List of sovereign states and dependencies by area / Wikipedia / https://en.wikipedia.org/wiki/List_of_sovereign_states_and_dependencies_by_area
[2] List of countries and dependencies by population density / Wikipedia / https://en.wikipedia.org/wiki/List_of_countries_and_dependencies_by_population_density
[3] Italy / The world factbook / Library / Central Intelligence Agency / https://www.cia.gov/
[4] GDP, PPP (constant 2011 international $) / World Bank, International Comparison Program database. License: CC BY-4.0 / Data / The World Bank / http://www.worldbank.org/
[5] GDP per capita, PPP (current international $)/ World Bank, International Comparison Program database. License: CC BY-4.0 / Data / The World Bank / http://www.worldbank.org/
[6] BP Statistical Review of World Energy 2021 (PDF) / BP / https://www.bp.com/
[7] Riserve nazionali di idrocarburi / Ministrero dello sviluppo economico / https://unmig.mise.gov.it/
[8] International Energy Statistic / Geography / U.S. Energy Information Administration / www.eia.gov/beta/international/
[9] Carbosulcis coal mine / Wikipedia / en.wikipedia.org/wiki/Carbosulcis_coal_mine
[10] 2010 Survey of Energy Resources (PDF) / World Energy Council / www.worldenergy.org/
[11] Solar resource data obtained from the Global Solar Atlas, owned by the World Bank Group and provided by Solargis / Global Solar Athlas / http://globalsolaratlas.info/
[12] Wind Map / Global Wind Atlas 2.0, a free, web-based application developed, owned and operated by the Technical University of Denmark (DTU) in partnership with the World Bank Group, utilizing data provided by Vortex, with funding provided by the Energy Sector Management Assistance Program (ESMAP). For additional information: https://globalwindatlas.info
[13] Hydro (PDF) / World Energy Council / https://www.worldenergy.org/
[14] Agricultural land (% of land area) / Food and Agriculture Organization, electronic files and web site. License: CC BY-4.0 / Data / The World Bank / http://www.worldbank.org
[15] Forest area (% of land area) /Food and Agriculture Organization, electronic files and web site. License: CC BY-4.0 / Data / The World Bank / http://www.worldbank.org/
[16] 2016 Annual U.S. & Global Geothermal Power Production Report (PDF) / Geothermal Energy Association / http://geo-energy.org/
[17] Municipal waste statistics Updated / Full list / Statistics Explained / Eurostat / https://ec.europa.eu/
[18] International Energy Statistic / Geography / U.S. Energy Information Administration /http://www.eia.gov/beta/international/
[19] Rapporto annuale 2018 Attivita dell’anno 2017 (PDF) / Ministrero dello sviluppo economico / https://unmig.mise.gov.it/
[20] Italy / Geography / U.S. Energy Information Administration /http://www.eia.gov/beta/
[21] Porto Corsini Mare Est gas field / Wikipedia / http://en.wikipedia.org/wiki/Porto_Corsini_Mare_Est_gas_field
[22] The Terminal / Adriatic LNG / http://www.adriaticlng.com/
[23] Eni’s GTL pilot plant introduced in Italy / 12/11/2001 / ICIS / https://www.icis.com/
[24] Can Italy Double Its Oil Production? / Oil Price / http://oilprice.com/
[25] OPEC Annual Statistical Bulletin 2017 (PDF) / Organization of the Petroleum Exporting Countries (OPEC) / http://www.opec.org/
[26] Depot petrolier de Triestre TAL / Europetrole / http://www.euro-petrole.com/
[27] Aqualia FPSO / A Barrel Full / http://abarrelfull.wikidot.com/
[28] Italy / EURACOAL / https://euracoal.eu/
[29] La Centrale Turbigo (PDF) / Iren Energia S.p.A. / http://www.irenenergia.it/
[30] Centrale termoelettrica di Porto Tolle / Wikipedia / http://it.wikipedia.org/wiki/Centrale_termoelettrica_di_Porto_Tolle
[31] Brindisi Sud / Industry About / http://www.industryabout.com/
[32] Centrale termoelettrica Alessandro Volta / Wikipedia / http://it.wikipedia.org/wiki/Centrale_termoelettrica_Alessandro_Volta
[33] Entracque Power Plant / Wikipedia / http://en.wikipedia.org/wiki/Entracque_Power_Plant
[34] Centrale idroelettrica di San Giacomo / Wikipedia / http://it.wikipedia.org/wiki/Centrale_idroelettrica_di_San_Giacomo
[35] Energy Balance / I.Stat / http://dati.istat.it/
[36] Wind Power in Italy / Wikipedia / https://en.wikipedia.org/wiki/Wind_power_in_Italy
[37] Impianti eolici in Puglia: il primato appartiene a Troia, segue Sant’Agata / Foggia Today / http://www.foggiatoday.it/
[38] First molten Salt Solar Power / 22/06/2010 / The Guardian / https://www.theguardian.com/
[39] Rende-CSP Plant / National Renewable Energy Laboratory: Concentrating Solar Power Research / http://www.nrel.gov/
[40] Santa Lucia CPV Solar Plant / СPV consortium / http://cpvconsortium.org/
[41] Large-Scale Photovoltaic Power Plants, Annual Report 2010 (PDF) / PV Resources / http://www.pvresources.com/
[42] Italy / Solar District Heating / http://solar-district-heating.eu/
[43] Italy / IEA Atlas of Energy / Statistics / International Energy Agency / ©OECD/IEA 2018, IEA Publishing, Licence: www.iea.org/t&c/ https://www.iea.org/
[44] Merchant Hydrogen Production Capacities in Europe / Hydrogen Tools / https://hydrogen.pnl.gov/
[45] Fusina hydrogen power station / Wikipedia / http://en.wikipedia.org/wiki/Fusina_hydrogen_power_station
[46] Valle Secolo / Industry About / http://www.industryabout.com/
[47] Enel officially inaugurates Bagnore 4 plant in Tuscany, Italy / Think geoenergy / http://www.thinkgeoenergy.com/
[48] The Acerra power plant / Fri-El Green Power S.p.A. / http://www.fri-el.it/
[49] Large Industrial Users of Energy Biomass, 2013 (PDF) / IEA Bioenergy Task 40 / http://www.bioenergytrade.org/
[50] Scheda informativa: La Filiera del Biogas e del Biocarburanti, 2010 (PDF) / Veneto Agricoltura / http://www.venetoagricoltura.org/
[51] A New Era Begins Crescentino – World’s first advanced biofuels facility / Etip Bioenergy / http://www.etipbioenergy.eu/
[52] 4mw Biomass Power Station Aims For Zero Carbon Footprint / Products for Automation / https://www.products4automation.co.uk/
[53] Market of Olive Residues for Energy (PDF) / European Comission / https://ec.europa.eu/
[54] Global Wood Pellet Industry Market and Trade Study, December 2011 (PDF) / IEA Bioenergy Task 40 / http://bioenergytrade.org/
[55] Brescia Incineration Plant / Waste to energy / Italy / Industry About / http://www.industryabout.com/
[56] Entraining for the Olympics / Modern Power Systems / http://www.modernpowersystems.com/
[57] Italy’s National Energy Strategy 2017 (PDF) / Ministero dello sviluppo economic / http://www.sviluppoeconomico.gov.it/
[58] Italy: Senvion scores 60 megawatt contract / Windfair / http://w3.windfair.net/
[59] Senvion signs Exclusivity Agreement for the first offshore wind farm in the Mediterranean Sea / Windfair / http://w3.windfair.net/
[60] Italy’s ‘first’ municipal waste to methane plant inaugurated / Bioenergy Insight / https://www.bioenergy-news.com/
[61] 2017starts with new record for geothermal energy production in Tuscany / Think Geoenergy / http://www.thinkgeoenergy.com/
[62] Coal is a climate problem (PDF) / European Coal Map / http://www.coalmap.eu/
[63] EDGAR - Emissions Database for Global Atmospheric Research/ EDGAR - The Emissions Database for Global Atmospheric Research (europa.eu)
图表和曲线的来源在图像下方指定。
有关意大利能源行业的更多信息,请参见此处
