
立陶宛,正式名称为立陶宛共和国,是一个东北欧国家,位于波罗的海东岸。立陶宛北部与拉脱维亚接壤,东部和南部与白俄罗斯接壤,西南与波兰和俄罗斯州加里宁格勒接壤。该国西部濒临波罗的海,与瑞典接壤。该国海岸线绵延 90 公里,不包括库尔斯沙嘴。
根据2023年的统计数据,立陶宛的面积排名世界第123位,拥有约270万人口。就人口密度而言,该国在 249 个国家中排名第 182位。该国的行政地图分为60个市,维尔纽斯是其首都和人口最多的城市。政府的政治形式是半总统制共和国,官方语言是立陶宛语[1,2,3]。
| Lithuania / Republic of Lithuania | ||
|---|---|---|
| Capital: Vilnius | Density: 43/km2 | Currency: Euro (€) (EUR) |
| Official languages: Lithuanian | Life expectancy at birth: 74.93 years | GDP (PPP): $144.261 billion (2024 est.) |
| National Day: 16 February | Area (land): 65,300 km2 | GDP - per capita (PPP): $52,200 (2024 est.) |
| Population: 2,655,755 (2023 est.) | Coastline: 262 km | Internet country code: .lt |
Source: [1,2,3,4,5]

Aerial view of Vilnius old town. Envato. 4LNP5JB28Q
立陶宛相对于其他国家的排名是根据一系列经济、能源、创新和教育指数以及反映环境状况的指标确定的。经济指标包括人均GDP、年均GDP增长率、高新技术出口等。能源指数列表包括石油、天然气和煤炭的探明储量、产耗比以及能源使用情况等。每个指数都有一个包含的成员国排名列表。由于每个指数的每个评级的国家数量不同,因此将感兴趣的国家的定位显示在一个特殊的图表上,其中纵轴是从0到1的统一相对刻度,而横轴表示各个指数以及与下面给出的描述相关的相应编号。
因此,在这样一个相对的“0-1”图中,该国家的位置按照其在原始评级列表中的位置成比例地用点来标记。如果该国在所选指标方面处于领先地位,则将在相关图表“0-1”的上部绿色区域中标记为接近 1,如果该国在评级列表中属于局外人,则将标记为接近 1图表下方的红色区域为“0-1”等。所有国家均使用单一指数列表。如果某个国家/地区不在任何指数的排名列表中,则不会显示图表上的相应位置。
| Sources: 1. GDP (purchasing power parity), 2020 est. / The World Factbook/Library/Central Intelligence Agency *228 2. GDP - per capita (PPP), 2020 / The World Factbook/Library/Central Intelligence Agency *229 3. Inflation rate (consumer prices), 2019 est. / The World Factbook/Library/Central Intelligence Agency *228 4. Charges for the use of intellectual property, receipts (BoP, current US$), 2020 / International Monetary Fund, Balance of Payments Statistics Yearbook, and data files. / License: CC BY-4.0 *88 5. The Global Competitiveness Index 2019 / Rankings / Reports / World Economic Forum *141 6. High-technology exports (current US$) 2019-2020 / United Nations, Comtrade database through the WITS platform / License: CCBY-4.0 / Data *134 7. 2021 Index of Economic Freedom / International Economies / The Heritage Foundation *178 8. Reserves of foreign exchange and gold, 2017 est. / The World Factbook / Library / Central Intelligence Agency *195 9. Annual average GDP growth in %, for the last 10 years (2011-2020) / World Bank national accounts data, and OECD National Accounts data files / License: CC BY-4.0*206 10. Public debt (% of GDP), 2017 est. / The World Factbook / Library / Central Intelligence Agency(from smallest to largest) *210 * Total number of countries participating in ranking 图1. 立陶宛经济指数 |
对于图表中显示的大部分经济指标,立陶宛都位于排名中位以上。该国在经济自由指数(0.92)和人均国内生产总值(0.78)方面拥有最好的指数。该国经济指标中最薄弱的环节是知识产权使用费(0.30)和通货膨胀率(0.46)。总体而言,立陶宛是一个财政稳定、经济体系相对强大的国家。
立陶宛有一些原油矿藏。石油储量仅占世界总量的0.0007%。由于国内产量微不足道且仅用于石化工业,立陶宛完全依赖进口来满足其石油需求。立陶宛没有煤炭和天然气资源。
以吨油当量计算,根据2024年数据,常规探明储量以原油占100%(图5)。
表1.立陶宛化石能源资源
| Resource /Explanations | Crude oil* | Natural gas | Coal | Shale Gas | Tight Oil | Coalmine methane |
|---|---|---|---|---|---|---|
| Value | 0.012 (0.0007%) | - | - | 2.4** | 1.4** | - |
| Unit | billion barrels | - | - | trillion cubic feet | billion barrels | - |
| Year | 2021 | - | - | - | - | - |
| Source | [6] | [-] | [-] | [22] | [22] | [-] |
* 括号内提供了该国储量占世界总储量的比例
** 立陶宛/加里宁格勒
立陶宛拥有页岩气和致密油储量。然而,过去十年组织开采这些资源的尝试并未成功。
尽管立陶宛与大多数北欧国家一样,并不具备最高的太阳能潜力,但该国正在迅速发展包括太阳能在内的可再生能源。最常见的太阳能 GHI 强度为每天2.7-2.8 kWh/m2 ,在该国西部的克莱佩达县、马里扬波勒县和阿利图斯县达到每天3.0 kWh/m 2 。
KLAIPEDA, LITHUANIA
Latitüde: 55.73 Longitude: 21.08
Average speed: 3.74 m/s, Operational share: 66%
Average daily wind speed for 10 years of observations, m/s, 10 m above the ground
Source: based on NOAA U.S. Department of Commerce
Detailed information: Interactive map of wind resources
KLAIPEDA, LITHUANIA
Latitüde: 55.73 Longitude: 21.08
Average daily sky coverage over 10 years of observations, %
CLR - clear, SCT - scattered from 1/8 TO 4/8, BKN - broken from 5/8 TO 7/8, OVC - overcast, OBS - obscured, POB - partial obscuration
Source: based on NOAA U.S. Department of Commerce
Detailed information: Interactive map of solar resources
风能在立陶宛能源市场的潜力相当大,风电似乎是减少对化石燃料依赖的有前途的解决方案。由于地处波罗的海东岸的有利地理位置,该国拥有强大的风资源,在该国西部波罗的海沿岸50 m处风速可达7.0 m/s以上。此外,立陶宛在该地区拥有具有经济吸引力的海上风电潜力。
表2.立陶宛的可再生能源资源
| Resource/ explanations | Solar Potential (GHI)* | Wind Potential (50 м)* | Bio Potential (agricultural area) | Bio Potential (forest area) | Municipal Solid Waste |
|---|---|---|---|---|---|
| Value | 2.7- 2.8 | 5.0-7.0 | 47.0 | 36.1 | 480 |
| Unit | kWh/m2/day | m/s | % of land area | % of land area | kg per capita |
| Year | 2020 | 2020 | 2020 | 2020 | 2021 |
| Source | [7] | [8] | [9] | [10] | [11] |
*适用于该国大部分领土
立陶宛森林资源丰富,木材和农业废弃物展现了立陶宛最大的可再生能源潜力。该国主要使用两种生物燃料——生物柴油和生物乙醇。
根据官方统计门户网站的数据,2021年,初级能源生产的主要份额是木材和农业废物——占62.3%,其次是水能、风能、太阳能、地热能和化学过程能源——17%。据预测,立陶宛能源部门对森林生物质的能源消耗将继续增长[7]。
根据[6],2022年立陶宛一次能源总产量为0.02万亿英热单位,而消费量为0.244万亿英热单位。 因此,国内生产在一次能源消费中的份额约为8.2%。 这使得立陶宛成为一个高度依赖能源的国家。
根据《2022年世界能源统计年鉴》,2021年立陶宛一次能源消费量为0.25艾焦耳[13]。根据立陶宛统计局的数据[14],2021年内陆总消费结构以原油和石油产品为主(62.6%),其次是天然气(15.9%)、可再生能源(14.9%)。
Source: U.S. Energy Information Administration (Mar 2024) / www.eia.gov
2. 立陶宛化石燃料的生产和消费(煤炭 - 左,天然气 - 中间,石油 - 右)
如上所示,立陶宛其消耗的天然气和煤炭全部依赖进口,其数量在过去10年中略有下降。相反,石油消耗量略有增加,而产量则基本保持在相同水平。消耗的石油85%是进口的。
| Source: U.S. Energy Information Administration (Mar 2024) / www.eia.gov | ||
| 图 3. 立陶宛的发电量 |
在立陶宛,电力消耗量是生产量的三倍多。根据官方统计门户网站的数据,2019年,70%的电力依赖进口。在国内生产的 3.72 太瓦时电力中,61.7% 来自可再生能源。过去十年,该国的电力消耗增加了30%。
| Sources: 1. Crude oil proved reserves, 2021 / International Energy Statistic/Geography / U.S. Energy Information Administration (Nov 2021)*98 2. Natural gas proved reserves 2021 / International Energy Statistic / Geography / U.S. Energy Information Administration (Nov 2021) *99 3. Total recoverable coal reserves 2019 / International Energy Statistic / Geography / U.S. Energy Information Administration (Nov 2021) *81 4. Combination production-consumption for Crude oil 2018 / International Energy Statistic / Geography / U.S. Energy Information Administration (Nov 2021) *219 5. Combination production-consumption for Natural gas 2019 / International Energy Statistic / Geography / U.S. Energy Information Administration (Nov 2021) *123 6. Combination production-consumption for Coal 2019 / International Energy Statistic / Geography / U.S. Energy Information Administration (Nov 2021) *128 7. Electricity – from other renewable sources (% of total installed capacity), 2017 est. / The World Factbook / Library / Central Intelligence Agency *170 8. GDP per unit of energy use (PPP per unit of oil equivalent), 2020 *66 Primary energy consumption - BP Statistical Review of World Energy 2021/BP;GDP (purchasing power parity) - The World Factbook/Library/Central Intelligence Agency 9. Energy use (primary energy use of oil equivalent per capita) 2020 *127 Primary energy consumption – BP Statistical Review of World Energy 2021; Population - United Nations, Department of Economic and Social Affairs, Population Division (2019). World Population Prospects 2019, custom data acquired via website. Retrieved 15 November 2021*66 10. The Global Energy Architecture Performance Index Report (EAPI) 2017 / Rankings / Reports / World Economic Forum 11. Electric power consumption (kWh per capita), 2016 *217 Electricity Consumption - The World Factbook / Library / Central Intelligence Agency; Population - United Nations, Department of Economic and Social Affairs, Population Division (2019). World Population Prospects 2019, custom data acquired via website. Retrieved 15 November 2021 12. Combination of electricity production-consumption (kWh)/The World Factbook/Library/Central Intelligence Agency *216 * Total number of countries participating in ranking 图 4. 立陶宛的能源指数 |
立陶宛对化石燃料和电力进口的依赖反映在能源指数图表中,该国的电力生产-消费组合指数最低(0.01)。尽管该国消耗的能源只有三分之一是国内生产的,但其中60%以上是可再生能源,因此电力生产与消费综合指标(0.82)是所列指标中最高的。由于该国没有天然气和煤炭储备,这两个位置在聊天中保持空白。
立陶宛的化石燃料基础设施以石油部门为主,包括从原油开采到石油产品运输的所有流程和活动。主要原油矿藏位于该国西部。主要石油系统基础设施包括马泽基艾炼油厂、比尔扎伊管道、布廷加油码头和克莱佩达油码头。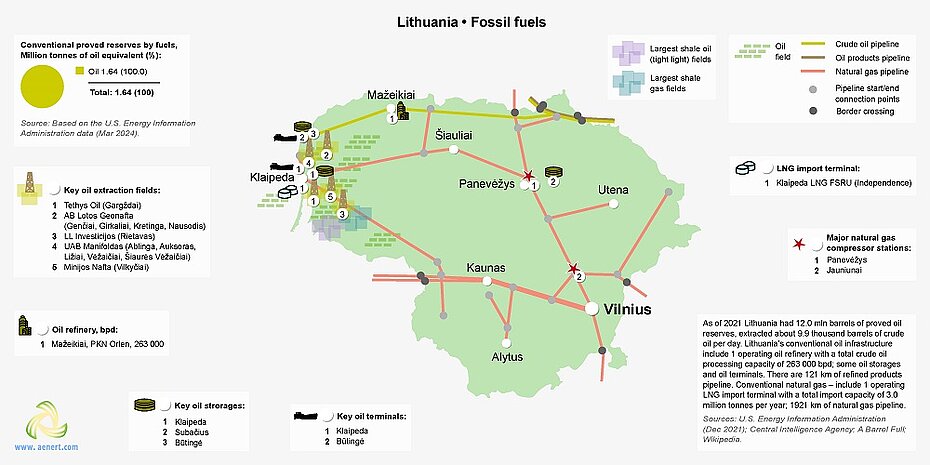
图5 立陶宛化石燃料行业基础设施
尽管严重依赖能源进口,立陶宛已成功克服了对俄罗斯能源的依赖,一贯拒绝从俄罗斯进口天然气、石油、电力和煤炭,通过克莱佩达的液化天然气终端、布廷厄的石油终端、新的石油终端进口能源。 与波兰的天然气连接以及与拉脱维亚的扩大连接[15]。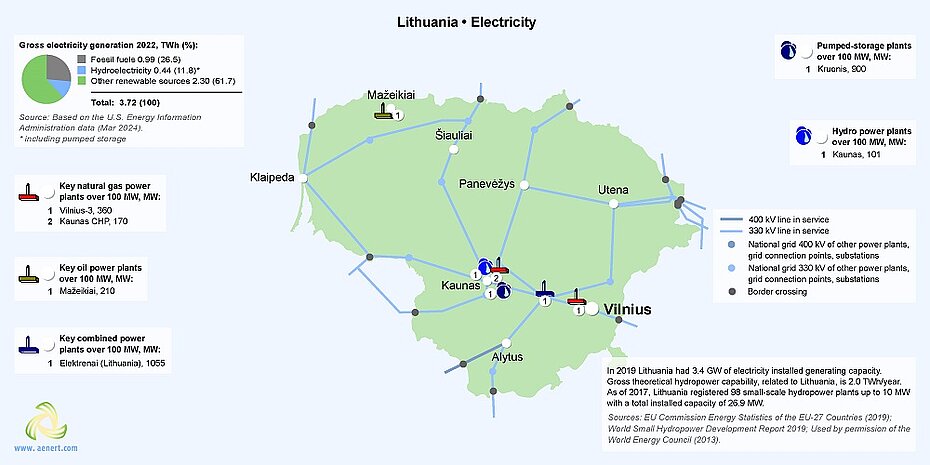
图 6. 立陶宛的电力生产
2009年底,立陶宛关闭了位于伊格纳利纳的最后一个核反应堆,该反应堆发电量占该国约70%。 因此,立陶宛从电力出口国转变为进口国,由于国内发电量虽然有所增长但仍不足,因此大约三分之二的电力是购买的。 该国拥有发达的输电系统,与波兰、拉脱维亚和瑞典相连,提供必要的进口。
Sunset at the gates to the port of Klaipeda, Lithuania. Envato. 9W5SEQ234U
国内发电的一小部分来自水力发电。 据立陶宛水电协会(LHA)统计,该国小型水电站装机容量为28兆瓦,每年发电量约100吉瓦时,占总发电量的3-4%。 考纳斯水力发电厂位于涅穆纳斯河上,是立陶宛最大的可再生能源发电厂[16]。
图 7. 立陶宛的可再生能源
在所有可再生能源中,风能是立陶宛最发达的。 据立陶宛风能协会统计[17],2022年风力发电机发电量为1.51太瓦时,相当于该国最终用电量的13.5%。 风电场总装机容量达到946兆瓦,占国家电网可再生能源装机容量的62.4%。 73.5 MW Pagėgiai 13 于 2016 年开始运营,是立陶宛和波罗的海地区最大的风电场 [18]。
鼓励可再生能源发电,从而减少对化石燃料的依赖是该国能源发展的首要任务。 根据《立陶宛共和国2021-2030年国家能源与气候行动计划》[19],计划逐步用当地电力生产替代进口电力:2030年达到70%,2050年达到100%。 由于大力发展可再生能源发电,计划实现这一目标。
该国实现能源独立的重要项目之一是在帕兰加附近的波罗的海建设海上风电场,将于2028年开始运营。这些海上风电场的容量约为1.4吉瓦,预计将在2028年开始运营。 每年产生高达 6 TWh 的清洁电力,这将满足立陶宛目前电力需求的一半[20]。
在快速发展的太阳能领域也有许多项目,其中之一是阿尼克希艾市的65兆瓦太阳能项目。 太阳能电池板面积将超过14万公顷,年发电量将在9万兆瓦时左右。 除了这座太阳能发电厂外,乔纳瓦和斯库达斯也启动了其他太阳能项目,计划到 2026 年并网[21]。
| Sources: 1. The Global Innovation Index 2021, Rankings / Knowledge / World Intellectual Property Organization / Cornell University, INSEAD, and WIPO (2021): Energizing the World with Innovation. Ithaca, Fontainebleau, and Geneva *132 2. Patent Grants 2011-2020, resident & abroad / Statistical country profiles / World Intellectual Property Organization *185 3.Patents in Force 2020 / Statistical country profiles / World Intellectual Property Organization *109 4. QS World University Rankings 2022 *97 5. SCImago Country Rankings (1996-2020) / Country rankings / SCImago, (n.d.). SIR-SCImago Journal & Country Rank [Portal]. Retrieved 17 Nov 2021 *240 6. Internet users in 2018 / The World Factbook / Central Intelligence Agency *229 7. Internet users in 2018 (% Population) / The World Factbook / Central Intelligence Agency *229 8. Government expenditure on education, total (% of GDP), 2019 / United Nations Educational, Scientific, and Cultural Organization (UNESCO) Institute for Statistics. License: CCBY-4.0 / Data as of September 2021*177 9. Research and development expenditure (% of GDP), 2018 / UNESCO Institute for Statistics. License: CCBY-4.0 / Data *119 10. Scientific and technical journal articles, 2018 / National Science Foundation, Science and Engineering Indicators. License: CCBY-4.0 / Data *197 * Total number of countries participating in ranking 图 8. 立陶宛的教育和创新指数 |
立陶宛在描述该国在教育和创新相关的各种国际排名中的地位的指数中有 80% 高于平均水平。立陶宛在 SCimago 国家排名(0.74)、互联网用户占人口百分比(0.72)以及研发支出占 GDP 百分比(0.71)中排名最高。该国最低的指标是2022年QS世界大学排名(0.40)。总体而言,立陶宛在教育和创新领域的指数看起来相当有说服力。
| Sources: 1. CO2 total emission by countries 2020 / European Commission / Joint Research Centre (JRC) / Emission Database for Global Atmospheric Research (EDGAR)*208 2. CO2 per capita emission 2020/European Commission/Joint Research Centre (JRC) / Emission Database for Global Atmospheric Research (EDGAR) *208 3. Forest area 2020 (% of land area) / The Global Forest Resources Assessment 2020 / Food and Agriculture Organization of the United Nations *234 4. Forest area change 2010-2020 (1000 ha/year) / The Global Forest Resources Assessment 2020 / Food and Agriculture Organization of the United Nations *234 5. The Environmental Performance Index (EPI) 2020 / Rankings / Yale Center for Environmental Law & Policy / Yale University *180 6. Annual freshwater withdrawals (m3 per capita), 2017 *179 Annual freshwater withdrawals, total (billion m3), 2017 – Food and Agriculture Organization, AQUASTAT data. /License: CC BY-4.0; Population – United Nations, Department of Economic and Social Affairs, Population Division (2019). World Population Prospects 2019, custom data acquired via website. Retrieved 15 November 2021 7. The National Footprint Accounts 2017 (Biocapacity Credit / Deficit) / Global Footprint Network *188 8. Methane emissions (kt of CO2 equivalent), 2018 / Data for up to 1990 are sourced from Carbon Dioxide Information Analysis Center, Environmental Sciences Division, Oak Ridge National Laboratory, Tennessee, United States. Data from 1990 are CAIT data: Climate Watch. 2020. GHG Emissions. Washington, DC: World Resources Institute. Available at: License : Attribution-NonCommercial 4.0 International (CC BY-NC 4.0) *191 9. The Climate Change Performance Index (CCPI) 2022 / Overall Results / Jan Burck, Thea Uhlich, Christoph Bals, Niklas Höhne, Leonardo Nascimento / Germanwatch, NewClimate Institute & Climate Action Network *60 * Total number of countries participating in ranking 图9. 立陶宛环境指数 |
立陶宛约 36% 的面积被森林覆盖,这一事实在环境指数图表(0.58)中得到了积极的反映。此外,森林资源变化(0.81)是各国表现最强的点之一。 Aerial view of Pazaislis Monastery among the beautiful nature in Kaunas, Lithuania. Envato. FSBH6GCRA3
立陶宛在 2022 年气候变化绩效指数 (0.83) 和环境绩效指数 (0.81) 中处于有利位置。该国的负面环境特征之一是其每年淡水消耗量(0.21),与其他国家相比非常低。由此可见,从图9来看,立陶宛整体的环境状况并不令人担忧,但一些指标如CO 2排放量有待改善。
[1] List of sovereign states and dependencies by area / Wikipedia / en.wikipedia.org/wiki/List_of_sovereign_states_and_dependencies_by_area
[2] List of countries and dependencies by population density / Wikipedia / en.wikipedia.org/wiki/List_of_countries_and_dependencies_by_population_density
[3] Lithuania / The world factbook / Library / Central Intelligence Agency / www.cia.gov
[4] GDP, PPP (constant 2011 international $) / World Bank, International Comparison Program database. License: CC BY-4.0 / Data / The World Bank / www.worldbank.org
[5] GDP per capita, PPP (current international $) / World Bank, International Comparison Program database. License: CC BY-4.0 / Data / The World Bank / www.worldbank.org
[6] International Energy Statistic / Geography / U.S. Energy Information Administration (Dec 2022) / www.eia.gov/beta/international/
[7] Environment, Agriculture and Energy in Lithuania (edition 2022) / Official Statistics Portal / https://osp.stat.gov.lt/lietuvos-aplinka-zemes-ukis-ir-energetika-2022/energetika/atsinaujinantys-energijos-istekliai
[8] Solar resource data obtained from the Global Solar Atlas, owned by the World Bank Group and provided by Solargis / Global Solar Atlas / globalsolaratlas.info
[9] Wind Map / Global Wind Atlas 2.0, a free, web-based application developed, owned and operated by the Technical University of Denmark (DTU) in partnership with the World Bank Group, utilizing data provided by Vortex, with funding provided by the Energy Sector Management Assistance Program (ESMAP). For additional information: globalwindatlas.info
[10] Agricultural land (% of land area) /Food and Agriculture Organization, electronic files and web site. License: CC BY-4.0 / Data / The World Bank / www.worldbank.org
[11] Forest area (% of land area) /Food and Agriculture Organization, electronic files and web site. License: CC BY-4.0 / Data / The World Bank / www.worldbank.org
[12] Municipal waste statistics Updated / Statistics Explained / Eurostat / https://ec.europa.eu/eurostat/statistics-explained/index.php?title=Main_Page
[13] BP Statistical Review of World Energy 2020-2022 (PDF) / BP / www.bp.com
[14] Official Statistics Office of Lithuania / osp.stat.gov.lt
[15] 2023 Country Report – Lithuania / economy-finance.ec.europa.eu/system/files/2023-05/LT_SWD_2023_615_en.pdf
[16] The Lithuanian Hydropower Association (LHA) / www.hidro.lt
[17] Statistics. Wind energy in Lithuania 2022 / lvea.lt/en/statistics
[18] Pagegiai 13" / www.stemma.lt/en/wind-energy/5-wind-energy
[19] National Energy and Climate Action Plan of the Republic of Lithuania for 2021-2030 / energy.ec.europa.eu/system/files/2022-08/lt_final_necp_main_en.pdf
[20] OFFSHORE WIND PARKS IN LITHUANIA / offshorewind.lt/en/
[21] European Energy to build 65MW solar plant in Lithuania / www.power-technology.com/news/european-energy-solar-plant-lithuania/
[22[ World Shale Resource Assessments / Last updated: September 24, 2015/ www.eia.gov/analysis/studies/worldshalegas/
图表和曲线的来源在图像下方指定。
有关立陶宛能源行业的更多信息,请参见此处